













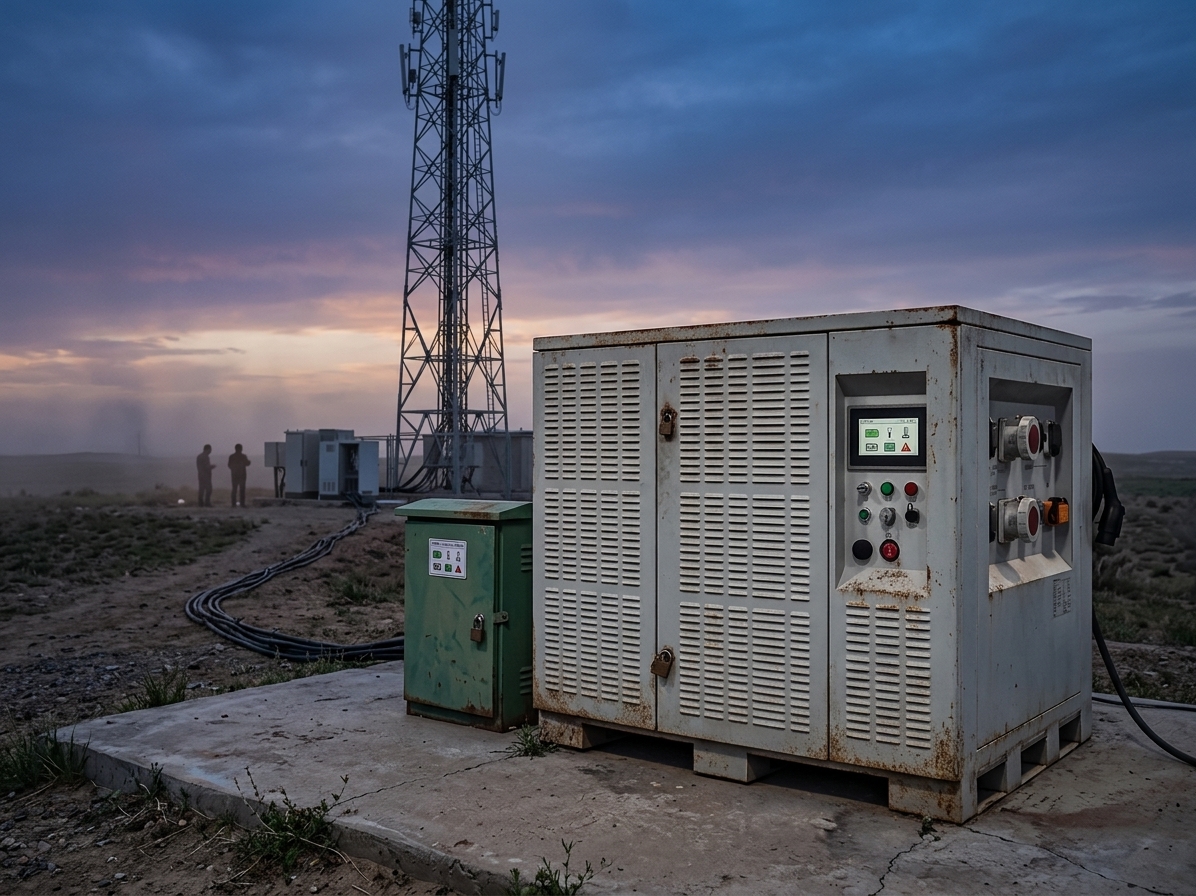
Remote backup power rarely fails in a clean, cinematic way. In real telecom operations, the failure usually looks boring right up until it isn’t.
Your remote site dashboard stays green: the rectifier reports normal float, the cabinet door sensor is closed, and the battery string voltage sits comfortably inside the band. Then you get a real outage — often a short 10–15 minute window — the load steps in, and the runtime collapses.
When you do the post-mortem, it’s rarely because the team “didn’t watch voltage.” It’s because battery float voltage is misleading as a readiness indicator. The early signals were already there in plain sight: repeated cabinet heat cycles, uneven cell temperatures and hot spots, slow drift in battery runtime under load, subtle voltage spread/imbalance inside the string, and alarm logs that looked like noise until they suddenly weren’t.
If you’re trying to prevent telecom battery backup failure at scale, that’s the misjudgment chain you have to design out.
Remote Backup Systems Look Normal — Until They Fail
If you manage hundreds or thousands of distributed sites, it’s easy to see why voltage became the default. It’s cheap, universal, and easy to pipe into legacy EMS/rectifier telemetry. It also looks objective: a number is either in range or it isn’t.
Here’s the kind of story ops teams recognize.
A mixed-load site in a hot, humid region runs “normal” for months. Rectifier shows normal float. Door closed. No obvious red flags. Then you get a short outage window. The load steps in, the DC bus sags harder than expected, and the site falls off before the expected minutes are up. When someone finally pulls the history, it’s not a single smoking gun — it’s a trail: daily heat cycles in the cabinet, a couple of nuisance events that kept clearing, and a runtime trend that was shrinking quietly.
But in the field, the mismatch shows up in a specific way:
The site passes a casual glance on the dashboard
A scheduled load test looks “fine” on voltage
Then the first cold morning or the first real outage exposes the weak cell and the string sags hard
That’s why voltage is a short-term electrical state, not a durability metric. A battery string can present “normal” float or open-circuit voltage while its ability to deliver runtime under load has already degraded.
In telecom backup specifically, this is not a theoretical risk. Philadelphia Scientific reports that VRLA-AGM cells can develop discharged negative plates while still on steady-state float charge, and that cell voltages can remain very uniform even as usable capacity degrades — which is exactly why float voltage can look “normal” right up to failure (see “Can VRLA Batteries Last 20 Years?” (Philadelphia Scientific)).
For remote sites, that mismatch creates a predictable operational failure pattern:
Voltage looks normal
Operators assume the system is healthy
Hidden degradation accumulates silently (temperature stress, SOH decline, alarms ignored)
No early warning is triggered
The system reaches an unstable state under load
A sudden outage occurs
Post-failure analysis reveals missed signals
The point of remote battery monitoring is not “more data.” It’s breaking this chain early enough that you can act when a truck roll is still optional.
Battery Failure Happens Below the Voltage Threshold
What temperature looks like in real telecom logs
Temperature rarely trips a dramatic “battery alarm” by itself. What you see first is messy, repetitive evidence: cabinet temps riding high every afternoon, hot spots near the top of the rack, or a site that runs “warm” week after week — often showing up as persistent cell-to-cell temperature delta rather than a single extreme reading.
A common field pattern looks like this: hot season arrives, the cabinet is a bit overloaded, partial discharge cycles become routine, and everything still looks fine on float. Then three months later the same site that used to ride through a short outage window starts timing out early — not because the voltage threshold changed, but because the battery aged faster than anyone noticed.
How runtime degradation shows up in tests
In field logs, SOH degradation usually shows up first as runtime shrinkage, not dashboard alerts.
You see it when you ask the battery string to do real work: the DC bus dips harder at the load step, recovery takes longer, and repeat tests start delivering fewer minutes. Sometimes one string sags earlier than the rest. Sometimes the site “passes” on voltage but fails on delivered runtime.
The alarm pattern teams ignore until it becomes a failure ticket
Alarm history is where telecom battery failure early warning usually hides.
Weeks before the incident, logs often show repeat offenders: recurring high-temperature events, intermittent battery disconnects, charger anomalies that clear on their own, or nuisance alarms that get acknowledged and forgotten. What changes outcomes is not “having alarms.” It’s noticing recurrence early enough to schedule the visit before the outage does it for you.
Why Voltage Monitoring Fails in Remote Sites
What you see on the dashboard
Most remote monitoring views are built around “in range / out of range.” So a string that sits on normal float voltage looks healthy by default.
That’s exactly how battery float voltage is misleading turns into an operations problem: you can have a weak cell, rising internal resistance, or imbalance developing inside the string, and the dashboard still looks calm.
What it means in reality
Remote sites don’t see uniform discharge events. Loads vary by season, traffic, and equipment changes. If a site only experiences short micro-outages or shallow discharges, degradation can stay hidden.
That’s why people searching for remote site power outage causes often reach the same conclusion: the battery was never stressed in a way that matched the real outage window — until the day it was.
What breaks first during a real outage
The tell isn’t a static voltage number. It’s the under-load behavior:
A sharper voltage sag at the load step
Slower recovery after the event
More heat during charge recovery
Wider cell-to-cell voltage spread (imbalance) during the event
Those are the patterns that point to rising internal resistance and thermal stress — and they’re the practical backbone of backup power system failure prediction for field teams.
What Actually Defines Battery Health in Remote Systems
If you want telecom tower battery health monitoring to be actionable, define health the way the field experiences it: what the dashboard shows, what the runtime test proves, and what the trend says about next month — not just whether the float number looks tidy today.
Voltage is a safety signal, not a readiness forecast
Use voltage to catch gross problems (charging off, string disconnected, hard over/under conditions). But don’t use it to sign off on runtime. A string can “look normal” on float and still fall apart under a short outage window.
Temperature trends tell you whether stress is accumulating
One hot reading is a nuisance. A site that runs hot every day is a maintenance plan.
Trend is the key: persistent elevated cabinet temperature, repeated heat cycles, and hot spots are what quietly compress the replacement window and show up later as runtime collapse.
Runtime and alarm patterns are what change maintenance decisions
When you’re trying to avoid emergency dispatches, SOH and alarms are less useful as definitions and more useful as signals.
In field logs, SOH degradation usually shows up first as runtime shrinkage or slower recovery under the same test conditions. Alarm history becomes actionable when you look for recurrence and clustering — patterns that tell you the next outage won’t behave like the last one.
Why Failures Still Happen Even With Monitoring Systems
Even with monitoring in place, failures often persist for three operational reasons:
Threshold alarms are too conservative
Many sites only alert when conditions are already severe, which is too late for planned maintenance.
Operators focus on status, not trend
Dashboards optimized for “green/red” status train teams to ignore slow drift — exactly where early warning lives.
Maintenance is reactive, not predictive
If replacement is triggered by failures and emergency truck rolls, you will keep paying premium OPEX for avoidable events.
Where This Problem Happens Most
You see this pattern anywhere the site is remote, lightly instrumented, and expensive to service. The harder it is to send a technician, the longer “it looks normal” gets tolerated.
These deployments also tend to have higher thermal stress and less controlled discharge behavior, which is exactly where voltage-only monitoring breaks down.
Telecom base stations
Remote industrial sites
Off-grid hybrid systems
Harsh climate deployments
Moving From Voltage Monitoring to Multi-Signal Remote Battery Monitoring
Decision-stage operators don’t need a research project. They need a model that is realistic under field constraints: mixed chemistry fleets, limited sensors, limited connectivity, and legacy rectifiers that were never designed for rich analytics.
A practical upgrade is to move from “voltage as health” to remote battery monitoring as a multi-signal discipline:
Voltage + current (when available) to separate “system status” from “system behavior under load.”
Temperature, measured and trended (not just one sensor, not just spot checks).
SOH estimation as an operating metric (even when it is imperfect, direction and acceleration matter).
Alarm analytics (pattern, recurrence, escalation), not only instantaneous thresholds.
Imbalance cues (voltage spread / drift across cells or strings) as a practical proxy signal when direct impedance data isn’t available.
This is also how you make telecom battery monitoring decision-ready: you stop asking “is the voltage OK?” and start asking “is the risk accumulating?”
If you’re investigating recurring incidents, these are also the most common VRLA battery failure causes that voltage-only monitoring tends to miss: heat-driven aging, imbalance that shows up under load, and alarm patterns that never get escalated.
Warning: Heat problems are rarely one-time events. Vertiv notes that UPS battery life can be cut in half for every 10°C rise above 25°C — which means temperature persistence is a planning variable, not a footnote.
What this looks like as an evaluation framework
If you are choosing a monitoring system, a data model, or a maintenance SOP, the question isn’t “do we have voltage telemetry?” You already do.
The decision question is:
Can we detect risk while the battery still presents normal voltage?
Use these evaluation criteria:
Signal coverage: Do you have enough temperature granularity to detect hot spots, not just cabinet averages? DPS Telecom’s guide to UPS battery temperature monitoring is a good baseline for how teams think about this at scale.
Trend math: Can the platform compute trends (rate-of-change, persistence, recurrence), not just thresholds?
SOH visibility: Can you estimate usable capacity loss, even if only by periodic controlled tests or runtime proxies?
Impedance visibility: If you can’t measure impedance directly, can you at least infer rising internal resistance via load sag + recovery behavior (a practical form of battery internal resistance monitoring) or via imbalance cues such as widening cell-to-cell voltage spread?
Alarm quality: Can you de-noise alarms (nuisance filtering) and escalate on patterns (repeat offenders)?
Integration reality: Can it operate with your existing rectifiers/EMS/OSS, given serial interfaces and limited IP?
Actionability: Does each alert map to a specific action (inspect, derate, replace, retest), not just “warning”?
A practical TCO model
The economic case is usually not “batteries are expensive.” It’s that voltage-only operations force reactive maintenance, which multiplies truck rolls, overtime, SLA penalties, and secondary damage.
Use the table below as a decision model. Fill it with your own data.
Input category | What to enter | Notes / how to measure |
|---|---|---|
Fleet scale | Number of sites; number of battery strings per site | Separate legacy lead-acid vs LFP retrofits |
Reliability exposure | Outage cost per event; SLA penalty structure | Include penalties, credits, and escalation clauses |
Maintenance cost | Truck roll cost (labor + vehicle + travel); overtime multiplier | Treat “emergency dispatch” as a separate higher-cost tier |
Failure rate (baseline) | Events per 100 sites per year | Use your last 12–24 months; separate climate bands |
Monitoring cost | Hardware per site; platform subscription; integration effort | Include installation time and comms costs |
Battery replacement economics | Planned replacement cost vs emergency replacement cost | Emergency includes downtime + expedited logistics |
Thermal mitigation | Cost to improve ventilation/insulation vs life extension | Track cabinet temperature before/after changes |
Analytics impact | Expected reduction in emergency events (%) | Establish via pilot before scaling |
A simple ROI framing:
Annual avoided cost = (avoided outages × cost per outage) + (avoided emergency truck rolls × cost per emergency roll)
Annual program cost = monitoring platform + sensors + integration + planned maintenance overhead
ROI = (annual avoided cost − annual program cost) ÷ annual program cost
This turns your profile from “surprise” to “schedule,” which is the only sustainable form of predictive maintenance for battery backups.
Supplier requirements in a monitoring-enabled backup architecture
If you’re moving from “voltage-only visibility” to a remote battery monitoring system that can actually support maintenance decisions, the supplier question changes. You’re not just buying a battery. You’re building a monitoring-enabled backup architecture that needs:
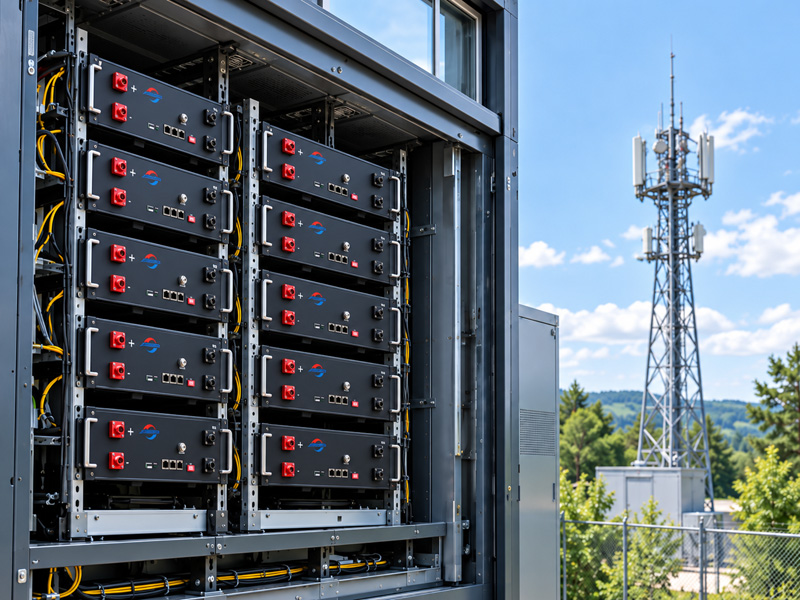
Pack/BMS-level signals you can trust (temperature sensing strategy, event logs, protection behavior)
System-level integration reality (rectifiers, site controllers, EMS/OSS, limited comms)
Audit-friendly documentation for rollout, acceptance testing, and ongoing maintenance
At this stage, the practical question is whether a supplier can deliver battery packs that expose the signals, logs, and compliance artifacts your monitoring program needs.
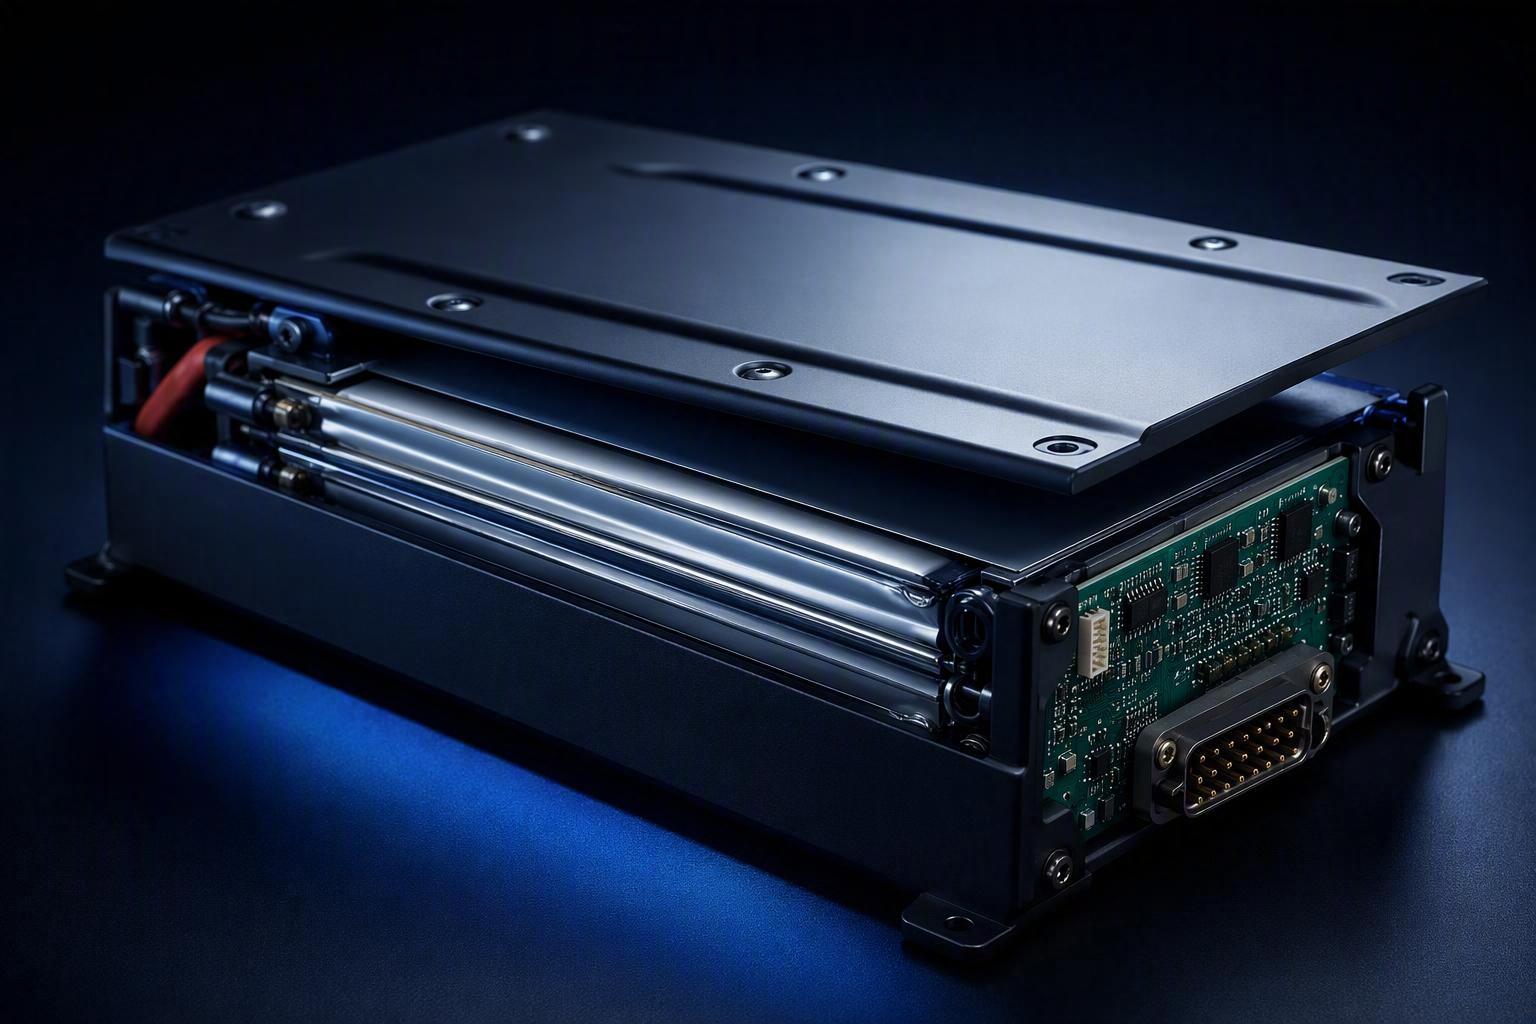
Ini dia. builds batteries with BMS capabilities and supports OEM/ODM programs where telemetry expectations and compliance documentation matter. For more on its approach to safety and monitoring, see Herewin’s BMS Technology Innovation for Battery Safety and Performance.
If your goal is fewer emergency dispatches, evaluate vendors on whether they can support the signals, logs, and integration hooks your monitoring program depends on — not only nameplate capacity.
Next steps: choose signals first, then thresholds
Voltage thresholds are a safety backstop, not a readiness test.
If you want to stop remote backup failures from showing up as “sudden,” build your program in this order:
Define the signals you will trust: temperature trend, SOH proxy, alarm pattern, and under-load behavior.
Define what trend triggers action (not just what number triggers an alarm).
Pilot on a climate-diverse cohort (hot/cold/mixed load) and measure avoided emergency events.
Roll out as an SOP with clear actions and an audit trail.
For a telecom O&M team, the easiest practical win is to add one more decision gate: when a site looks “normal,” require at least one non-voltage corroborator (temperature trend stability, no alarm recurrence, acceptable recovery behavior under a periodic test) before you classify it as “healthy.”
If there’s one takeaway, it’s this: battery readiness is a trend question, not a single voltage reading.
Pick your signals, define the actions they trigger, and you’ll turn “surprise outages” into scheduled maintenance decisions.




 Bahasa Indonesia
  English
  Español
  한국어
한국어  Deutsch
  Français
  日本語
日本語  Русский
  ไทย
ไทย  العربية
  Português do Brasil
  Italiano
  Nederlands