


Heavy-lift fleets rarely lose money because a battery is “bad.” They lose predictability because battery behavior is not consistent enough to model as an asset. This is not a ranked list of batteries. It’s a procurement framework for comparing solutions by variance and predictability.
The practical question isn’t whether a pack can hit a headline C-rate or a lab-rated cycle count. It’s whether you can bound the variance: pack-to-pack, batch-to-batch, and across the duty cycles you actually fly.
That framing is aligned with drone fleet ROI predictability: if energy output is not predictable, dispatch and cost-per-mission become hard to model with confidence. This article uses semi-solid technology as an evaluation candidate—not as a guaranteed outcome—to show how fleets can shift procurement from component specs to ROI predictability.
How Battery Performance Variance Impacts Fleet ROI in Heavy-Lift Drone Battery Procurement
Variance shows up as operating friction. The mechanism is usually not complicated, but it compounds across dispatch planning, spares, and maintenance timing.
How Inconsistent Battery Life Disrupts Fleet Scheduling
In heavy-lift missions, flight-time planning is a tight envelope: payload mass, hover time, climb profile, wind margin, and temperature constraints all compress the usable operating window.
When battery degradation is inconsistent across packs, the usable window becomes harder to predict. In practice, fleets often observe a pattern like this:
Pack A and Pack B share the same nominal spec.
Their effective flight time diverges after repeated high-load cycles.
Dispatch begins to rely on conservative assumptions rather than telemetry-backed bounds.
The operational impact tends to present as a chain:
Inconsistent fade (capacity retention and internal resistance drift differ across packs)
Uncertain mission energy budget (flight time becomes less predictable at a given payload)
Forced schedule redundancy (more “buffer time” and more spare packs staged)
Lower unit task efficiency (output per hour declines even when utilization looks high)
Procurement can’t fully solve scheduling, but it can define what “acceptable variance” looks like and require evidence that a supplier can control it.
The Hidden Cost of Unpredictable Capacity Loss
A common failure mode in battery purchasing is focusing on CAPEX line items while ignoring the cash behavior of spares.
When performance fluctuates, fleets often add “safety stock” to protect dispatch reliability. That buffer inventory is not free—even before a pack is used:
It ties up cash in inventory that exists primarily to absorb uncertainty.
It increases carrying cost (storage, handling, compliance packaging, periodic checks).
It can quietly increase operational cost volatility: you’re paying for uncertainty, not performance.
If the fleet’s ROI model requires staging extra packs to keep schedules stable, the battery is already functioning as a risk variable.
A practical procurement question to document early is: What spare ratio is required to keep dispatch stable under our mission mix? If that ratio moves materially by supplier or chemistry, it belongs in TCO.
C-Rate vs Lifecycle ROI: Rethinking Battery Selection Priorities
High C-rate performance is visible in the short term, which makes it easy to overweight during evaluation. Lifecycle stability is slower to reveal, which makes it easy to underweight.
For 2026 fleet operations, the weighting often shifts toward a different procurement priority: stable output and predictable degradation.
This shift doesn’t imply that C-rate is irrelevant. It implies that C-rate should be treated as one axis in a multi-axis selection model:
Peak power adequacy (does it meet the mission envelope?)
Thermal stability under continuous high load (does the pack stay within controlled temperature gates?)
Degradation predictability (is the fade curve smooth enough to schedule replacements?)
Pack-to-pack consistency (does the fleet scale without widening variance?)
If you want ROI predictability, the selection priority is less “highest short-term performance” and more “tightest operational bounds.”
Evaluating Semi-Solid Technology as a Solution for Operational Stability
The simplest way to make this decision “modelable” is to turn variance into a testable acceptance band. Define one representative duty cycle (payload, hover fraction, ambient temperature, charge cadence), then set pass/fail bounds for the variables that drive dispatch volatility (e.g., thermal rise profile repeatability, capacity retention slope, and internal-resistance drift) across a batch—not a single golden sample.
Minimal Executable Test Framework and Definitions
To keep “predictability” actionable, procurement needs a small set of shared definitions and a test skeleton that can be run on any candidate pack family.
Key definitions (use the same duty cycle for all):
Variance: the spread (distribution) of a KPI across packs in the same batch under the same duty cycle—not the average value.
Acceptance band: the pass/fail limits for that spread (for example, a max allowed dispersion in thermal rise or internal resistance drift across the batch).
Energy budget predictability: the variability of usable flight time (or usable energy) at a defined payload and environment.
Dispatch reliability: the share of scheduled missions completed without battery-driven replans; define battery-driven events up front (e.g., thermal alarms, BMS power derates, or SOH-based removals).
A minimal test skeleton (example):
Lock one representative duty cycle (document it): payload band, hover fraction, ambient temperature band, turnaround cadence, and charge rate limit.
Choose a batch sample size that exposes dispersion: test a minimum of N = 10–20 packs per lot (more if the fleet will scale quickly). One “golden sample” is not representative.
Measure the three variance drivers that create dispatch volatility:
Thermal repeatability: pack temperature rise profile vs time under the duty cycle (compare the curve shape and peak temperature across packs).
Degradation slope: capacity retention and internal resistance vs cycles under the same SOC window.
Control behavior consistency: BMS-triggered derates/alarms frequency under the same thresholds.
Turn results into acceptance bands (procurement-ready outputs):
Define pass/fail as bounds on dispersion (e.g., 90th–10th percentile spread) rather than a single “meets spec” number.
Require the supplier to provide lot identifiers + pack serial traceability so field telemetry can be mapped back to manufacturing lots.
This framework doesn’t prove a chemistry is “better.” It makes ROI predictability testable, so you can compare candidates by how tightly they stay within operational bounds.
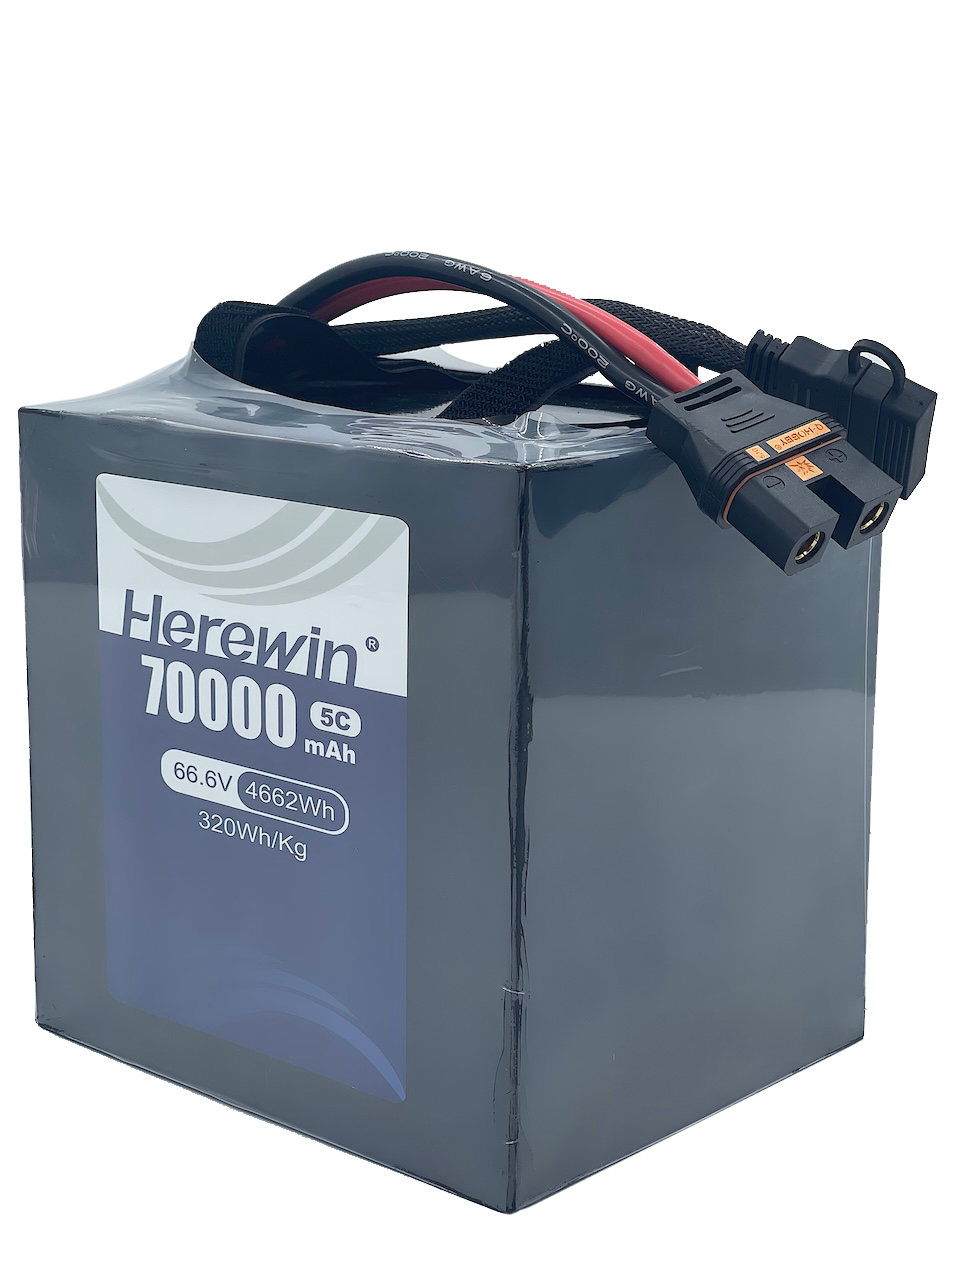
In practice, this is the lens we use at Herewin: we treat “semi-solid” as a design class to evaluate against one core procurement goal—tighter operational stability.
In our semi-solid vs. traditional lithium battery comparison, we outline how a gel-like electrolyte approach can affect energy density and lifecycle. The practical question is whether those characteristics reduce variance—especially in thermal behavior, degradation, and pack-to-pack consistency.
Stable Thermal Behavior Under Continuous High Load
Thermal behavior is one of the fastest paths from “spec compliance” to “field variance.” In heavy-lift duty cycles, sustained current draw tends to make temperature management a first-order constraint.
When a pack’s thermal behavior is stable, fleets often observe fewer operational interruptions that are triggered by temperature gates:
fewer forced cooldown intervals
fewer derates that reduce usable thrust margin
fewer mission aborts attributed to thermal alarms
In evaluation, the question is not “does it run cool?” It is:
How repeatable is the thermal rise profile across packs?
How does thermal behavior evolve as the pack ages?
What is the fleet’s operating envelope where thermal alarms begin to cluster?
Semi-solid designs are commonly discussed as having improved safety/thermal characteristics relative to conventional liquid-electrolyte packs in supplier materials. In a procurement model, those claims translate into a test requirement: validate thermal repeatability under your representative duty cycle, not a generic bench load.
Predictable Performance Degradation Over Lifecycle
Procurement teams can generally tolerate degradation. They struggle with unexpected degradation.
If the degradation curve is smoother and more predictable, fleets can plan replacements and prevent “surprise” pack removals that disrupt schedules. The operational shift is subtle but material:
from reactive replacement (failures trigger swaps)
to planned maintenance (telemetry and thresholds drive scheduled rotation)
The procurement artifact that supports this shift is not a headline cycle-life number. It is a fleet-facing degradation model:
defined SOC window assumptions
duty-cycle definition (payload, hover fraction, ambient temperature)
acceptance criteria for variance (e.g., bounds on capacity and internal resistance drift)
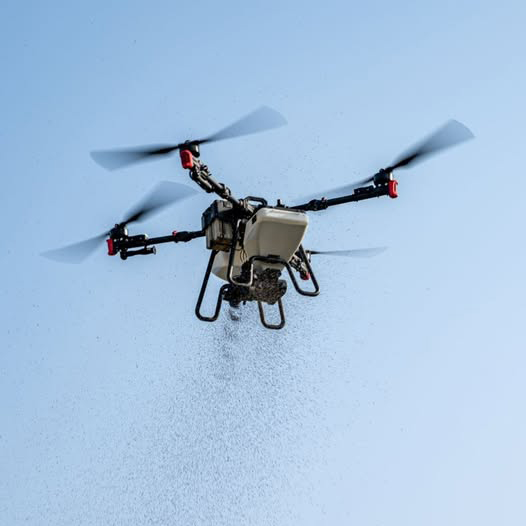
Across our drone portfolio, we offer semi-solid options in multiple categories—especially where higher power output, safety margins, and lifecycle stability are priorities (see Herewin drone battery solutions). For procurement teams, that breadth matters because it makes it easier to request consistency evidence at the category level—pack families, not one-off prototypes.
Consistency Across Battery Packs for Fleet Scalability
Fleet scalability often breaks on “small” dispersion: two packs that behave differently are not interchangeable in scheduling.
Higher consistency across packs supports:
more reliable dispatch planning (packs are closer to fungible)
simpler thresholding for maintenance (one set of triggers fits more of the fleet)
cleaner inventory policy (fewer edge-case spares staged “just in case”)
In procurement, consistency is less a marketing claim and more a QA and traceability question:
What batch-level data is available?
What pack-level identifiers link telemetry back to manufacturing lots?
What incoming inspection is feasible without shutting down ops?
This is also where compliance and shipping discipline can affect operational predictability. If lead times and documentation are inconsistent, a fleet may carry more buffer inventory regardless of chemistry. At a minimum, fleets typically align safety/transport evidence with recognized frameworks such as UN Manual of Tests and Criteria, Part III, subsection 38.3 for transport testing and battery safety standards like IEC 62133 그리고 UL 2054, depending on the market and application. For procurement teams building a compliance baseline, Herewin’s industrial drone battery compliance guide provides a reference point for how compliance artifacts are framed.
Building a Predictable Asset Model for Drone Fleet Operations
A predictable asset model does not require perfect batteries. It requires metrics that allow uncertainty to be bounded and managed.
Dispatch Reliability as a Core KPI for Battery Evaluation
If fleet ROI is the target, procurement typically ends up answering two operational questions:
Can the fleet dispatch consistently?
What is the output per hour when dispatch is stable?
Dispatch reliability becomes a battery KPI when battery variance is one of the main constraints on schedule adherence.
You can treat dispatch reliability as an explicit KPI: it describes whether the fleet can meet scheduled missions without battery-driven replans.
A minimal KPI definition set that procurement can enforce (and ops can measure) typically includes:
Dispatch reliability: fraction of scheduled missions completed without battery-driven reschedules (define what counts as battery-driven).
Throughput per hour: missions or payload-tonne-km per operating hour, with downtime classified.
Energy budget predictability: variance in usable flight time at a defined payload and environment.
In heavy-lift fleets, realized ROI is often bounded by dispatch stability. Battery selection that reduces variance tends to show up as higher realized utilization, not just better spec sheets.
For deeper battery evaluation frameworks oriented toward industrial use, Herewin’s industrial drone battery buyer’s guide (2026) is a relevant internal reference.
Reducing Buffer Inventory Through Lifecycle Predictability
Buffer inventory is a rational response to uncertainty. If the fleet cannot predict which packs will underperform, it increases spares.
If lifecycle behavior is predictable—meaning packs age within a tight band under defined duty cycles—procurement can model a smaller buffer inventory policy.
Two practical changes often follow:
Lower spare ratio because pack interchangeability improves.
Less cash tied in inventory because procurement can schedule replenishment and retirement with more confidence.
This is also where battery data quality becomes a procurement requirement. If SOC/SOH estimates are not consistent, variance management becomes harder and the fleet may revert to conservative buffers.
Scenario-Based TCO Modeling for Procurement Decisions
A lightweight template that works well in practice:
Scenario definition: payload band + hover fraction + ambient temperature band + turnaround cadence
Battery operating window: SOC window + charge rate limit + thermal gate assumptions
Cost inputs: pack price + spare ratio + expected retirement threshold + logistics/compliance overhead
Outputs to compare: replacement interval band + cost per mission band + dispatch reliability target held/not held
The decision is rarely “lowest cost.” It is often “lowest cost that stays within predictable bounds.”
Scenario-based TCO modeling is a way to make that explicit. A practical model structure for heavy-lift fleets is:
Define scenarios (not averages):
Mission type (hover-heavy vs cruise-heavy)
Payload bands
Ambient temperature bands
Turnaround intensity (charge-and-fly cadence)
Define cost components:
acquisition cost (packs + spares)
charging infrastructure and downtime costs (if modeled)
replacement and disposal handling
compliance/shipping and documentation overhead
Define predictability outputs:
expected replacement interval band (not a single date)
spare ratio needed to hold dispatch reliability above a chosen threshold
variance range for cost per mission
If your model can’t produce a bounded cost range per scenario, it is not a procurement model—it is a price comparison.
For readers who want a broader evaluation baseline, Herewin’s industrial drone battery evaluation guide can be used as an internal reference for what dimensions are commonly considered.
From Battery Components to Predictable Fleet Assets
In heavy-lift operations, batteries aren’t merely consumables. They behave like operating assets when their variance can be bounded, measured, and scheduled.
That reframes procurement priorities:
from parameters to outcomes
from unit price to cost predictability
Semi-solid technology is often described as “more advanced,” but the procurement case is narrower and more testable: evaluate whether it reduces operational uncertainty—thermal excursions, degradation surprises, and pack-to-pack dispersion—under the duty cycles that drive dispatch volatility.
A practical takeaway is to evaluate fleet performance consistency (not just mean performance), and apply a scenario-based TCO assessment that treats predictability as a first-class output.