










The main potential advantage of a semi-solid battery is higher cell-level energy density. Some vendor-reported semi-solid cells are quoted at around 300–400 Wh/kg at cell level, while conventional lithium-ion cells cover a much wider range depending on chemistry and format. That figure is not an industry-wide benchmark, and it applies to a cell, not to a finished pack. Research has been conducting new tests to separate the cell-level performance claims from pack-level performance. But note: “conventional lithium-ion” is a technology class, not a single numeric baseline. The correct reference is always the chemistry and cell format you would actually use in the project, not a generic industry average.
A real comparison therefore runs through four levels: cell, pack, operating condition, and lifetime cost. Each factor below is stated the same way — what semi-solid may change, and what the buyer must verify.
|
Factor |
Semi-Solid |
Conventional Li-ion |
What to verify |
|---|---|---|---|
|
Energy density |
Vendor-reported around 300–400 Wh/kg at cell level |
Wide range by chemistry and format |
Whether the figure is cell or pack, and at what C-rate |
|
Safety |
Performance depends on electrolyte architecture and test conditions |
Extensive abuse-test data across established chemistries |
Which abuse test, at what SOC and temperature, cell or pack |
|
Cycle life |
Vendor claims vary widely |
Established ranges by chemistry |
Capacity-retention threshold, C-rate, depth of discharge, temperature |
|
Low-temperature performance |
Not established in the sources reviewed |
Chemistry-dependent, documented |
Discharge capacity at a stated temperature and rate |
|
Cost |
Premium over conventional cells |
Commodity pricing at scale |
Cost per cycle and lifetime energy cost, not cost per kWh alone |
|
Application fit |
Weight-constrained, high-utilization duty cycles |
Broad, including cost-sensitive and high-rate use |
Your own weight, utilization and duty-cycle numbers |
What Is a Semi-Solid Battery?
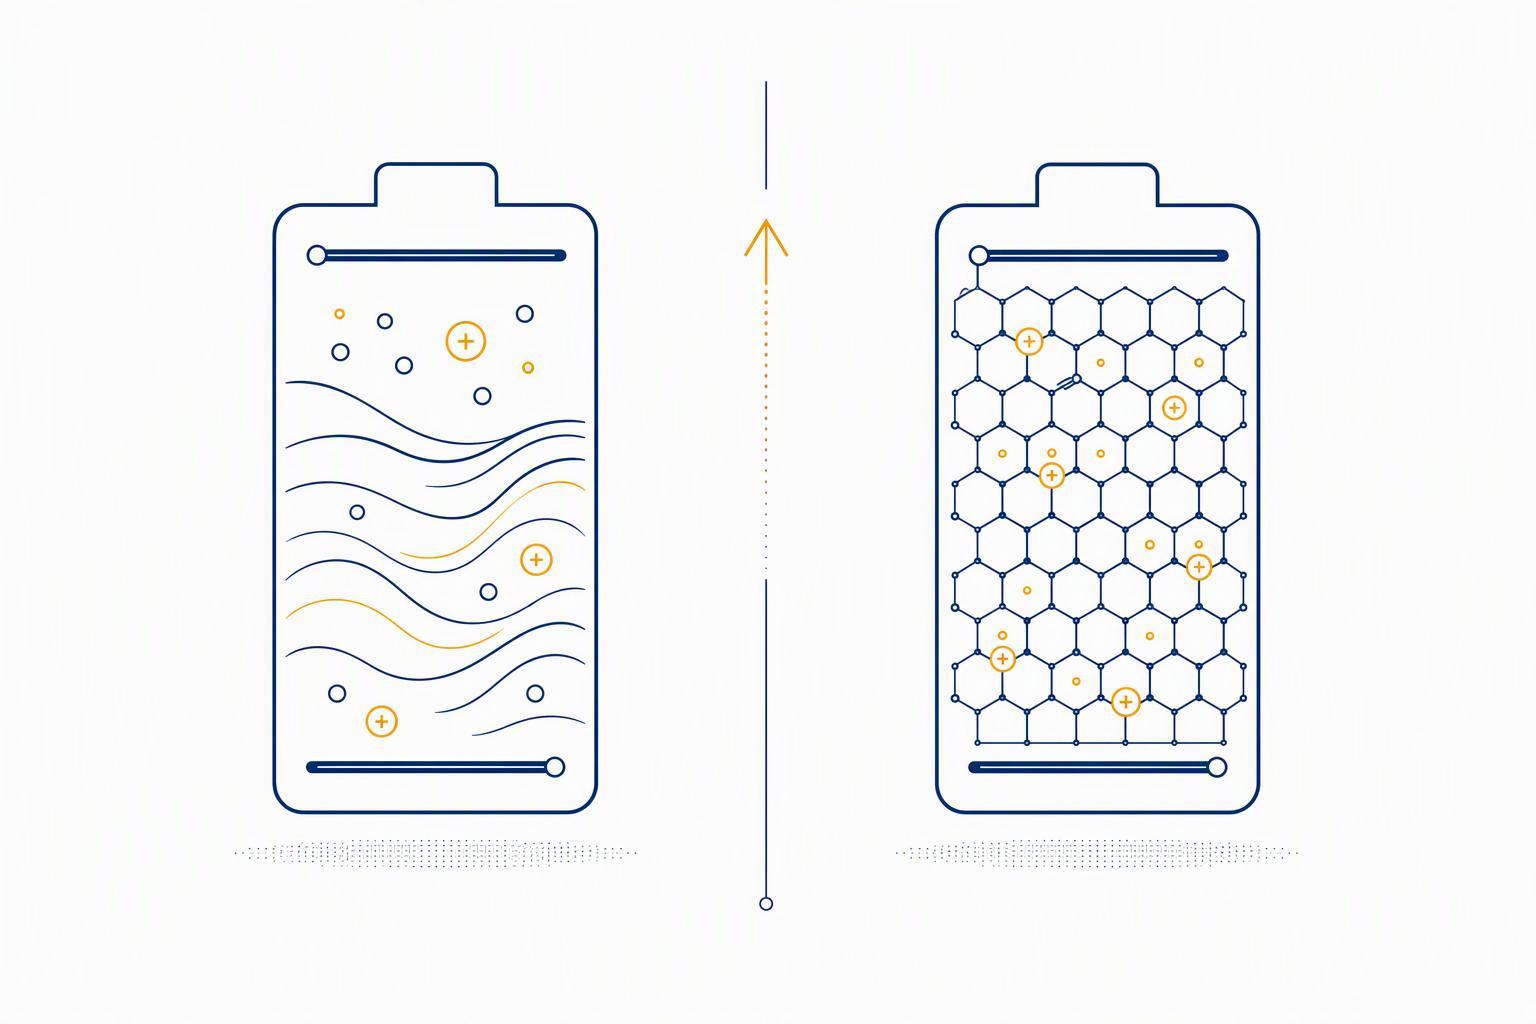
A semi-solid battery generally uses an electrolyte system in which the liquid component is partially immobilized or combined with a solid or gel-like matrix, while the cell keeps a separator and conventional electrode chemistry. The exact architecture varies by manufacturer and chemistry, so the defining feature is the electrolyte design, not a fixed liquid percentage. You may also see the unhyphenated term “semi solid state battery” in search results, though technical literature more often uses “semi-solid” or “semi-solid-state.”
One common implementation is a gel-like matrix, in which a polymer structure traps a liquid component so the electrolyte gains more of the mechanical stability of a solid while retaining liquid-like ionic conductivity. Because manufacturers, papers and industrial roadmaps define semi-solid, quasi-solid and gel-polymer electrolytes differently, you can’t judge the category by how much liquid it contains alone.
There is no universally accepted liquid-electrolyte percentage that defines every semi-solid system. Published classifications use different thresholds for semi-solid, quasi-solid and all-solid designs, while manufacturers may not disclose their exact electrolyte composition (PMC/NIH, Solid-state batteries: from ‘all-solid’ to ‘almost-solid’).
In practice, semi-solid designs tend to move in a consistent direction, even when the exact chemistry differs. The positive electrode is usually paired with a solid or gel-like electrolyte layer. The anode may shift toward higher-capacity materials such as silicon-carbon blends. The separator is often replaced or thinned by a coated or electrolyte-bearing film, and pouch packaging is common because it tolerates the volume change that comes with higher-capacity electrodes. Treat these as upgrade directions rather than a specification: which of them a given product actually uses, and to what extent, is a question for the datasheet and the test report.
Semi-solid is a design space, not a fixed liquid percentage. Ask for the electrolyte composition and the measured liquid fraction, because the label alone will not tell you.
How Semi-Solid Electrolytes Differ From Conventional Li-ion Designs
A conventional lithium-ion cell uses a liquid electrolyte to wet the porous electrodes and separator. A semi-solid design reduces, immobilizes or partially replaces the mobile liquid component with a solid or gel-like matrix, depending on the architecture, and the electrolyte tends to behave mechanically more like a solid while still conducting ions. The design goal is to lower the amount or mobility of liquid electrolyte while keeping ionic conductivity and electrode contact usable. Depending on the chemistry and architecture, this may also influence thermal-safety and lithium-plating behaviour, but those outcomes still need to be demonstrated at cell level rather than assumed from the design intent.
Semi-Solid Battery Is Not the Same as a Solid-State Battery
Semi-solid is not solid-state, and the market has blurred the two. Terminology is inconsistent, and some products described publicly as “solid-state” still use hybrid or quasi-solid electrolyte systems.
|
Axis |
Semi-solid |
Solid-state |
|---|---|---|
|
Electrolyte |
Gel-like matrix with residual liquid |
Solid electrolyte, no liquid |
|
Commercial maturity |
Commercial examples available |
More limited commercial availability |
|
Manufacturing |
Can retain more existing Li-ion manufacturing infrastructure |
New processes and equipment |
For a buyer, the consequence is simple: a “solid-state” claim on a datasheet is not evidence of a solid electrolyte. Ask which phase the electrolyte is in, and treat the label as a starting question rather than an answer.
Semi-Solid vs Lithium-Ion: Key Differences
The chemistry changes less than the datasheet implies. What changes is where the limits sit, and how much of the cell-level advantage survives into a finished pack. Read any semi-solid vs lithium-ion batteries comparison with one rule: a number is incomplete until it carries the level it was measured at, the conditions it was measured under, and the sample it came from.
Energy Density — Cell vs Pack
A cell-level figure does not tell you the energy density of the finished pack. Semi-solid cells are quoted in a higher range than conventional lithium-ion cells, but that gap narrows once the pack is assembled, and by different amounts depending on cell format.
The principle is general and worth stating on its own: the retention from cell to pack depends on cell format, pack architecture, cooling, enclosure, BMS and structural integration, so it varies by design. There is no single industry-wide pack retention ratio for semi-solid cells, and no ratio borrowed from another chemistry can be substituted for your own pack. The pack must be measured rather than estimated.
Pack Wh/kg = Pack energy ÷ Pack mass
The mass consumers are cells, BMS, busbars, enclosure, cooling, connectors and structural components. Ask for both figures, at both levels, before comparing semi-solid battery pack energy density across suppliers.
Why Higher Wh/kg Matters in Weight-Constrained Applications
In any weight-constrained system, pack energy density converts into useful output through a mass chain: battery mass sets total system mass, total mass sets the power required to move or hold it, required power sets the energy drawn per unit time, and energy drawn per unit time sets usable operating time. Reducing battery mass can improve the system’s overall mass and power balance, but the resulting change in operating time has to be calculated from the power-demand curve of the actual application. It does not follow directly from the battery mass reduction.
A higher pack-level Wh/kg does two useful things: it can reduce battery mass for the same stored energy, or it can increase usable energy within the same mass budget. The resulting gain in operating time is not proportional to the Wh/kg increase, because power demand changes with total system mass and duty profile — any vendor framing it as a fixed percentage is skipping the power curve. That effect weighs heaviest in systems where every kilogram is contested, such as UAVs, where battery mass trades directly against payload and endurance.
Safety — What Has Actually Been Tested?
Semi-solid is not fireproof, and no supplier should tell you it is. Abuse testing judges a cell against predefined failure criteria rather than a single pass mark, as set out in Sandia’s abuse-testing practice manual (July 2017), which uses defined failure criteria for events such as fire, explosion, rupture, leakage and propagation, depending on the test being performed.
One claimed mechanism is worth understanding, because it shapes what you should ask about. A solid or gel-like matrix is intended to give the electrolyte more mechanical resistance, which may make it harder for lithium dendrites to grow through the separator and reach the opposite electrode — the path that leads to an internal short. Lowering the mobile liquid fraction is also intended to reduce the amount of flammable material available if the cell does overheat. Both are plausible design goals rather than guaranteed outcomes, and both depend on the specific chemistry and architecture.
A propagation test asks whether failure stays contained inside the module or pack, which is a different question from how a single cell behaves in isolation.
Standards differ in the test conditions, states of charge, temperatures and failure criteria they apply, per the JRC overview of battery safety tests in standards. Two suppliers can both report a “pass” while testing to different criteria. Read semi-solid battery safety as a test report, not a category.
Every safety claim maps to a piece of evidence you can request in writing:
|
Claim |
Ask the supplier for |
|---|---|
|
“Safer” |
Abuse test method and reported outcomes |
|
“No thermal runaway” |
Test conditions plus the failure criteria applied |
|
“No propagation” |
A pack- or module-level propagation report |
|
“Low-temperature capable” |
The measured discharge curve at the stated temperature |
|
“Long cycle life” |
DoD, C-rate and end-of-life threshold behind the number |
If a supplier cannot provide these conditions, treat the number as a claim to be validated rather than a directly comparable specification.
Temperature Performance
Charging and discharging are two different questions in the cold. Many lithium-ion cells restrict charging below 0 °C because of lithium-plating risk, but the permitted operating window is cell-specific and depends on chemistry, cell design, charge rate and any heating or management system in the pack. Discharge typically continues well below the charge limit.
The mechanism is physical. As temperature drops, electrolyte conductivity and charge-transfer kinetics decrease while resistance increases. Under sufficiently high charging current, these conditions can increase the risk of lithium plating on the graphite anode (Low-Temperature Electrolytes for Lithium-Ion Batteries, PMC, 2025). That is why charging is more temperature-restricted than discharging. Ask for the discharge envelope and the charge envelope separately, at stated C-rates.
Semi-solid architecture alone does not establish superior low-temperature performance. The relevant evidence is the measured charge and discharge curve of the actual cell at the intended temperature and C-rate, not the chemistry label. Treat any claim of a cold-weather advantage as something to be tested on the specific cell you are buying.
Cycle Life
Cycle life is a function of depth of discharge, temperature and C-rate, not a property of the chemistry alone. The same cell can be quoted at very different cycle counts depending on how it is cycled, which is why a bare cycle count is not comparable until the test conditions are matched. What you need is the test frame behind it: state of charge window, depth of discharge, charge and discharge C-rate, ambient temperature, and the end-of-life threshold used to end the test.
Semi-solid figures are quoted in exactly the same loose way. Where a supplier publishes a semi-solid cycle-life figure, ask what chemistry and cell model it belongs to, because cycle life can vary substantially with chemistry, cell design and test conditions — the semi-solid label alone is not enough to predict it. Compare cycle counts only when depth of discharge, temperature, C-rate and end-of-life threshold match; run one vendor’s 80 percent DoD figure against another’s 20 percent DoD figure and you have compared nothing.
Charging Behaviour
Charge rate is set by what the cell will accept without plating and by what the pack can remove as heat. Ask for the charge curve, not the peak number: at what ambient temperature, from what SOC to what SOC, at what C-rate, with what temperature rise.
Rule of thumb: Don’t compare peak numbers. Compare the operating window.
Semi-Solid vs LiFePO4: A Different Trade-Off
Search demand shows a meaningful comparison between semi-solid and LiFePO4, so it is worth addressing directly here — but the two are not interchangeable technology classes, and treating them as competitors to the same question leads to the wrong conclusion. LiFePO4 generally offers lower energy density than high-energy lithium-ion chemistries, while its cost and cycle-life behaviour can make it attractive where mass is less restrictive. Its pack-level figures also differ from NMC and NCA largely because of cell format and pack design. The exact numbers are chemistry- and format-specific, so the relevant baseline should be taken from the specific chemistry you would actually displace in the project, not from a single headline range.
So the semi-solid vs LiFePO4 decision turns on which constraint binds first. LFP tends to become more relevant when weight is less restrictive and cycle-life cost, thermal behaviour and upfront cost carry greater weight in the decision. Semi-solid becomes more relevant when every kilogram of pack mass costs payload or flight time. The comparison should be tested against your pack mass budget and annual cycles before either option is ruled in.
Semi-Solid Battery Cost: Upfront Premium vs Lifetime Cost
Semi-solid cells generally carry a premium over mature, high-volume lithium-ion cells, and the driver is the maturity of the manufacturing base rather than the chemistry alone. Treat the premium as a directional expectation rather than a quoted market price, and confirm it against your own pack-level quotation. The procurement metric that matters is whether the added pack performance reduces cost per cycle or lifetime energy cost, not how large the percentage premium looks. The rest of this section works through that question.
Upfront Battery Cost
Expect the premium to be largest at cell level and to compress once you price a finished pack, because pack-level cost adds the same BMS, enclosure, busbar and assembly content on both sides. Treat any index-level premium as a negotiation starting position, and price the assembled pack before drawing a conclusion.
Why Manufacturing Maturity Affects Cost
The cell-level price gap reflects production scale, process yield and manufacturing maturity, not the electrolyte concept alone. Semi-solid production lines run at lower volume and with less accumulated process learning than mainstream lithium-ion lines, so per-unit cost carries the overhead of a smaller, less stable production base. That is why cell-level price comparisons can exaggerate or hide the actual pack-level difference, and why only a landed pack quotation shows what you will pay.
|
Tier |
Semi-Solid |
Conventional Li-ion |
|---|---|---|
|
Cell level |
Premium |
Baseline |
|
Pack level |
Premium narrower than at cell level |
Baseline |
Directional, not a quoted purchase price.
Cost Per Cycle and Lifetime Energy Cost
Two different metrics get called “cost per usable cycle”, and mixing them hides the real answer. Keep them separate.
Cost per cycle = Battery cost ÷ Expected cycles
This is the capital cost of one full cycle, whatever energy it delivered. For partial-depth cycling, use equivalent full cycles (EFC) rather than counting calendar charging events, so a 30 percent depth-of-discharge pack is not credited with the same cycle as a full one.
Lifetime energy cost = Battery cost ÷ (Usable energy per cycle × Expected cycles)
This is the cost of each usable kilowatt-hour the pack delivers over its life, which is the number that matters when energy throughput, not cycle count, sets the duty cycle.
Example assumption:
A USD 2,000 pack delivering 4 kWh usable per cycle over 1,500 cycles costs 2,000 ÷ 1,500 = USD 1.33 per cycle, and 2,000 ÷ (4 × 1,500) = USD 0.33 per kWh delivered. Both numbers describe the same pack; they answer different questions. The inputs you must supply are purchase price including freight and duties, usable energy at your stated depth of discharge, cycle life measured at that same depth, and replacement labour and downtime.
When Does a Semi-Solid Battery Make Sense?
Application fit decides this, rather than chemistry preference. Semi-solid technology becomes more relevant to evaluate when the pack mass budget is the binding constraint and the platform operates often enough to amortise the premium. The profiles below are cases where semi-solid should be included in the comparison set.
Weight-Constrained Applications
Weight is the argument here. If every kilogram removed from the pack converts directly into payload, range or flight time, the pack-level gain has a clearer opportunity to create operating value. The mass chain from the earlier section is the test: whatever the cells save, the BMS, busbars, enclosure, cooling and connectors give back. A semi-solid battery in a weight-constrained design makes sense when the net figure after that chain is still positive and the program is measured against a hard mass budget rather than a cost budget.
High-Utilization Applications
High utilisation shifts the decision to cycle life and temperature envelope. A pack that cycles daily for years is bought on cost per usable cycle, not sticker price, so the semi-solid battery cycle life figure only matters if it was measured at your depth of discharge, your C-rate and your ambient temperature. Ask for those conditions before treating a cycle count as a comparison input. Where a program runs at low utilisation, the same premium buys fewer cycles over the asset’s life and the case weakens.
Cost-Sensitive Applications
When the binding constraint is budget per kilowatt-hour rather than mass per kilowatt-hour, an established chemistry belongs in the comparison set, and LFP is the usual candidate. LFP sits on a mature, high-volume cost curve that semi-solid production has not reached. That profile fits packs that are stationary or weight-tolerant, duty cycles that are modest, and procurement where the cheapest compliant kilowatt-hour is the deciding metric. Where the weight or utilisation gain converts into something the operator can bill for, it is worth pricing semi-solid against the same duty cycle. Where it does not, both options stay open until measured under identical conditions.
High-Rate Applications
Where the platform is limited by continuous or peak current rather than by mass, the decision changes again. The C-rate the cell can hold without derating, voltage sag under load and the thermal path that removes heat matter more than the Wh/kg advantage, so a cell that wins on density can lose on rate capability. Evaluate high-rate candidates against the same current profile and duty cycle, not against a headline energy-density figure.
The table below translates each binding constraint into a measurement plan: which numbers to compare first, and what result would change the decision. The entry point moves with your duty cycle, your mass budget and your annual cycles.
|
Your binding constraint |
What to compare first |
What could change the result |
|---|---|---|
|
Payload or weight ceiling |
Pack Wh/kg plus usable energy within the mass budget |
Pack-level gain too small after BMS, enclosure and thermal hardware |
|
Cost per kWh |
Landed pack cost plus lifetime energy throughput |
Higher upfront cost is offset by lower lifetime energy cost or measurable operating value |
|
Cycle life at low depth of discharge |
Equivalent full cycles, DoD and ambient temperature |
Cycle-life advantage disappears under the actual DoD and temperature conditions, or the measured difference is too small to offset the cost or mass difference |
|
Continuous or peak current |
C-rate, voltage sag under load and temperature rise |
Density gain survives the rate and thermal test |
The comparison should therefore start with the constraint that limits the system, then test whether each candidate removes that constraint without creating a larger one elsewhere.
What Does This Mean for Drone and UAV Batteries?
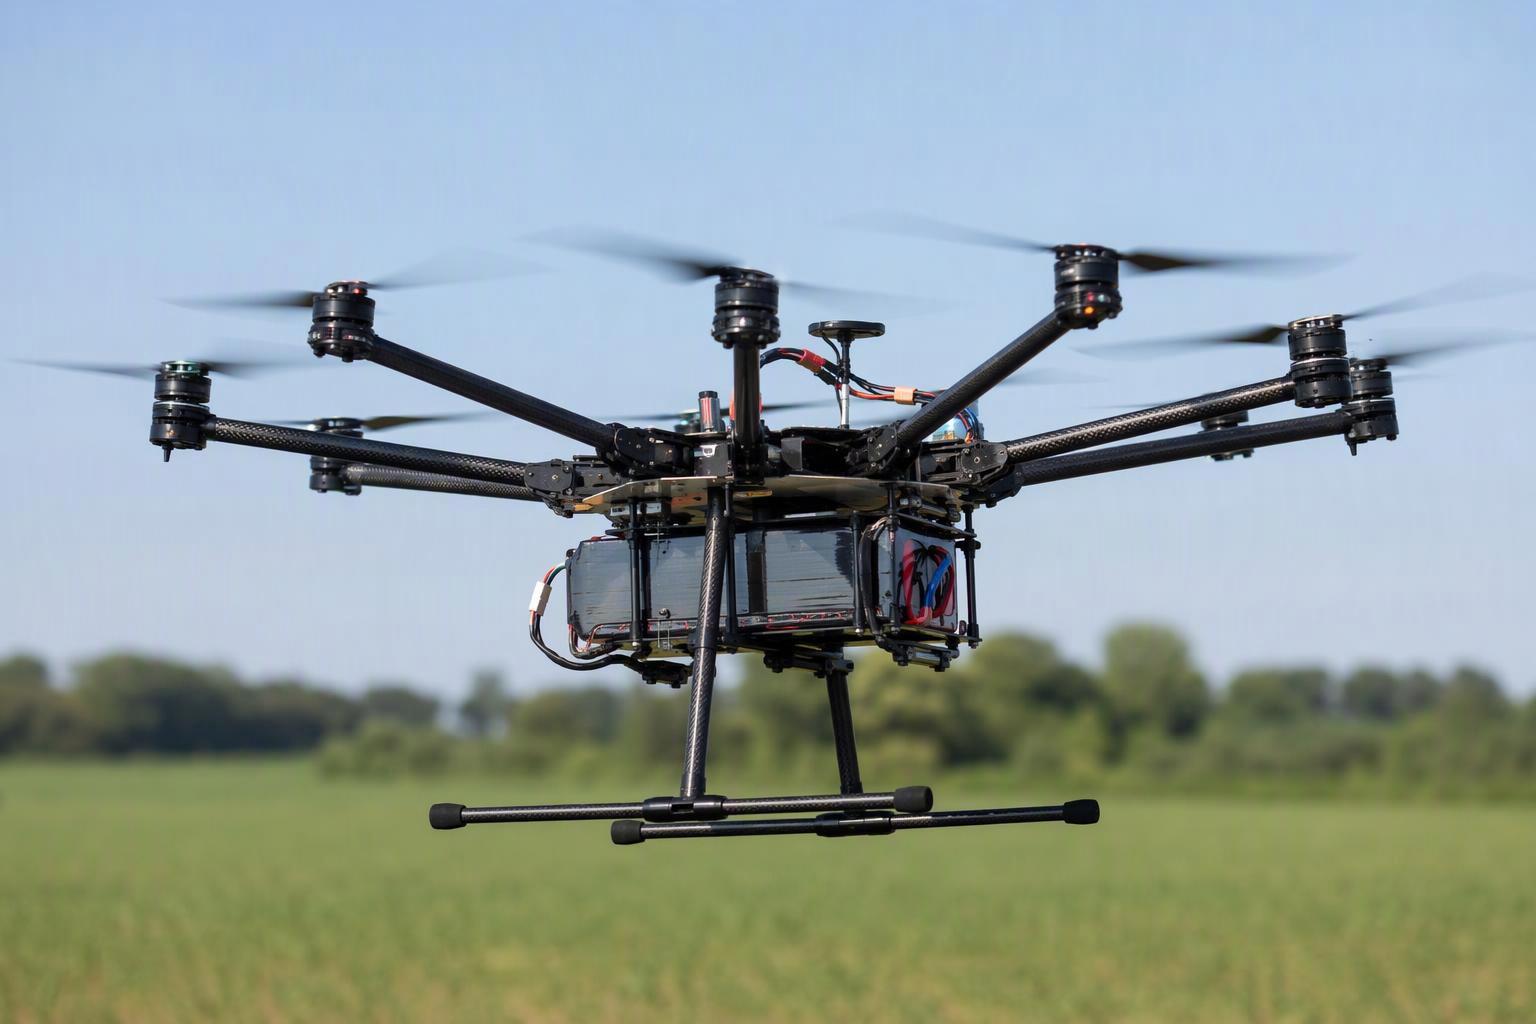
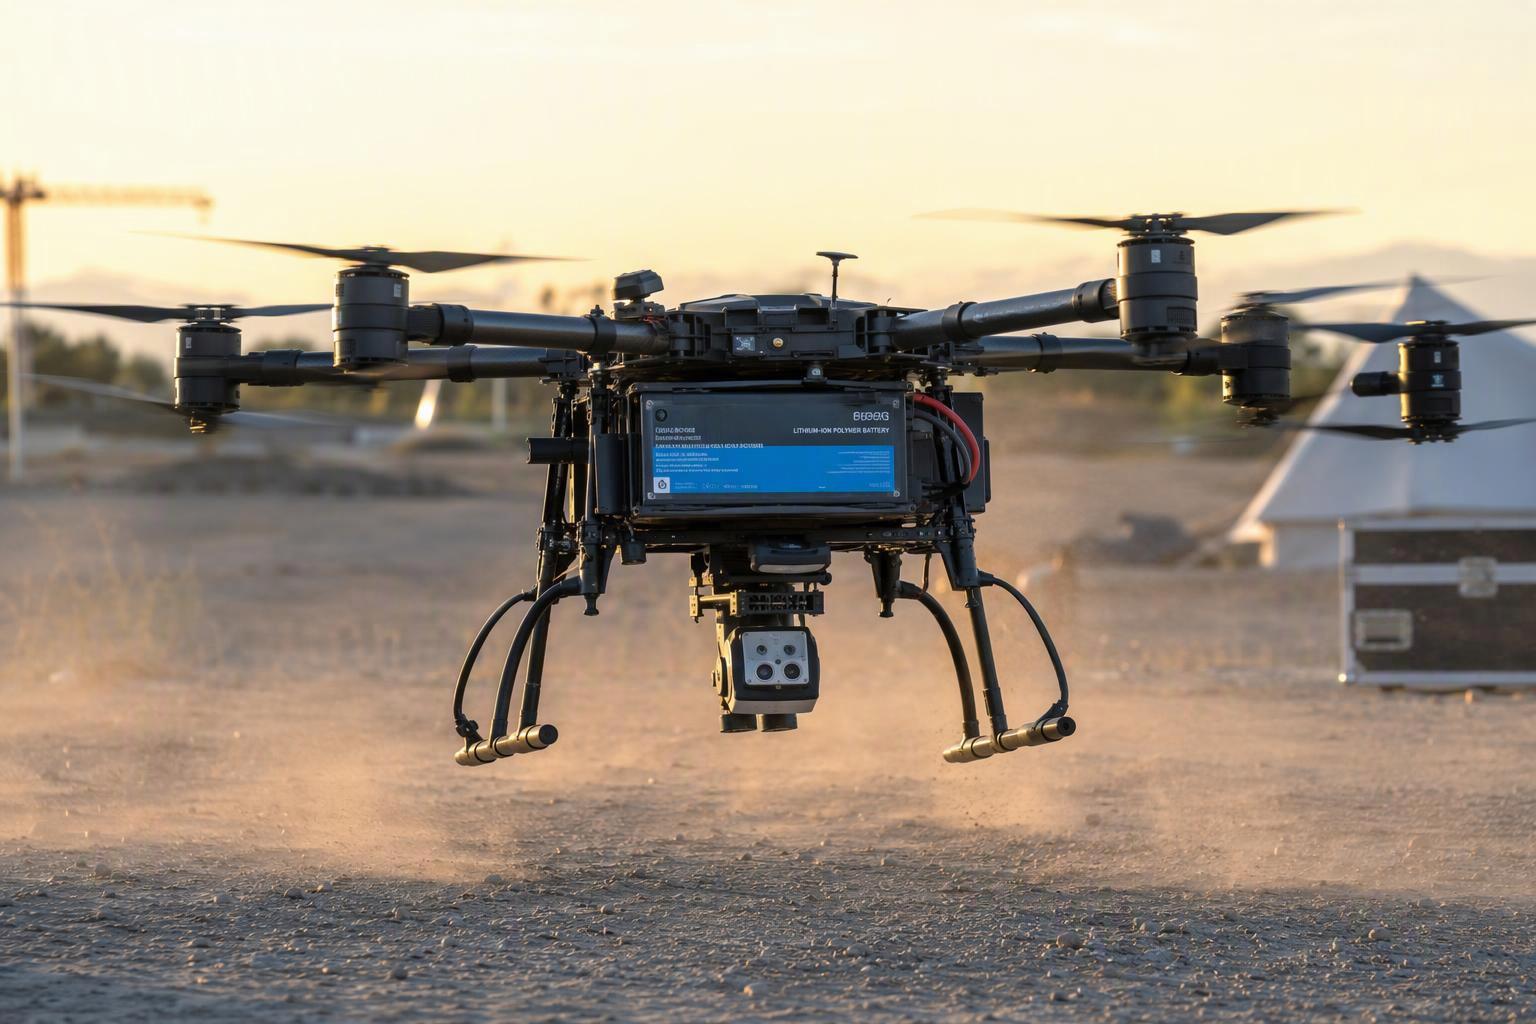
A UAV is the clearest worked example of the weight-constrained profile, because every gram the battery adds is a gram the airframe cannot spend on payload, structure or endurance. The evaluation criteria from the sections above apply directly, but they apply at pack level, under the duty cycle the aircraft actually flies.
The mission profile decides which battery factors matter, so start there rather than with a chemistry preference:
|
UAV type |
Primary constraint |
Dominant battery factors |
|---|---|---|
|
Mapping / inspection |
Endurance |
Pack Wh/kg, usable energy within the mass budget |
|
Agricultural spraying |
High utilisation + payload |
Pack Wh/kg, C-rate, cycle life at high DoD |
|
Heavy-lift |
Payload + current |
Pack mass, continuous and peak current, thermal path |
|
FPV / high-rate |
Power delivery |
C-rate, voltage sag under load, thermal behaviour |
The table changes the evaluation itself: a mapping platform and an FPV platform can reach opposite conclusions about the same cell.
Apply the same criteria to all four profiles, and the priorities diverge. Mapping and inspection platforms are endurance-limited, so pack-level Wh/kg within the mass budget usually settles it. Agricultural spraying adds high utilisation to payload, so the premium has more cycles to amortise — if cycle life holds at the mission’s depth of discharge. Heavy-lift platforms are payload- and current-limited, so pack mass, current and the thermal path outweigh a density headline. FPV and high-rate platforms are power-limited, where C-rate, voltage sag and thermal behaviour decide, and a cell that wins on mass can lose on rate. For any UAV, lifetime cost converts into cost per flight hour:
Cost per flight hour = Battery cost ÷ (Equivalent full cycles × Flight hours per cycle)
This is useful only when cycle life and flight time are measured under comparable operating conditions. The economic question is how additional endurance or payload translates into operating output, and low-utilization aircraft may take longer to recover the higher upfront cost.
Pack-Level Wh/kg and Beyond
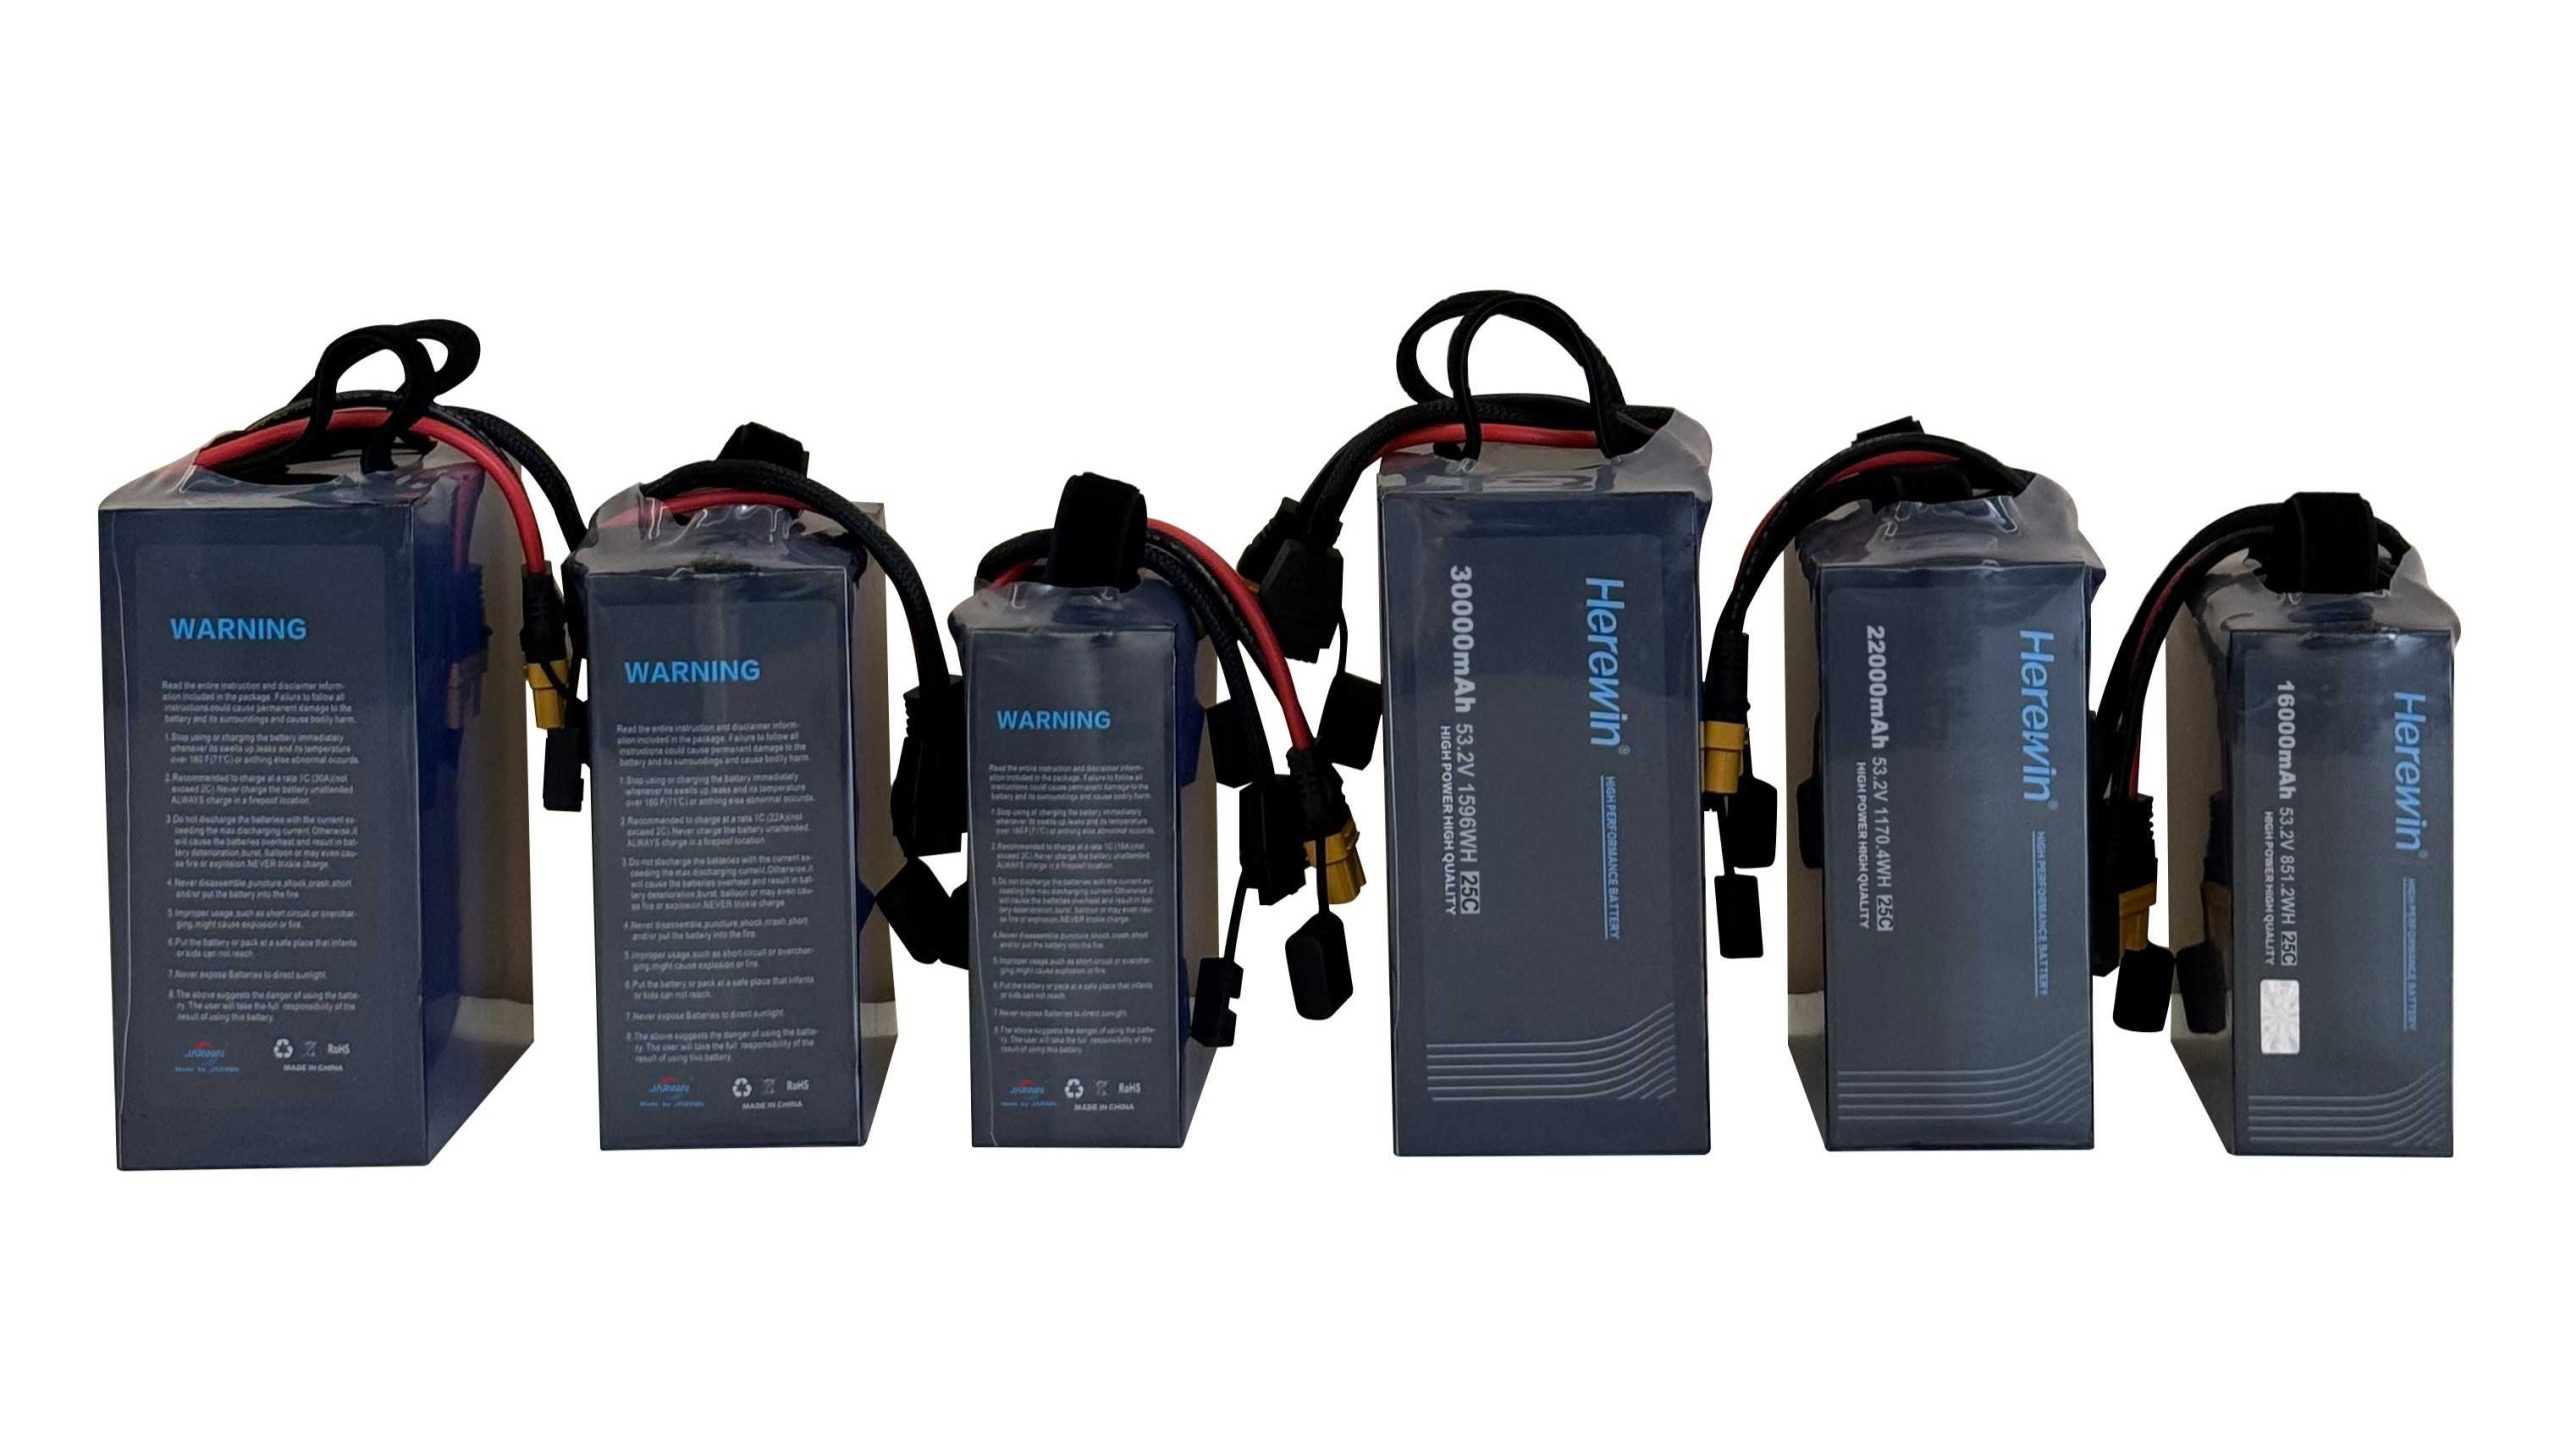
Design to the pack figure, not the cell figure. A semi-solid battery pack energy density number is the cell value reduced by everything the airframe must still carry: BMS board, busbars, connectors, enclosure, thermal path and mounting hardware. If a supplier quotes around 300–400 Wh/kg at cell level, that is a component figure; ask what the assembled pack weighs and divide by it. Optimising Wh/kg alone also breaks other things — a flight-ready semi-solid battery for drones still has to satisfy a continuous and burst discharge rate, thermal behaviour inside a sealed airframe with limited airflow, BMS current and cutoff limits, mechanical retention and connector design that survives vibration, and a certification set the operator or regulator will accept. Treat these as requirements to specify rather than details to discover during integration.
How to Evaluate a Semi-Solid Battery Supplier
Treat an unverified headline figure as a claim, not yet as a specification. Verification is where most semi-solid battery procurement decisions are won or lost, because the chemistry is new enough that few buyers have an internal benchmark to check a supplier against. Ask for the following in writing.
Cell and Pack Specifications
Require both figures, separately labelled. A cell-level number describes one component; a pack-level number describes the product you will install, after the BMS, busbars, enclosure, cooling and connectors have taken their share of the mass. Ask the supplier to break out that pack mass budget line by line. A supplier who can only quote the cell figure has not published the number your airframe or vehicle actually cares about.
Test Conditions
Every performance figure needs its conditions attached: test method, ambient temperature, state of charge, sample size, whether the measurement was taken on a cell or a pack, and the failure criterion used. Put those six fields in the RFQ directly. A cycle-life claim without a temperature and a depth-of-discharge is not a specification, it is a range.
Safety Evidence
Ask for the abuse-test reports behind any safety claim: the test method, the state of charge, the temperature, whether the unit was a cell or a pack, and the failure criteria applied. A safety claim without those five fields is a category label, not evidence.
Application Evidence
Ask for deployments with a method, a sample and a time window: what was built, how many units, how long in service, what was measured. Where a supplier cannot supply that record, treat the claim as an evaluation criterion rather than a verified figure, and price the uncertainty into your qualification plan.
Integration evidence matters as much as cell evidence. A semi-solid cell will not have the same charge and discharge curve, internal resistance behaviour or voltage profile as the conventional lithium-ion cell it replaces. A battery-management system tuned for the old chemistry may therefore need reconfiguration or replacement. Ask what changes are required to the BMS, the charge profile and the thermal design. Ask for a reference integration rather than a standalone cell report. A cell that tests well in isolation can still fail in an airframe or vehicle whose management system was never matched to it.
Supplier Verification Checklist
Where available, ask for the test date, cell model, sample size and stated test conditions alongside the headline figure. Use this table as the RFQ structure:
|
Supplier claim |
What to request in writing |
|---|---|
|
“300+ Wh/kg” |
Cell model, measured mass, test method, and whether the figure is cell or pack |
|
“3,000 cycles” |
Depth of discharge, charge/discharge C-rate, ambient temperature, end-of-life threshold |
|
“Safer” |
Abuse test report with method, SOC, temperature and failure criteria |
|
“−20 °C operation” |
Charge and discharge curves at the stated temperature and C-rate |
|
“2C fast charge” |
SOC window, ambient temperature and measured temperature rise |
|
“Pack energy density” |
Complete pack mass, configuration and included components |
|
“UAV flight time” |
Aircraft mass, payload, battery spec and the power profile used |
To see how the checklist works in practice, run it against a single example. Take a semi-solid cell quoted at around 300–400 Wh/kg at cell level: the checklist turns that figure into four questions — which cell model, measured at what mass, by what test method, and is it a cell or a pack number? Answering them keeps the claim at component level instead of letting it stand in for finished-pack performance. The same discipline applies to any chemistry in a supplier’s portfolio: each one should be judged on its own cell format and test conditions rather than borrowed as a generic benchmark for semi-solid.
FAQ
Are semi-solid batteries better than lithium-ion batteries?
Not as a category. Which one fits depends on which constraint binds first: semi-solid enters the comparison where weight is the binding constraint, while conventional lithium-ion remains relevant where the project’s cost, cycle-life and power requirements are better served by an established chemistry and cell format. Compare both against your own weight, utilization and duty-cycle profile.
Do semi-solid batteries have higher energy density?
At cell level, some vendor-reported semi-solid cells are quoted at around 300–400 Wh/kg. That figure should be compared with the specific chemistry and cell format being replaced, and then validated at pack level — BMS, busbars, enclosure, cooling and connectors add mass the cell number excludes.
Are semi-solid batteries safer, and how long do they last?
Neither is a property of the label. Safety is a test-condition question: compare abuse response under a defined test, at a stated SOC and temperature, on a cell or a full pack, against a stated failure criterion. Cycle life is a function of depth of discharge, C-rate, temperature and end-of-life threshold. Request both datasets together with those conditions, and read each against the chemistry it belongs to.
Are semi-solid batteries better than LiFePO4?
Semi-solid can offer lower pack mass at a higher upfront cost, while LFP can offer a mature cost and cycle-life profile where weight is less restrictive. The relevant comparison depends on the chemistry, pack design and duty cycle being evaluated.
Are semi-solid batteries suitable for drones?
Semi-solid is particularly relevant to UAV evaluations where pack mass is a hard constraint, because that is where pack-level energy density matters most. The actual comparison should include continuous and burst discharge rate, thermal behaviour under load, cycle life at your duty cycle and certification coverage — evaluated against the mission profile, not the cell datasheet alone.




 English
  Español
  한국어
한국어  Deutsch
  Français
  日本語
日本語  Русский
  Bahasa Indonesia
  ไทย
ไทย  العربية
  Português do Brasil
  Italiano
  Nederlands