
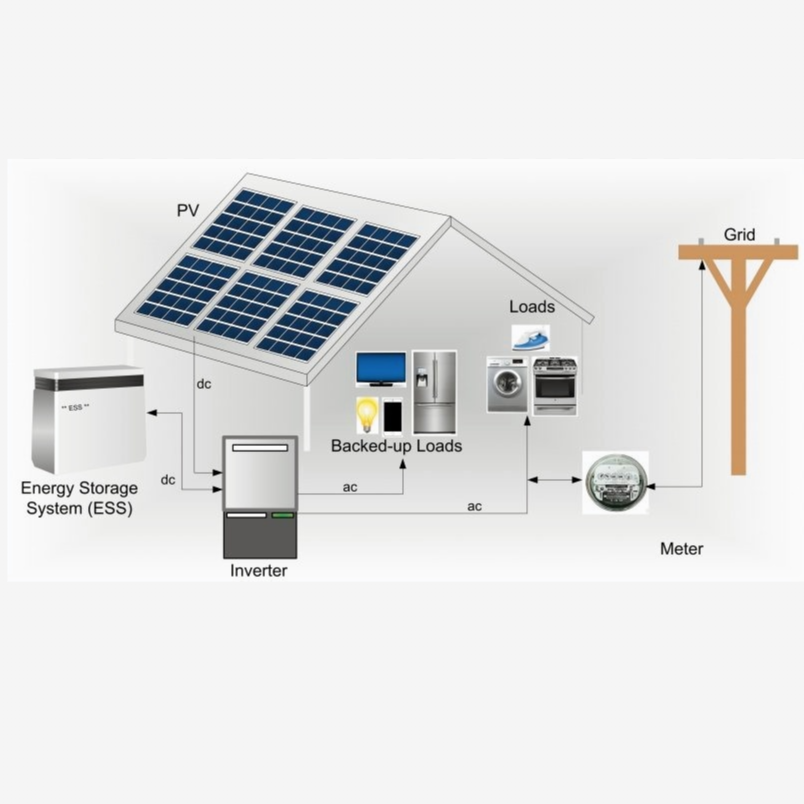


Commercial drone programs seldom fail because of airframes alone; charging infrastructure and operational practices are frequently the limiting factors. Mis‑specified chargers and informal SOPs can constrain sortie throughput, accelerate pack degradation, and increase safety and compliance exposure. For operators in agriculture, surveying/mapping, and powerline inspection, batteries are capital assets rather than disposable consumables. Selecting an appropriate charger architecture and codifying a charging strategy measurably improves fleet availability and protects total cost of ownership (TCO).
This white paper reframes consumer‑oriented guidance into a procurement and operations framework for fleet managers. It centers on three evidence‑based levers that affect operational outcomes:
- Voltage accuracy and per‑cell control for 12S/14S packs
- A C‑rate policy that balances turnaround time and cycle life
- Charger classes in the 1.5–3 kW range with active PFC to support efficiency and grid compatibility
The recommendations that follow are grounded in standards, operating mechanisms, and auditable SOPs.
The core parameters that move uptime and TCO
Before discussing models and specs, align on what truly matters for industrial fleets: voltage accuracy for 12S/14S lithium packs, current/C‑rate policy, and charger power with active power factor correction (PFC).
Voltage accuracy for 12S/14S packs—why a few millivolts matter
For high‑energy UAV packs, small per‑cell overvoltage near full state of charge increases lithium plating risk. Plating reduces capacity and can form dendrites that compromise safety. In series strings (12S/14S), pack‑level regulation errors and cell imbalance can push the “highest” cell over safe limits before neighbors are full.
- Mechanism evidence: Overcharge tests show that slight overvoltage can cause anode damage, copper dissolution, and lithium plating; in series 12S/14S packs, cell‑to‑cell variance allows a single weak cell to reach dangerous overvoltage before its neighbors—see Ouyang et al. (2018) overcharge abuse of Li‑ion cells for mechanisms and failure pathways.
- Practical implication: Specify chargers that tightly regulate pack voltage following the cell chemistry’s recommended CC/CV profile and that integrate with a BMS capable of active cell balancing and over‑voltage protection. Avoid parallel “Y‑cable” charging that masks imbalance and circumvents per‑bay telemetry.
A precision mind‑set matters, think of a 12S pack as 12 separate constraints tied together—if one cell quietly hits the ceiling, the whole asset pays for it.
Current and C‑rate policy—balancing throughput with life
Charge rate is a policy lever tied to operations tempo. Higher C‑rates shorten turnaround but raise cell temperature and overpotential, which accelerates side reactions (e.g., SEI growth) and can increase plating risk near full SOC. Moderate rates reduce stress but slow rotation.
- Directional evidence and mechanisms: While precise fleet‑grade cycle‑life deltas by C‑rate vary by chemistry and design, higher C‑rates increase thermal and electrochemical stress; moderate rates (≈≤0.5C for maintenance) are gentler on life. For mechanism‑level context on internal resistance and thermal effects, see Keysight’s primer on Li‑ion impedance: “A deeper look at lithium‑ion cell internal resistance measurements” (Keysight, 2022).
- Policy recommendation: Codify two lanes—(1) Maintenance charging at approximately ≤0.5C when schedule permits to reduce cumulative stress. (2) Peak‑throughput charging at a higher, manufacturer‑approved C‑rate during surges (e.g., harvest season), with strict thermal limits and cooldown windows.
Ask yourself, is the extra 15–25 minutes saved on turnaround worth the incremental thermal load during a heat wave? Set the rule now, not after a field failure forces it.
Power and active PFC—1.5–3 kW class for fleets
Fleet charging rarely scales on hobby‑grade bricks. For shop infrastructure, 1.5–3 kW chargers with active PFC achieve better grid compatibility and efficiency than non‑PFC supplies. Active PFC pushes power factor (PF) toward unity and lowers input current harmonic distortion, reducing upstream heating and keeping facilities friendlier to generators and sensitive circuits.
- Engineering baseline: High‑efficiency architecture — Instead of component‑level deep dives, focus on operational metrics. Industrial‑grade topologies with active PFC typically deliver power factors ≥0.95 and conversion efficiencies exceeding 90%. For a fleet operator, this efficiency delta isn’t just academic — it meaningfully lowers thermal load on facility HVAC systems and improves stability when drawing high amperage from portable field generators.
- Procurement takeaway: Mandate active PFC in your RFPs. Treat PF ≥0.95 and efficiency >90% as the non‑negotiable floor for any 1.5–3 kW class charger to ensure grid quality and reduced operating costs.
Scenario‑based industrial drone charger selection playbook
Different missions stress the charging stack in different ways. The right architecture depends on sortie density, environment, and power availability.
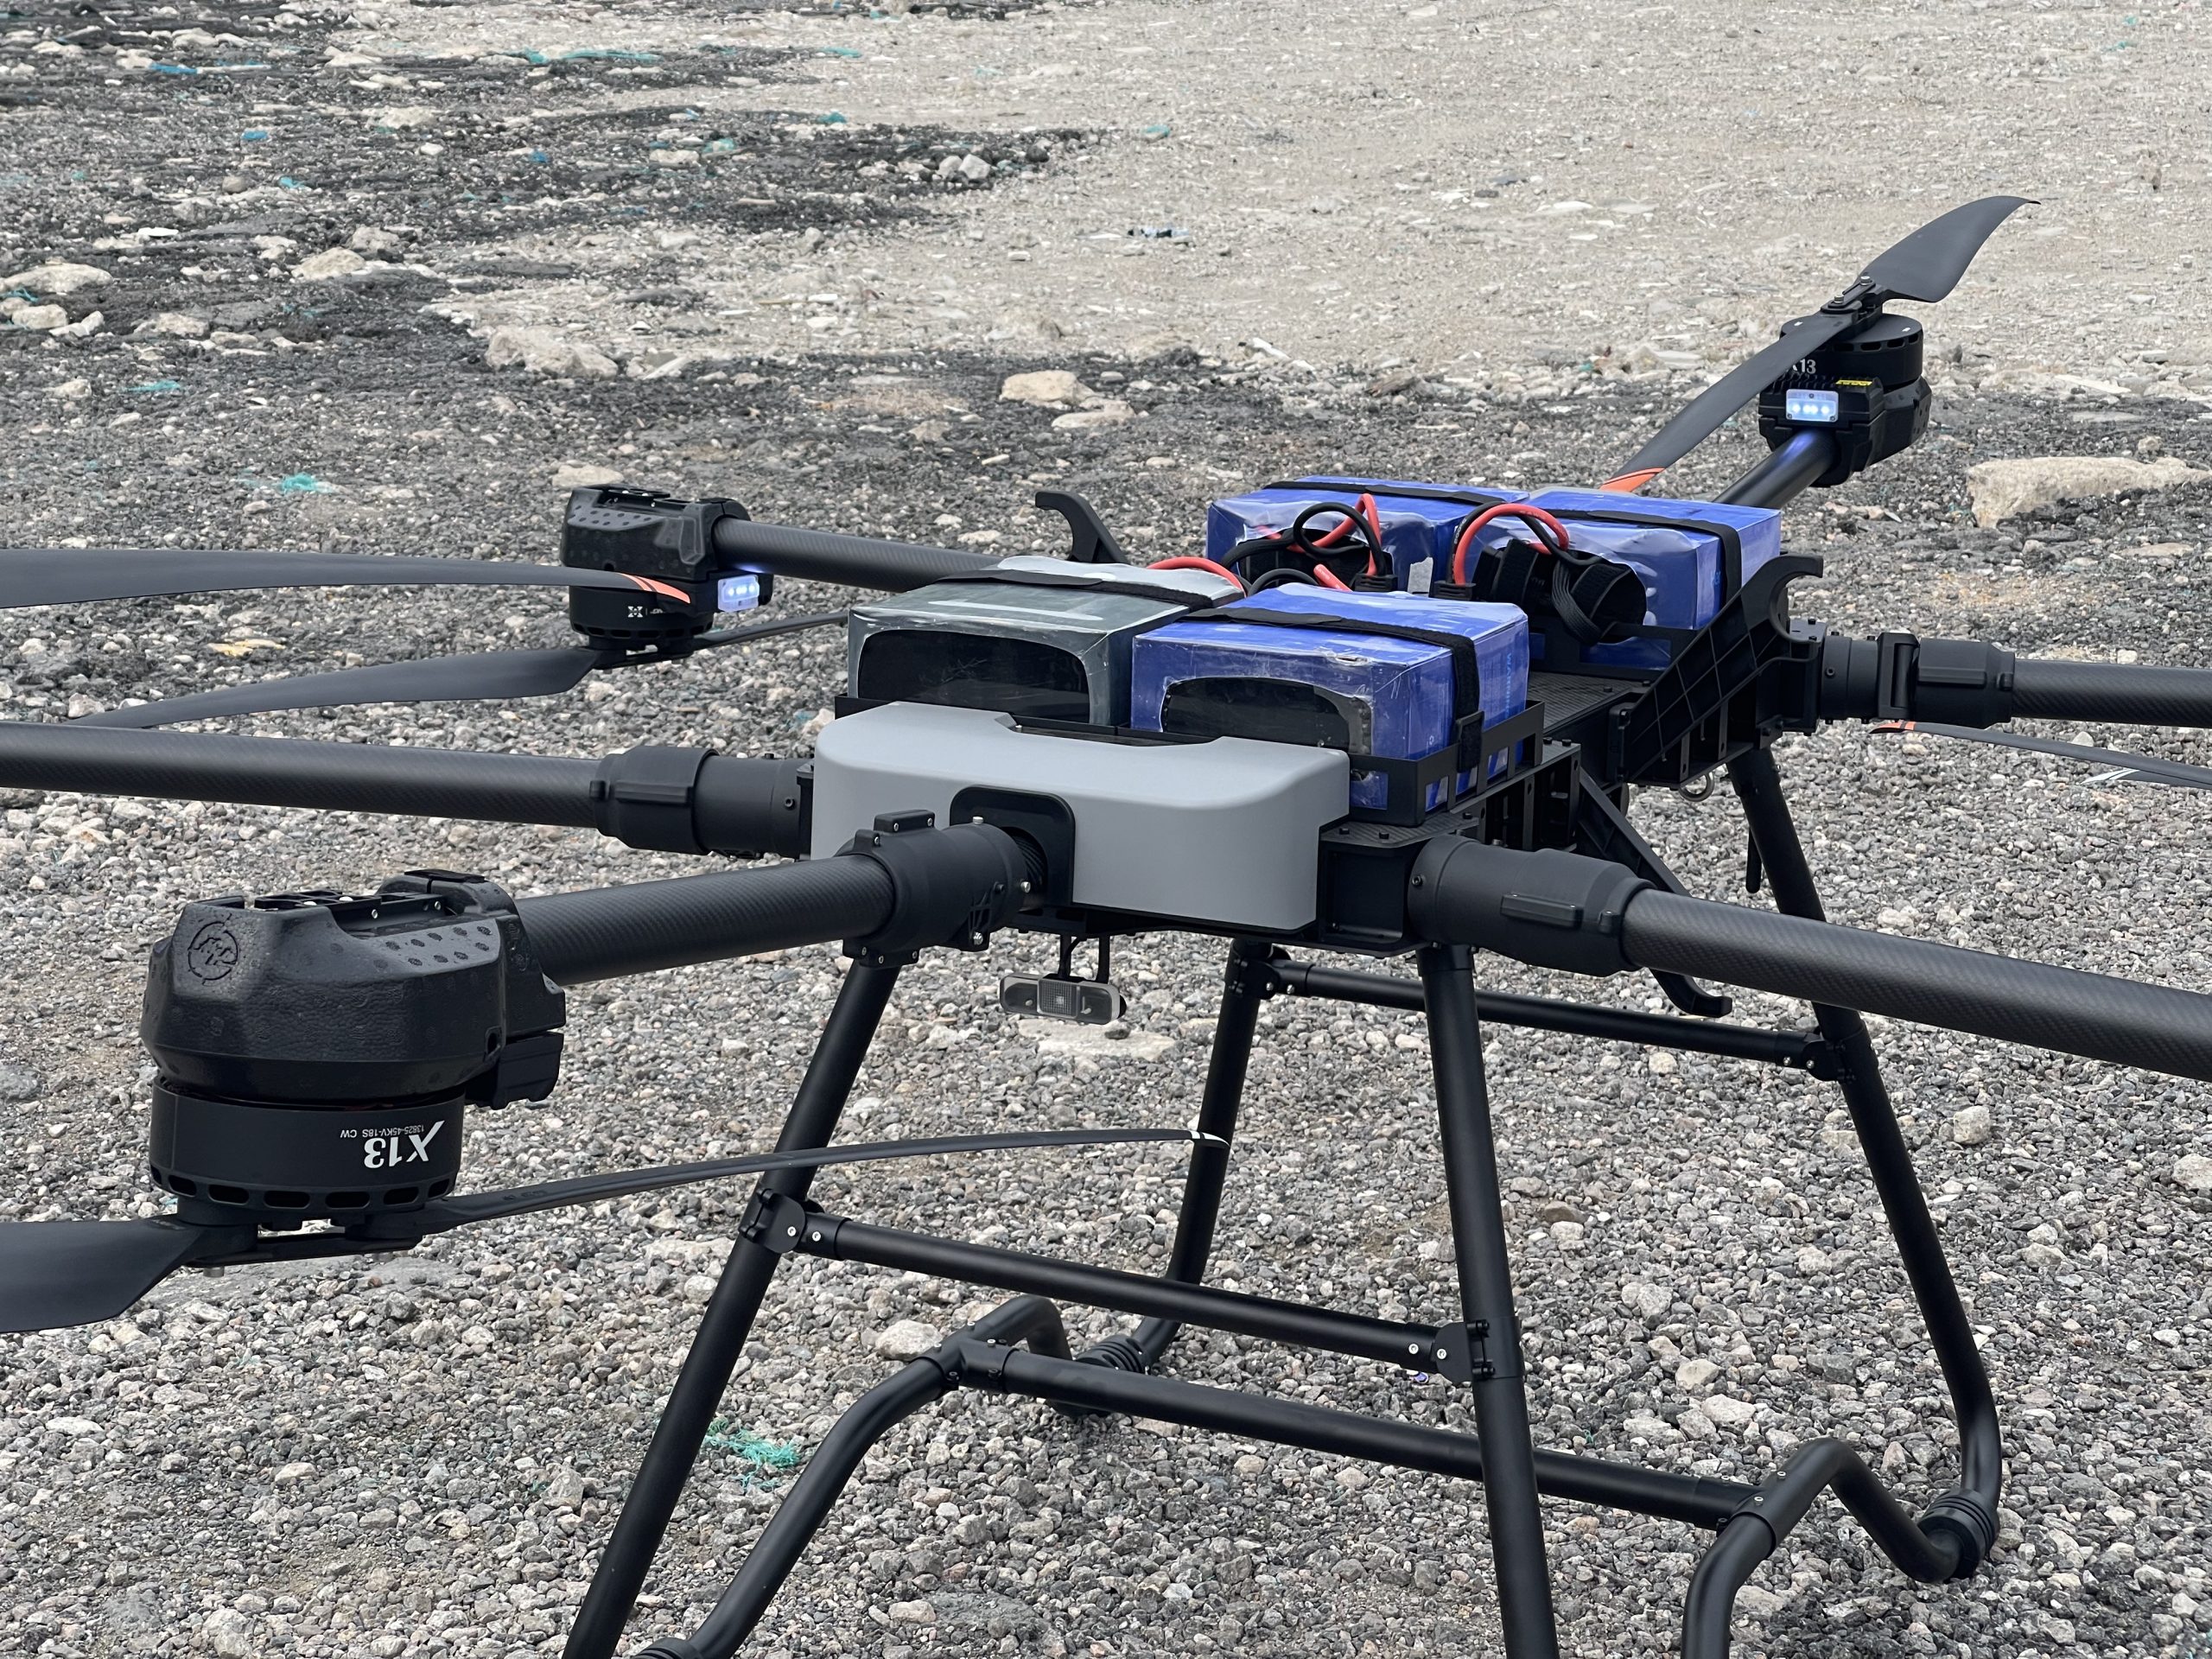
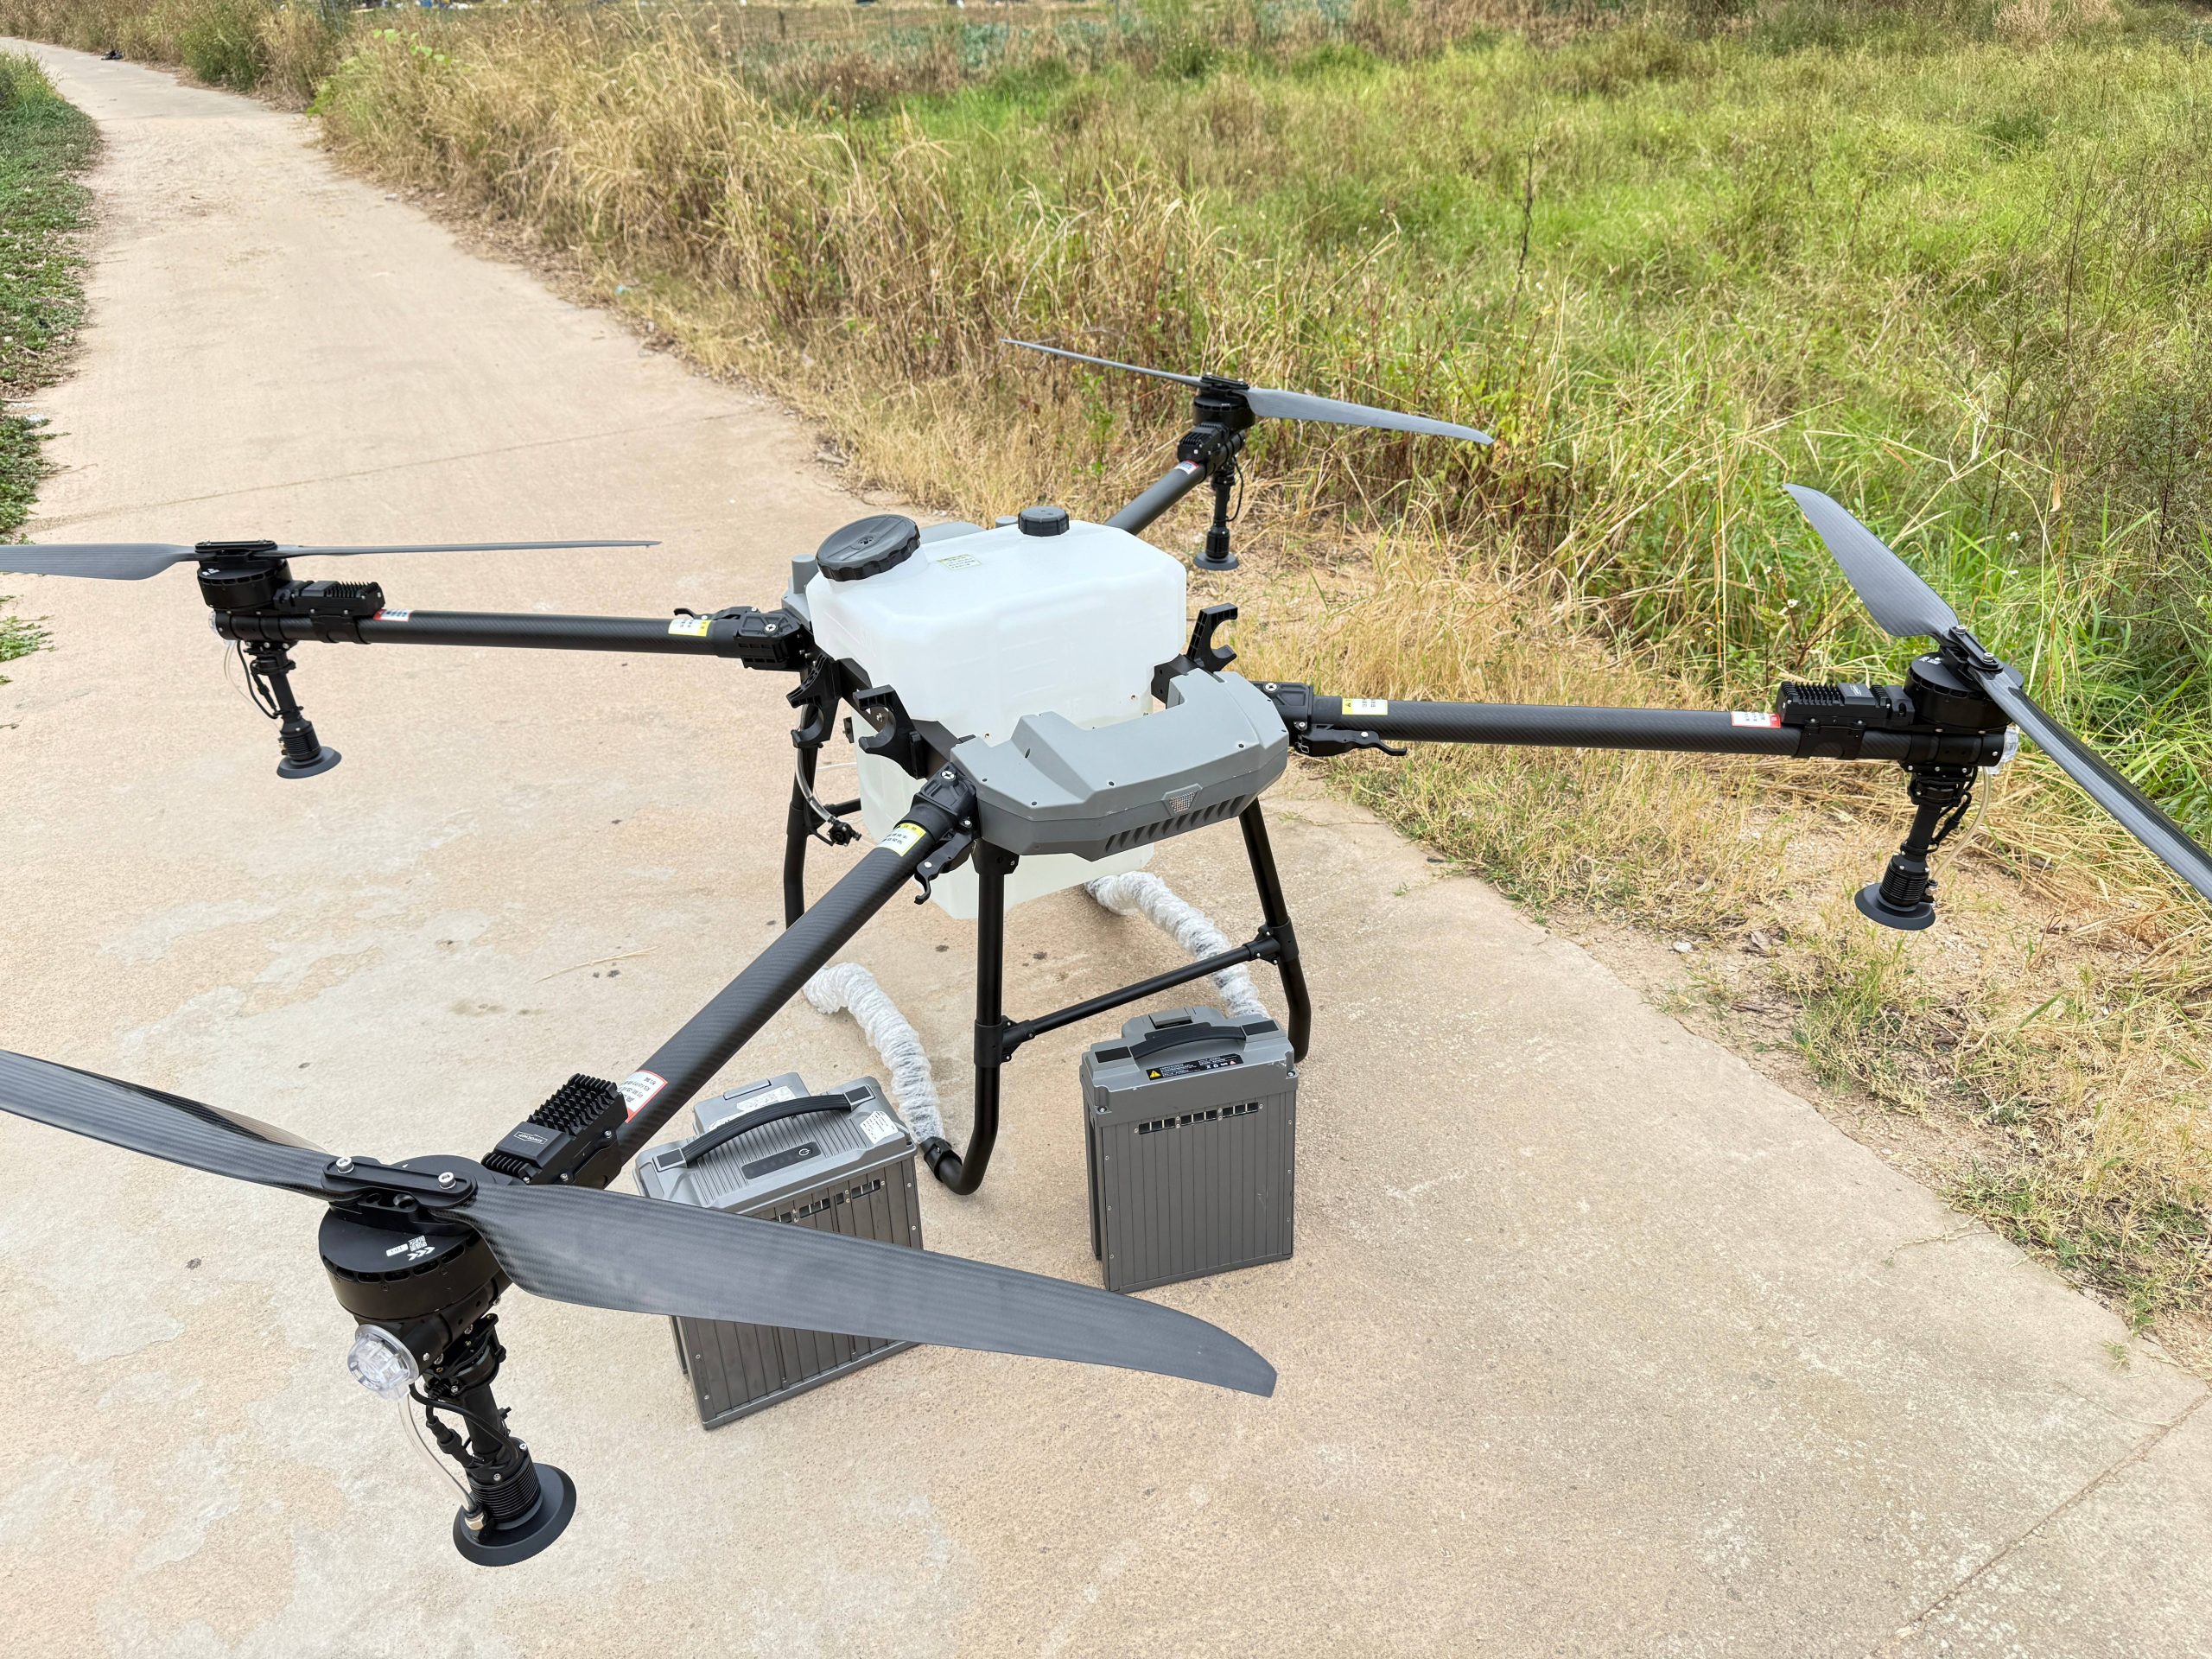
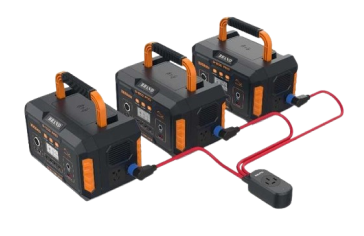
Large‑scale agriculture and security operations—independent multi‑channel infrastructure
High‑tempo programs often run many batteries in rotation with a small crew. The priorities are independent bays, clear telemetry, and minimal babysitting.
- Specify multi‑channel chargers with truly independent outputs per bay (not passive parallelization). Require per‑bay temperature sensing, CC/CV control matched to 12S/14S chemistries, and error code visibility so one weak pack doesn’t stall the line.
- Aim for 1.5–3 kW per unit with active PFC on shop power; size the stack by target turnaround time at your policy C‑rate (e.g., how many packs must move from 20%→90% per hour?).
- Operational pattern: designate a “charger steward” role responsible for rotation timing, error resolution, and documentation—one person can manage many bays if the charger exposes the right signals.
Illustrative examples:
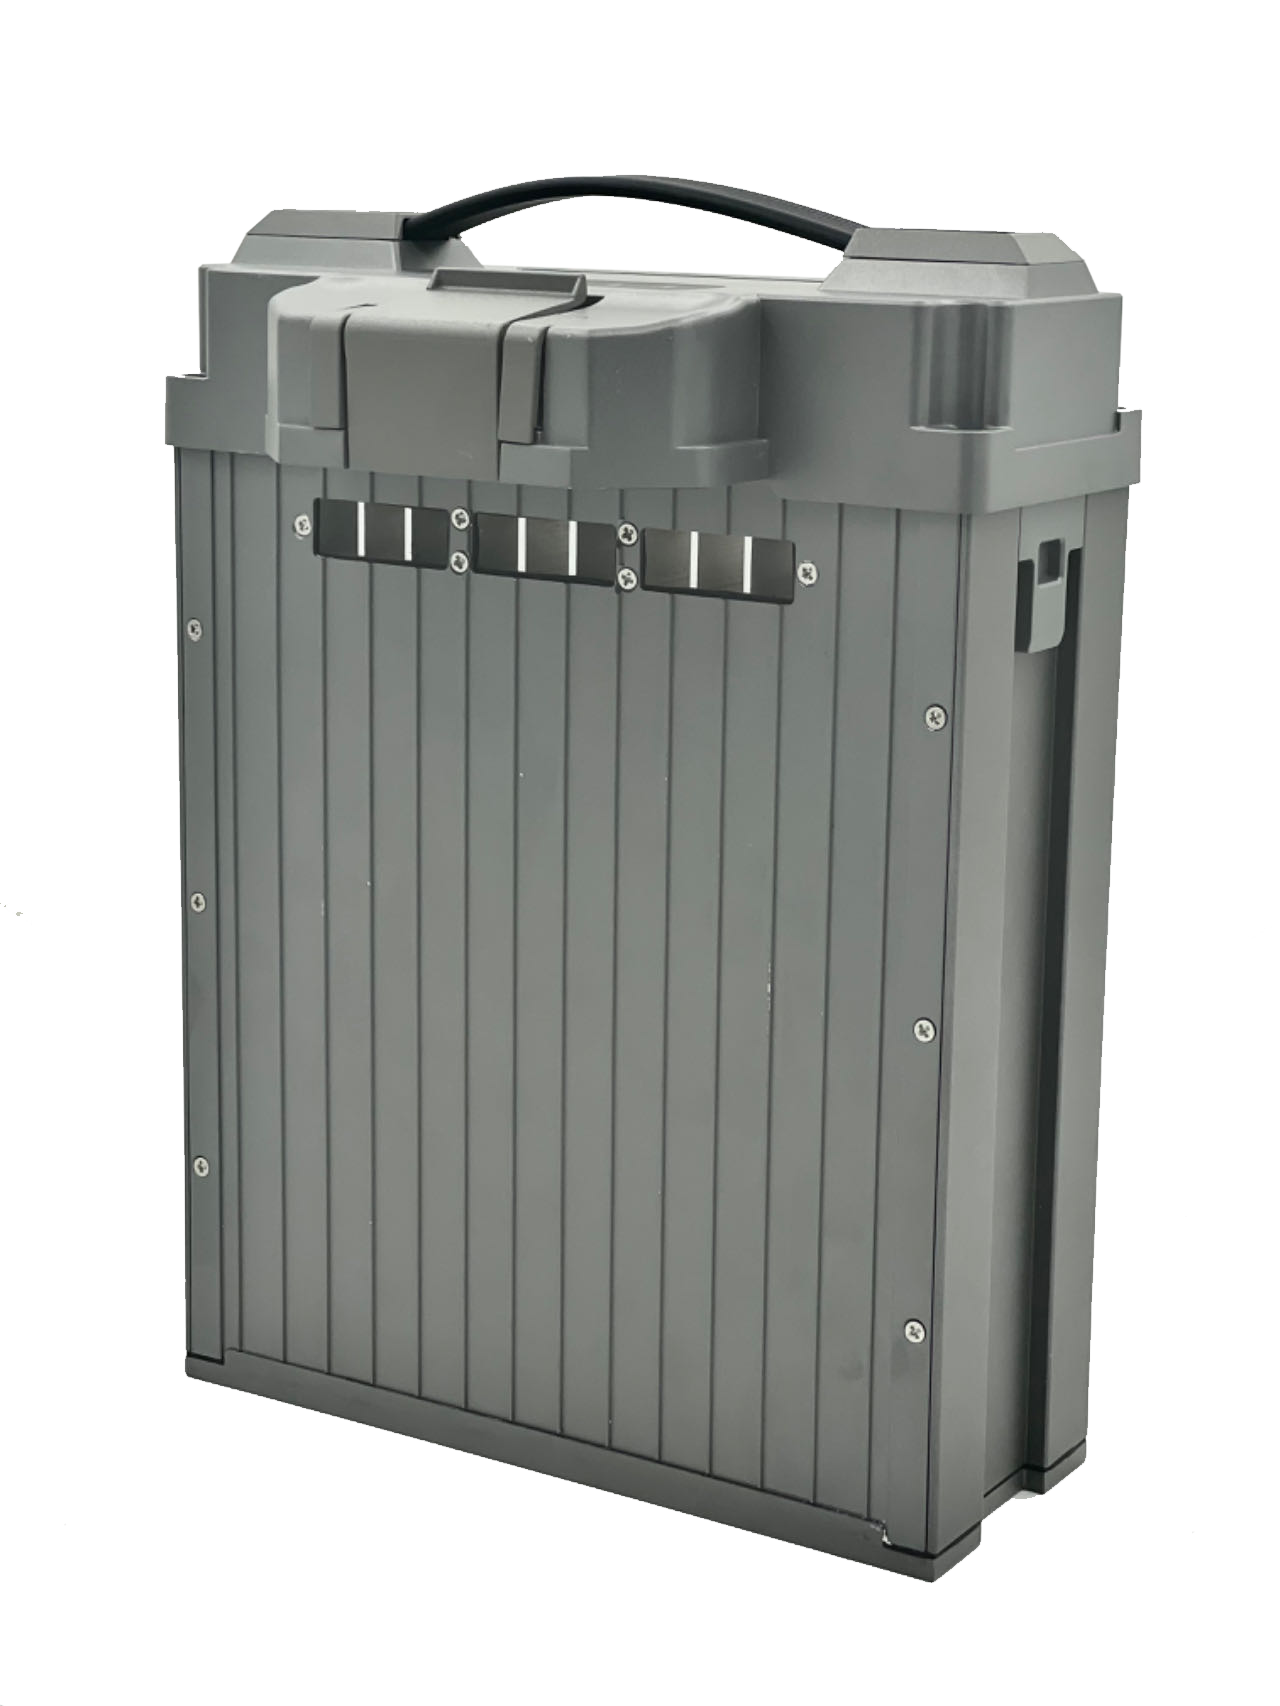
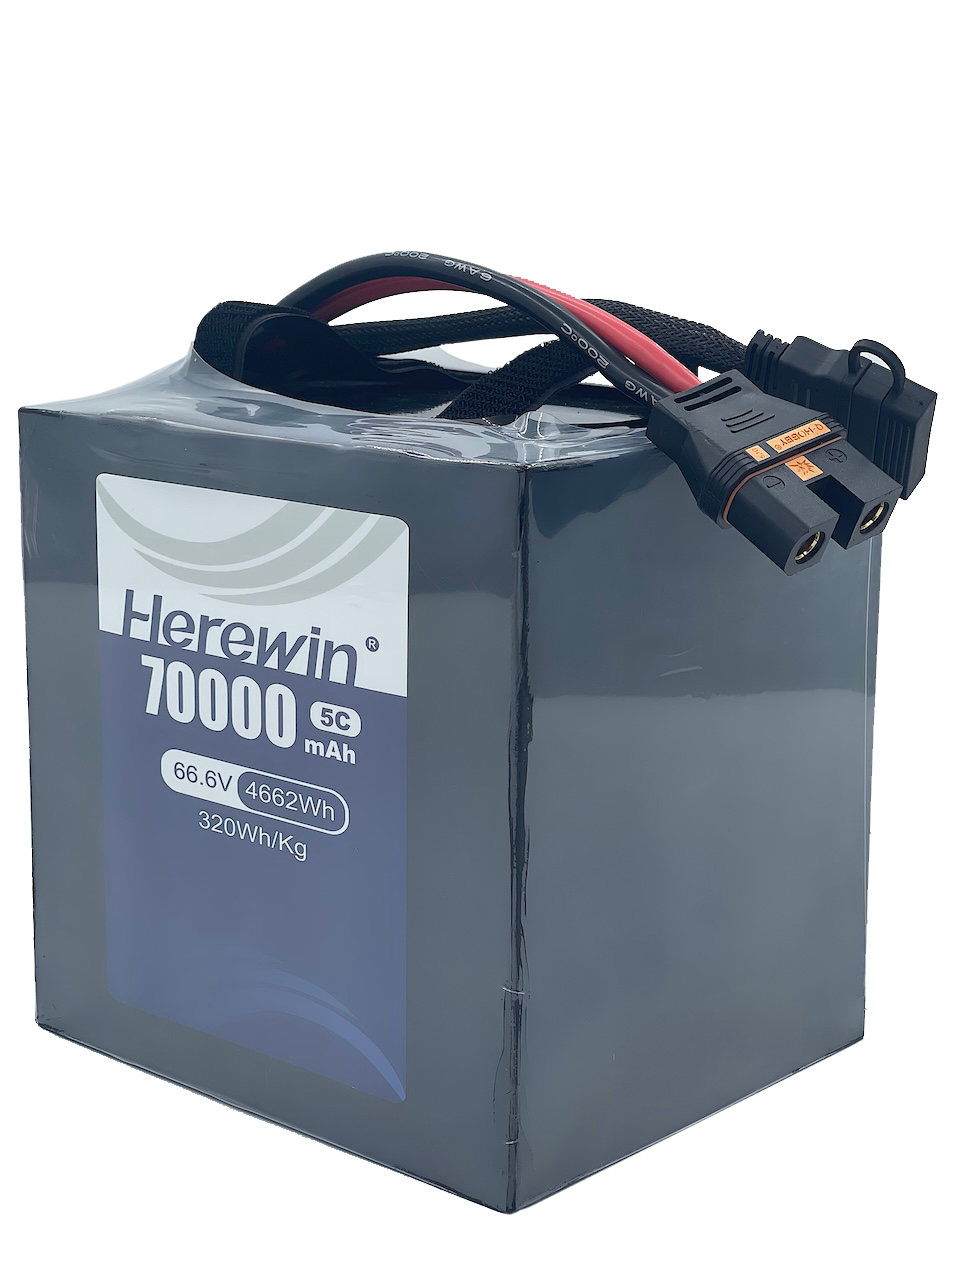
- PC3020 series — supports dual independent outputs and lists a single‑channel maximum current of 45 A, making it suitable where independent, high‑current bays are required for rapid turnover without parallel hacks.
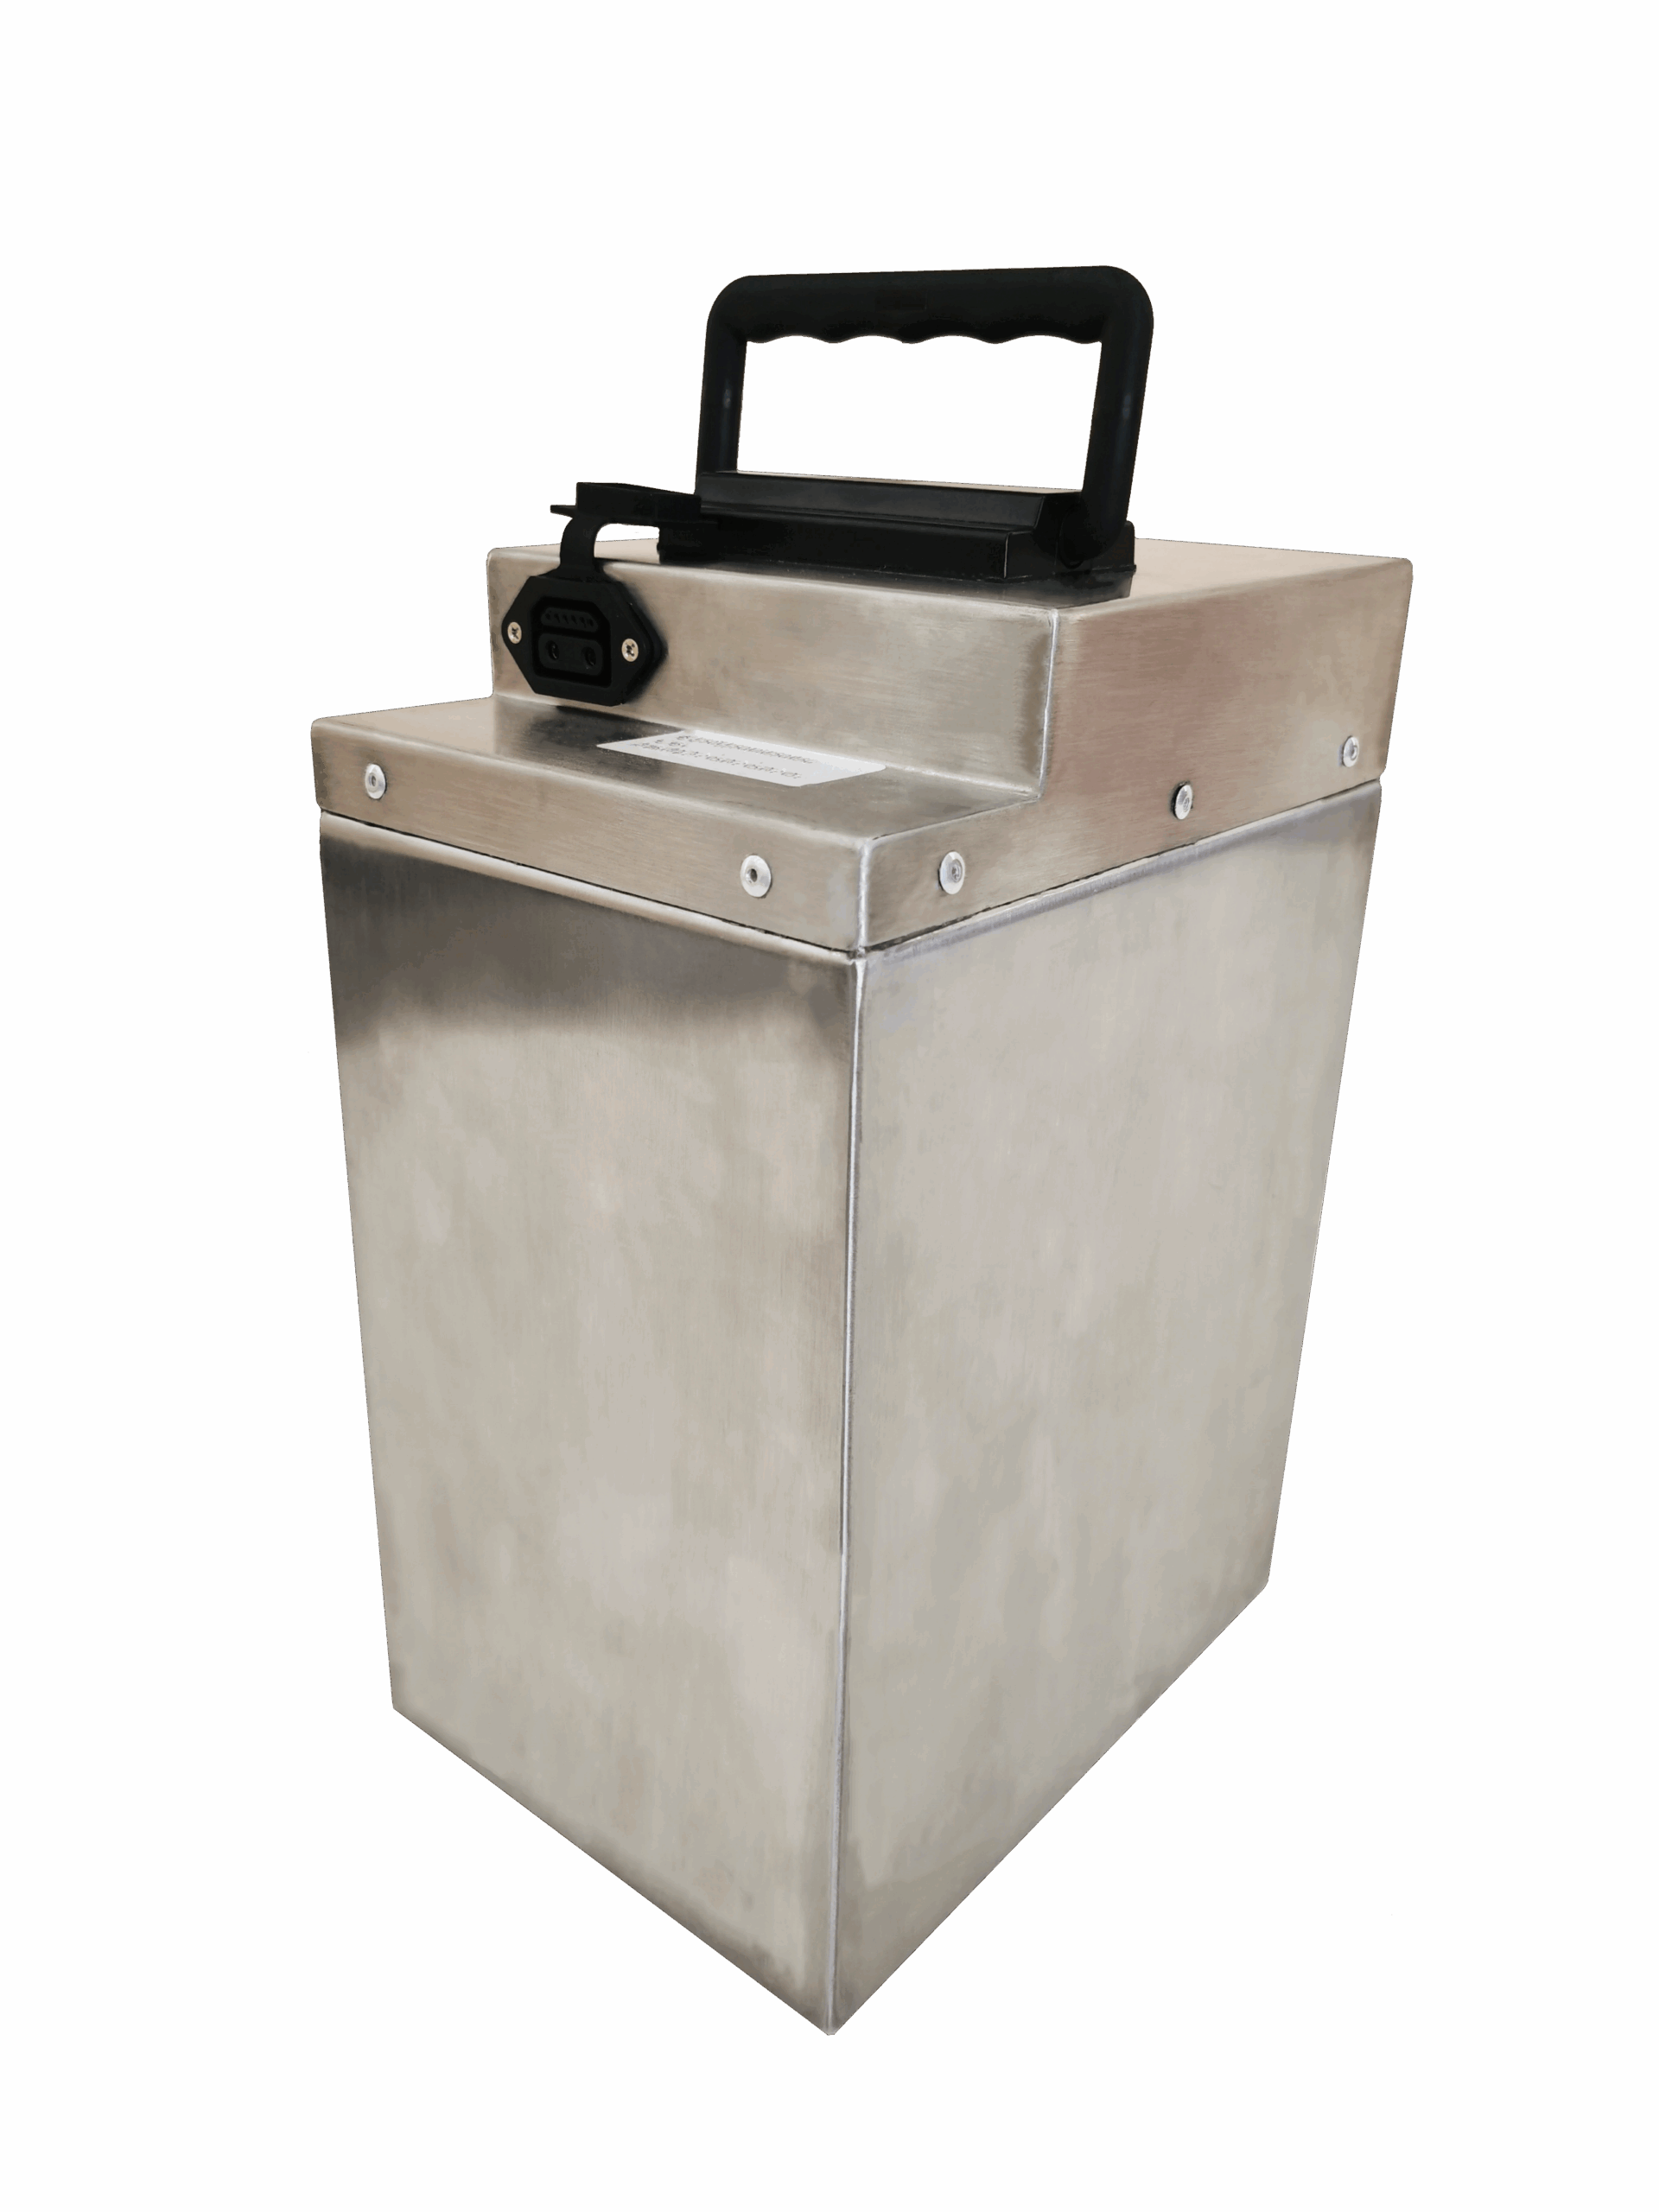
- 6055P — documented as a 3000 W class unit with a dual‑lane rotating‑charge design, suitable for shop environments where high aggregate throughput and per‑lane sequencing simplify single‑operator workflows.
For a deeper feature checklist of industrial chargers, see the context article on selection criteria: top features to look for in a drone battery charger.
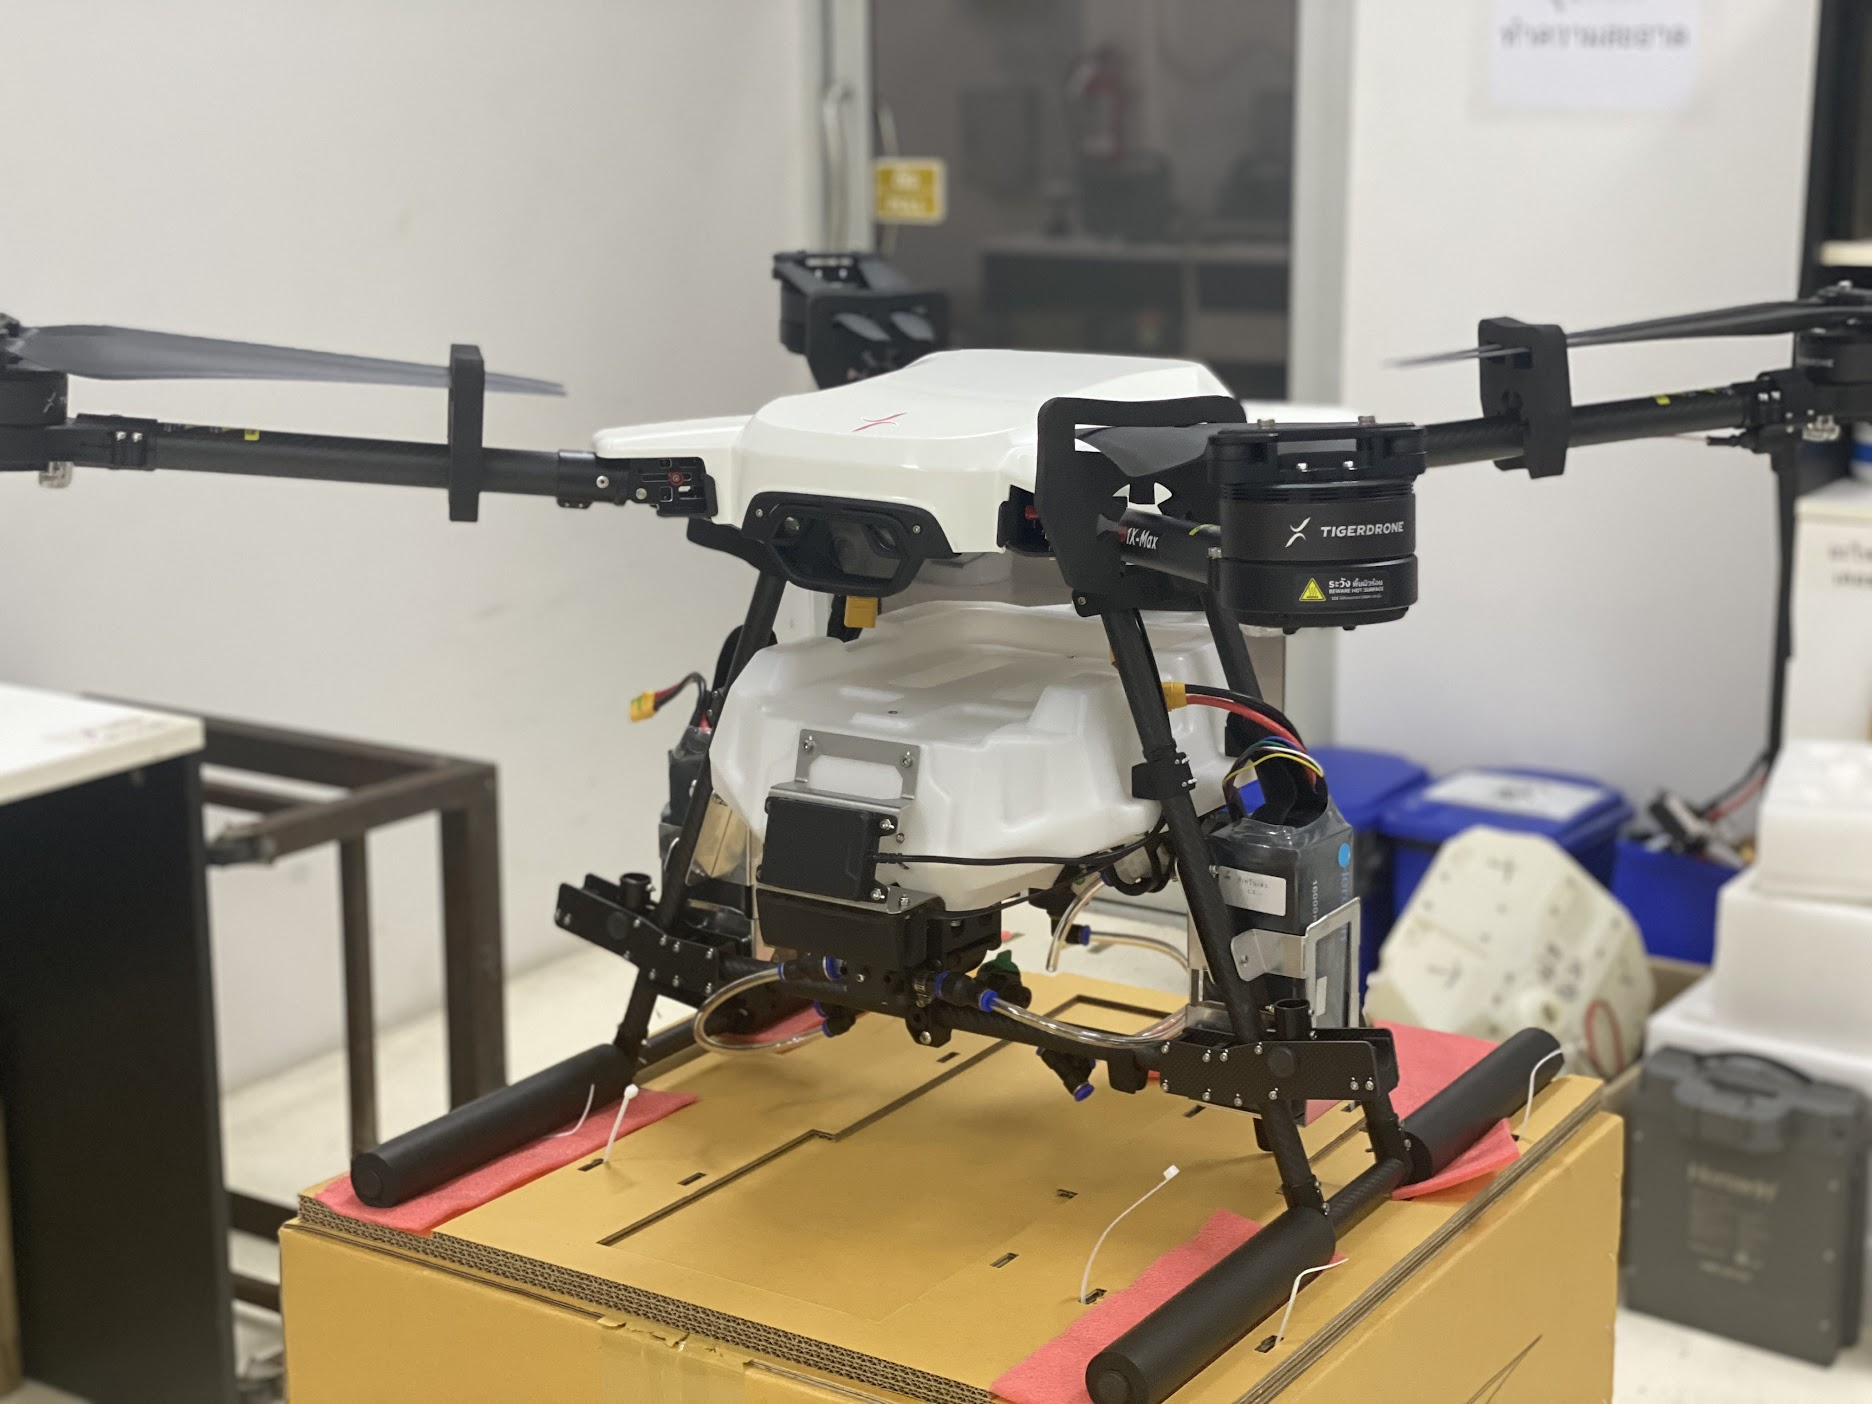
Field surveying and powerline inspection—rugged, portable, and generator‑friendly
Field teams may operate far from stable AC mains. Portability, ingress protection, and wide‑temperature operation matter as much as watts.
- Choose IP65‑grade enclosures or, at minimum, conformal‑coated electronics with filtered air inlets to resist dust, spray, and agrochemicals. Validate operating windows (e.g., –20°C to 50°C) and derating curves.
- Ensure compatibility with generators or vehicle DC input, including surge tolerance and grounding schemes. Active PFC helps generators run cleaner by improving input current shape and lowering apparent power.
- Provide a compact SOP for cold‑weather charging (e.g., pre‑warm packs to manufacturer minimum) and hot‑weather cooldown cycles between sorties to keep cumulative temperature within limits.
For extended reading on maintenance practices tailored to industrial drones, see the practical guide on storage and handling policies: industrial drone lithium battery maintenance guide.
Risk control and compliance checklist
Charging infrastructure touches safety, facilities power quality, and transport law. Procurement should insist on verifiable certificates and documented protections.
Smart protections and telemetry
- Per‑bay temperature sensing and thermal limits; documented error codes (e.g., communication loss, over‑temp, sensor fault) with clear SOPs.
- Integration with BMS signals where available (pack ID, cycle count, voltage deltas). Avoid mixed‑age packs on the same mission cycle.
- Example operational alarm codes (documented in the supplier technical file) to use as diagnostic triggers and SOP inputs:
- ERR1 — Input voltage anomaly: Stop charge, verify input source stability (e.g., generator fluctuation), and restart per SOP.
- ERR2 — Communications interruption: Quarantine the bay, check telemetry cabling and BMS link, and perform manual voltage/temperature inspection before reuse.
- ERR3 — Module fault: Often triggered by hardware failure or protocol mismatch from non-dedicated chargers. Tag the unit for repair and do not attempt to force-restart.
- ERR4 — High‑temperature threshold: (Documented at ≥45°C): Cease charging immediately, allow controlled cooldown, and inspect for cooling failures or pack thermal events.
Certifications and standards to verify
Charging infrastructure affects safety, power quality, and transport law. Require verifiable certificates and brief vendor proof as follows:
- UL 3030 — UL Standards (UL) — Mandatory for the charger/system when it falls under UAS electrical scope. Provide certificate PDF, certificate number, issue date, and test lab contact.
- IEC 62133‑2 — IEC Webstore (IEC) — Must for portable packs. Provide test report ID, sample SKUs, and lab accreditation.
- IEC 62619 — IEC Webstore (IEC) — Strongly recommended for industrial/large‑format packs; provide report excerpts when applicable.
- UN 38.3 — UNECE (Section 38.3) (UN) — Must for transport. Provide T1–T8 test summary, Covered Model IDs/SKUs, and test house accreditation.
- CE marking guidance — European Commission — Required for EU; provide Declaration of Conformity and EMC/LVD reports.
- DOE / 10 CFR Part 430 — eCFR — Required for U.S. energy‑use claims; provide test reports and method reference.
Quick vendor checklist (attach with bid): Certificate/report name | Issuer | ID | Issue date | Covered SKUs | Lab accreditation | Contact.
Keep a single, versioned repository for certificates and SOPs; add local‑regulation checks for cross‑border deployments (e.g., GB or PSE where relevant).
Maintenance SOPs that protect battery assets
Cycle life isn’t just about what happens on the pad; it’s largely decided in storage and handling. Two policies pay off immediately: storage state of charge (SOC) control and temperature management.
- Storage SOC: Store packs at roughly 40–60% SOC (~3.8–3.9 V/cell) in cool, dry conditions; this mid‑SOC window reduces calendar‑aging mechanisms compared with long‑term storage at high SOC and elevated temperature. For published context, see the LFP SOC‑aging analysis in Kang et al., Batteries (2024) and a concise industry primer in Battery University BU‑808.
- Temperature windows for charging: Respect manufacturer limits; avoid sub‑freezing charging and high‑temperature top‑offs. Plan cooldown periods between sorties to keep cumulative pack temperature in check before re‑charge.
- Compatibility discipline: Do not mix non‑approved chargers, cables, or connectors; contact resistance and mis‑wired pinouts are common causes of thermal hotspots and faults.
Procurement and TCO modeling
Procurement needs a clear, auditable checklist and a first‑pass financial model to compare charger stacks.
Procurement Checklist
- Electrical and Control — Accurate CC/CV profiles for 12S/14S chemistries; per‑bay independence and thermal sensing; BMS telemetry compatibility.
- Power Quality — Active PFC with model‑specific power factor (PF ≥ 0.95) and measured efficiency (>90%); require manufacturer datasheets or third‑party test reports for verification, plus surge protection and documented EMC/EMI compliance.
- Environmental and Mechanical — IP rating or conformal coating as the environment demands; validated operating temperature range and derating curves; strain‑relieved, replaceable cables and approved connectors.
- Safety and Compliance — Verifiable certificates and test summaries: UL 3030 (if the charger/system falls under UAS electrical scope), IEC 62133‑2 or IEC 62619 for packs, UN 38.3 test summary (T1–T8), and CE (EMC/LVD) declarations. Require certificate IDs, issue dates, covered SKUs, and test‑house accreditation on file.
- Support and Lifecycle — Error code documentation (ERR1 — Input voltage anomaly; ERR2 — Communications interruption; ERR3 — Module fault; ERR4 — High‑temperature threshold) with linked SOPs for each code; confirm spares availability, RMA policy, and turnaround SLAs in the contract.
Simplified Throughput Model
A compact way to sanity‑check stacks is to relate charger power, policy C‑rate, and turnaround targets. The following simplified table illustrates how assumptions drive scale. Replace numbers with your chemistry‑specific values and measured cycle times.
| Scenario | Pack Energy (Wh) | Target Charge Window (20%→90%) | Policy C‑rate | Time per Pack (est.) | Charger Power per Bay | Bays Needed for 12 packs/hr |
|---|---|---|---|---|---|---|
| Maintenance shop | 1000 | 70% of capacity | 0.5C | ~1.4 h | ~500–700 W | 18–20 |
| Peak season (shop) | 1000 | 70% of capacity | 1.0C | ~0.7 h | ~900–1400 W | 9–10 |
| Field team (generator) | 1000 | 60% of capacity | 0.7C | ~0.9 h | ~700–1000 W | 12–14 |
Table Notes: Times are illustrative approximations combining CC/CV behavior and overhead; verify with your specific packs and ambient temperatures. Always stay within battery OEM limits and monitor temperature.
Industry Benchmark for Validation
To verify these specifications in a real-world scenario, operators can review the Herewin Industrial Series (such as the PC3020 for independent 45A channels or the 6055P for 3000W shop power) as a baseline for 1.5–3 kW active PFC architecture.
Transparency Disclosure: This guide is authored by the Herewin engineering team. While we reference our own architecture to illustrate the performance criteria discussed, we encourage procurement teams to validate all vendor specifications against their specific TCO and safety requirements.
Next steps
- Align internally on policy C‑rates for maintenance vs. peak operations and encode cooldown windows.
- Specify charger requirements: 12S/14S accuracy, independent bays, per‑bay temperature and telemetry, active PFC with named PF/efficiency from datasheets, and required certifications (UL 3030 scope, IEC 62133‑2/62619, UN 38.3, CE).
- Pilot the stack: instrument a small subset of bays and measure real turnaround times, temperature profiles, and error code incidence before scaling.
- When you’re ready, discuss a fleet‑specific charger stack design or download a product datasheet. For deeper context on storage/SOPs, consult the maintenance guide linked above.
If you’d like a neutral, criteria‑driven configuration review for your fleet, reach out to your preferred vendor or contact Herewin’s engineering team via the site resources linked in this paper.