



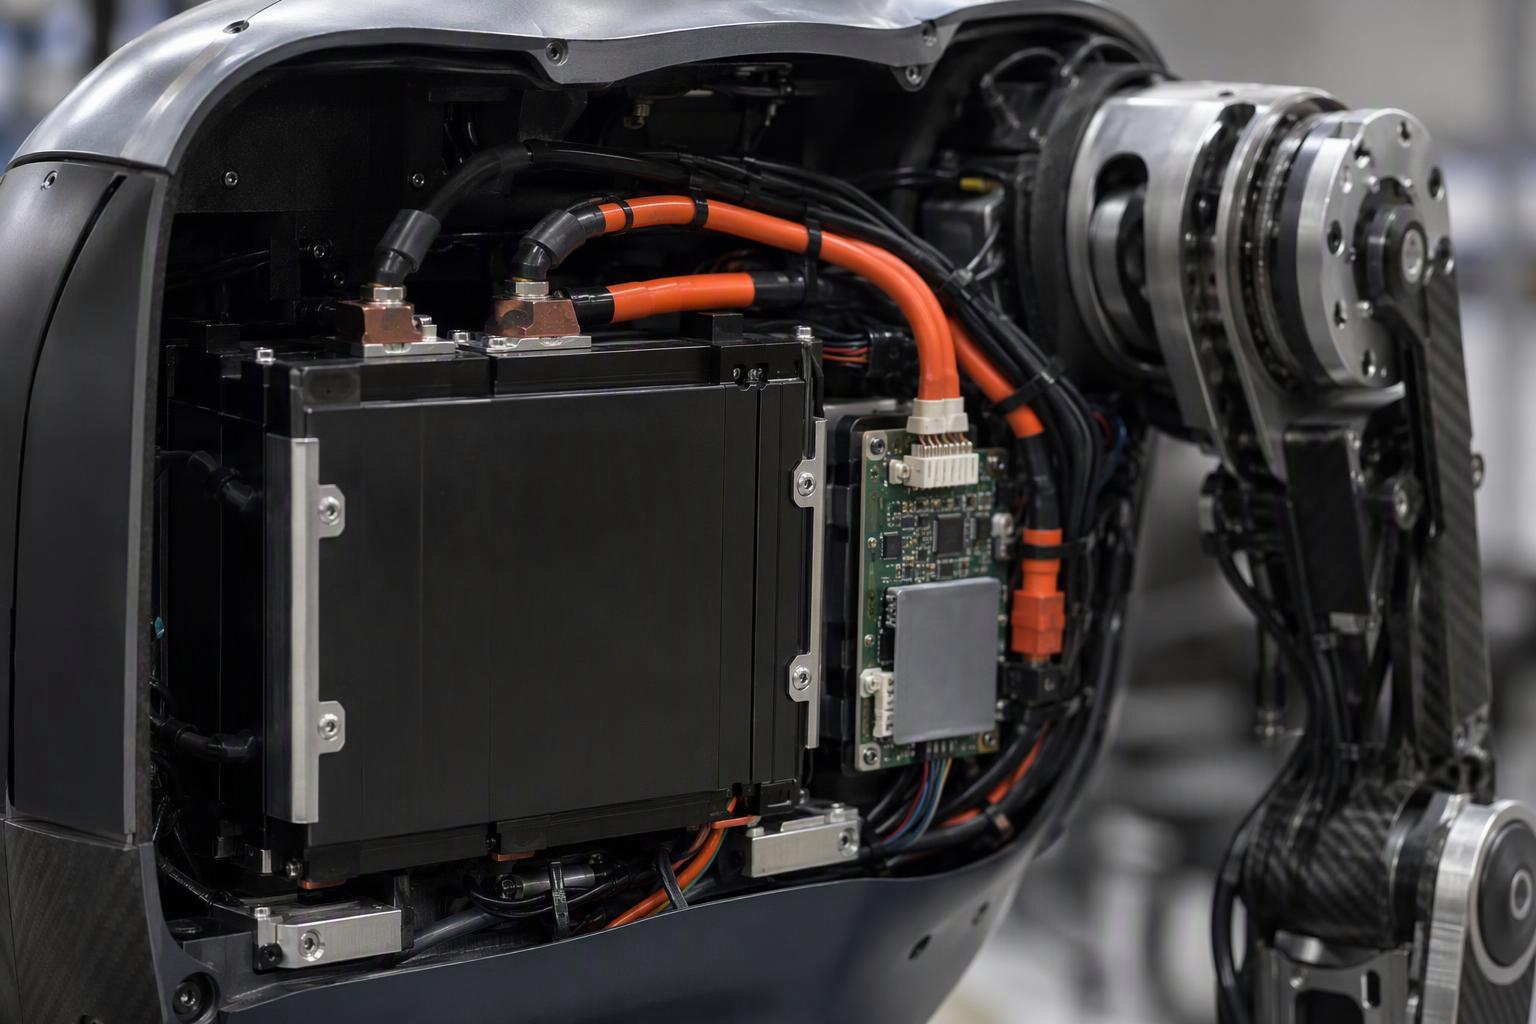
A high-energy cell can meet its datasheet specifications and still prove unsuitable for a humanoid robot. The issue may not be insufficient stored energy, but the pack’s ability to maintain bus voltage during short, high-current movements.
Consider a hypothetical case: a battery pack is sized to support three hours of average operation using a high-energy cell rated at 300 Wh/kg. During a loaded squat-to-stand movement, however, the current demand exceeds the pack’s transient capability, causing the DC bus voltage to fall below the drive’s undervoltage threshold. The robot stops even though substantial energy remains in the battery.
The example illustrates a common sizing problem: average energy consumption and short-duration power demand must be evaluated separately. Wh/kg alone cannot predict this behavior, because voltage sag depends on cell construction, discharge rate, temperature, state of charge and the resistance of the complete pack.
Humanoid robots combine continuous electrical loads with cyclic movement and brief high-power actions. Compute, sensors and control electronics draw power throughout operation; walking and posture control add changing loads; and movements such as standing up, jumping or recovering balance can produce much higher current peaks. A cell tested only at 0.5C provides limited evidence of how it will perform under these conditions.
Battery selection therefore needs to consider energy density, power capability, DCIR, peak current and pack mass together. Each of these factors, and the validation work an OEM needs to carry out on the assembled pack, is covered below.
Understand the Power Demands of Humanoid Robots
The measurements cited in this section come from Fraunhofer IPA’s whole-robot power measurement of a Unitree G1 EDU-4 with Dex3-1 hands and firmware 1.04. They are mean electrical power over each scenario, not instantaneous peaks, and the study publishes no peak-power figure for this platform.
Continuous Loads and Baseline Power Consumption
A humanoid robot consumes power before it moves. Compute, perception sensors, control electronics, communication and thermal management draw continuously. In many humanoid platforms, the hip and knee actuators must also continuously produce holding torque to maintain a standing posture, particularly where the joint design does not provide mechanical self-locking or a brake that can carry the load. Platforms that use different transmissions, brakes or mechanical holding arrangements will show a different standing baseline.
In stationary operation, that G1 configuration measured approximately 154 W average consumption. The figure covers the whole robot at rest, not one subsystem, and it is a measurement for that configuration under Fraunhofer’s test conditions — not a constant for the category.
A second baseline effect matters for sizing. Extending the G1’s arms horizontally without added payload caused the actuators to overheat and drop after roughly one to two minutes in the tested configuration. Holding a posture can therefore be a thermal constraint before it is an energy constraint: the joint draws sustained current while producing zero mechanical output, and the electrical energy becomes heat in windings and power electronics.
Cyclic Loads During Walking and Posture Control
Walking superimposes a periodic load on the baseline. Fraunhofer IPA measured approximately 272 W while walking on level ground and around 283 W on a 10 percent incline, against the 154 W standing figure. For its defined one-hour standard scenario, the resulting average was approximately 239 W.
The standing condition consumed about 57 percent of level-walking power in this benchmark. Treating the difference between standing and walking as “the power of walking” misstates the load. The periodic layer rides on a baseline that never switches off, so both have to be budgeted together.
Walking power is also not smooth. Within each gait cycle, the hip, knee and ankle joints deliver torque pulses at push-off and absorb energy at contact. The average walking figure is an integration over those pulses. Current demand can rise sharply during push-off even when average walking power remains relatively modest, which is why a pack sized only against the walking average can still trip during ordinary locomotion.
Short-Duration Peaks During Dynamic Movements
Short-duration power peaks are often the most difficult part of battery sizing. Rising from a deep squat, jumping, running, carrying a heavy payload or recovering balance after an external disturbance concentrates energy demand into hundreds of milliseconds.
Published power budgets show the scale. A Monolithic Power Systems humanoid power architecture reference lists hip joints at 600–800 W average and 1500–2000 W peak, and describes leg subsystems drawing 3–4 kW per leg during burst conditions at a 48 V bus. A knee joint study on a 1-DoF leg platform reports that during a box jump the peak joint torque reached 286 Nm and peak joint mechanical power reached 1.5 kW — near the limits of the TQ-ILM8526SP actuator, whose motor-side peak torque is 9.37 Nm and nominal peak power is approximately 1.5 kW. The authors report short-term overload capability in the single-joint platform tests, but also observed loss of control beyond that range.
These figures come from different platforms and test conditions, so they should not be combined into a single robot specification. They nevertheless show how sharply power demand can rise during dynamic movements, and why transient capability is a separate requirement: a battery that meets the baseline and average walking demand may still fall short if its terminal voltage drops below the drive’s operating threshold.
Rated current does not define that requirement either. During landing, jumping or sudden acceleration, joint motors can draw well above their rated current for a short period. The actual figure depends on the actuator, the motor controller and its current limits, the bus voltage and the pulse duration, so it has to be established per robot rather than inferred from a motor rating or an average load.
Balance Energy Density, Power Capability and DCIR
Wh/kg and W/kg: Two Different Performance Requirements
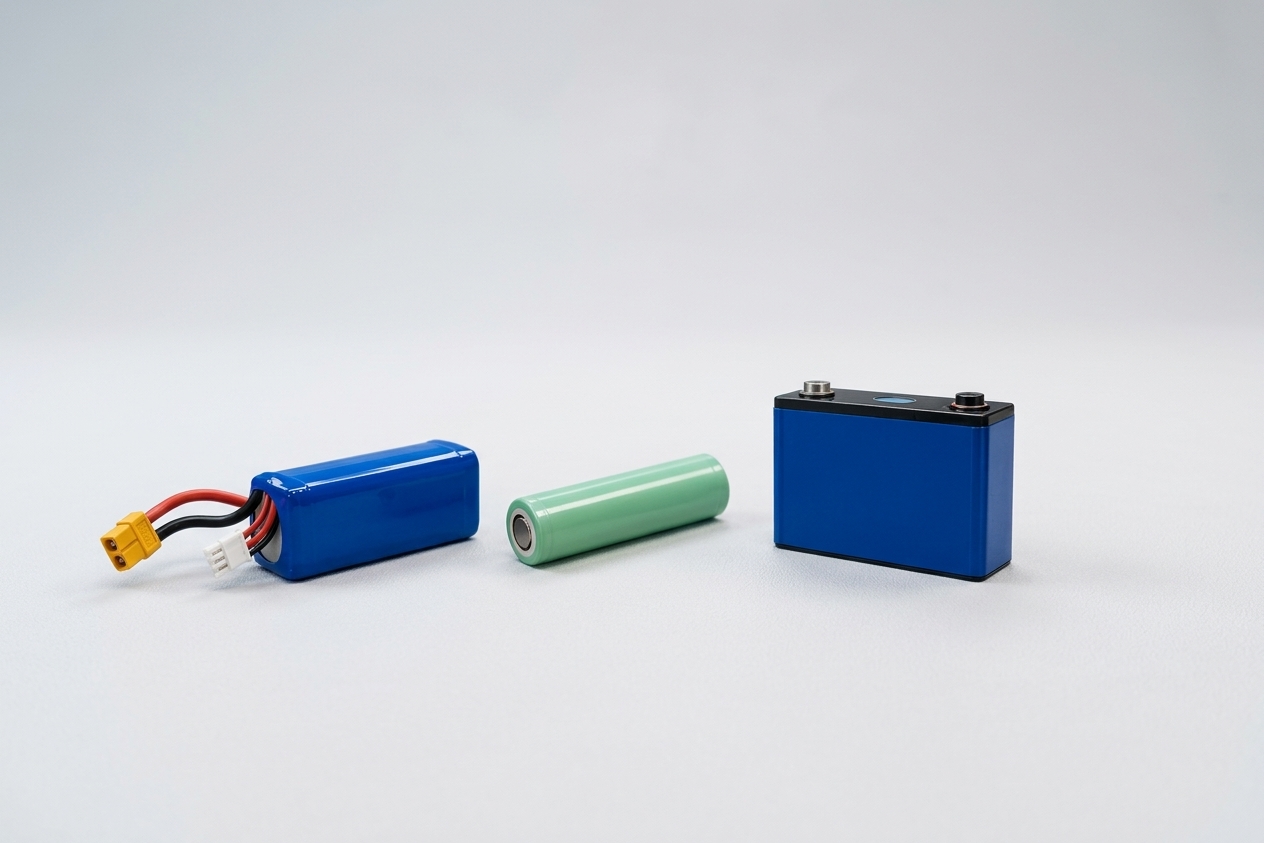
Gravimetric energy density, Wh/kg, states how much energy a cell stores per unit of its own mass. Gravimetric power density, W/kg, states how much power it can deliver per unit mass. Both figures are normally quoted at the cell level. They answer different questions: cell Wh/kg sets the ceiling on runtime for a given battery mass, and cell W/kg indicates the rate at which that cell can be discharged under defined conditions. Neither one, on its own, describes the finished pack.
The two are not independent, and the coupling runs the wrong way for a humanoid designer. Increasing cell-level energy density often involves raising active-material loading, improving electrode utilization, or reducing the relative mass of inactive components. However, higher electrode loading and thicker electrodes can lengthen the diffusion path lithium ions must travel through the electrolyte and the solid particles, which raises polarization and internal resistance at high rate. A cell optimized for higher energy density may therefore offer less power capability under demanding discharge conditions. A cell built for the opposite trade — thin electrodes, high-rate current collection — gives up energy density to gain power.
Neither figure transfers directly to the assembled pack. Cell-level Wh/kg drops once you add enclosure, interconnects, BMS, harness, connectors and protective structure. Power degrades differently: the pack has to deliver current at the bus where the drives connect, through contactors, fuses and the BMS current path, without crossing the permitted voltage sag. A cell’s W/kg cannot prove the pack meets a drive’s peak current demand.
So a high-Wh/kg cell and a high-W/kg cell may both be suitable, depending on the robot’s motion profile. Screen cells on cell-level energy and rate data, then write the actual requirement at the pack level.
How Cell Design Affects High-Rate Discharge
Several cell-design factors influence the balance between energy density and high-rate performance, regardless of cathode chemistry.
Electrode thickness and loading. Thicker, more heavily loaded electrodes raise energy per unit area and per unit mass, but increase ionic transport distance. Rate capability falls as loading rises.
Electrode microstructure. Tortuosity and porosity govern how easily electrolyte reaches the active material. Published research on thick-electrode architectures shows that aligning or templating the pore structure can restore rate capability in thick electrodes — but at added process cost, and with structural-integrity risks if binder content is cut too far.
Current collection and tab design. Ohmic resistance from current collectors, tabs and welds appears instantly under load. Tab geometry and cell format determine how much of the total resistance is ohmic rather than electrochemical.
Separator and electrolyte. Ionic conductivity in the separator and electrolyte sets the ohmic floor; it also determines how steeply resistance rises as temperature falls.
None of these is a chemistry label. A nickel-rich layered oxide cell can be built for energy or for power; so can a lithium iron phosphate cell. Chemistry alone is not enough to establish rate capability. Cell construction and test results under the intended discharge conditions provide a more reliable basis for comparison.
Compare Cell Performance Under Relevant Operating Conditions
Datasheet comparisons fail here for a specific reason: the conditions differ. A cell rated at a continuous 1C discharge and a cell rated at 20C continuous are not being measured on the same axis, and neither rating tells you what happens during a 10-second pulse at the robot’s peak current.
When comparing candidates, hold the test conditions constant and match them to the application:
Parameter | Why it changes the comparison | What to verify |
|---|---|---|
Discharge rate | Continuous and peak ratings describe different thermal and voltage states | Both ratings stated at the same temperature and cutoff |
Pulse duration | Short pulses capture mostly ohmic resistance; longer pulses add diffusion | The pulse length matches the robot’s longest peak action |
Temperature | Resistance rises as temperature falls, cutting available power | Data at the robot’s cold-start and hot-soak extremes, not only 25 °C |
State of charge | DCIR and available power can vary across the SOC range | Voltage response at the lowest and highest SOC expected during operation |
End of life | Resistance growth can reduce power capability even when the remaining capacity is still acceptable | Whether the rating holds at end-of-life, not only at beginning-of-life |
The last row is the one most often skipped. A pack that meets its peak requirement when new can fail it after a few hundred cycles, because resistance growth erodes power capability while remaining capacity still looks acceptable. Comparing at beginning-of-life only defers the failure to the field.
Understand Why DCIR Matters Under Peak Loads
How Internal Resistance Causes Voltage Drop
DCIR — direct-current internal resistance — is the resistance a cell presents to a current step, measured as the voltage change divided by the current change: DCIR = ΔV ÷ ΔI. It combines ohmic resistance from current collectors, tabs, welds, terminals and electrolyte, plus polarization from charge transfer and diffusion. Because those processes act on different timescales, the measured value depends on how long after the current step the voltage is read.
Under load, terminal voltage falls by approximately ΔV = I × DCIR. That single relationship connects the battery to the drive. A joint drawing a peak current I produces a voltage drop proportional to the pack’s resistance, and the bus voltage the inverter sees is the open-circuit voltage minus that drop.
The drop is instantaneous and does not wait for the battery to discharge — a pack at 80 percent state of charge can still experience an unacceptable voltage drop during a high-current pulse if its total resistance is too high. It is also self-reinforcing below the drive’s regulation point. If the inverter holds constant output power while bus voltage falls, it draws more current, which increases the drop further. A marginal voltage sag can therefore escalate into a protective trip rather than settling.
Heat generation follows a related relationship: P = I²R for the ohmic component of resistance — an approximation for resistive loss, not a claim that every DCIR measurement converts entirely into ohmic heat. Doubling resistance doubles ohmic heating at the same current. In a compact robot torso with limited cooling, repeated high-current pulses can cause heat to accumulate in the cells, interconnects and power electronics. Elevated temperatures may accelerate cell aging and reduce long-term power capability, even though instantaneous cell resistance may decrease as temperature rises within the normal operating range.
Cell-Level DCIR vs. Pack-Level Voltage Response
Cell-level DCIR is useful for initial screening, but it does not determine the voltage response of the complete pack. The pack adds resistance the cell datasheet never includes: nickel strips or busbars, welds, connectors, contactors, fuses, wiring and the BMS current path. In a multi-series string, cell-to-cell resistance variation compounds — one high-resistance cell becomes the string’s weak point and widens the voltage spread across the pack.
That is why the first question about any quoted DCIR is what object it describes, and under what pulse, temperature and state of charge. For selection, the number that matters is the worst-case pack-level voltage sag during the most demanding action, measured at the bus where the drives connect. Set against the drive’s minimum allowable bus voltage, it is the real constraint — a pack can pass a cell-level DCIR check and still fail at the bus on interconnect and connector losses alone.
Evaluate Peak Current, Pulse Duration, and Repetition
Peak current alone does not define the requirement. Three parameters together do: how large the current is, how long it lasts, and how often it repeats.
Amplitude sets the instantaneous voltage drop through I × DCIR. It is determined by the most demanding action in the motion profile — typically a jump, a loaded stand-up, or a disturbance recovery — not by the average.
Duration determines which resistance components are engaged. A pulse of a few seconds includes more diffusion contribution than a sub-second pulse, so the same cell shows a higher effective DCIR at longer pulse lengths. The pulse length used in testing must match the robot’s longest peak action.
Repetition governs thermal accumulation. A single peak may be thermally trivial; a peak repeated every few seconds during a work cycle is not, because heat from I² × DCIR accumulates faster than the pack can reject it.
A battery that can tolerate one short current pulse may not necessarily sustain the same pulse repeatedly. When high-current events occur in rapid succession, the time available for heat dissipation becomes limited. Internal resistance therefore affects not only instantaneous voltage drop but also the thermal margin available for subsequent movements. Battery validation should reproduce the expected pulse duration, repetition frequency and recovery interval rather than testing only a single peak-current event — a point that matters most for robots that walk continuously, stand up frequently, climb steps or repeat lifting tasks.
The pack’s peak discharge capability should be derived from the worst-case current profile, the drive’s minimum allowable bus voltage and the permitted voltage sag. The resulting requirement should include a project-defined design margin and be verified at the lowest operating temperature and the target end-of-life condition. A fixed factor such as a multiple of motor stall current is not a reliable substitute, because motor-side stall current is not the same as DC bus current, drivers may limit motor current, and joint peaks may not overlap in time.
A worked example shows the arithmetic. Take a nominal 48 V pack with an open-circuit voltage of 48 V at the relevant SOC, a 200 A peak lasting 0.5 s, and an assumed drive undervoltage threshold of 40.8 V — 15 percent below nominal, a project assumption rather than an industry standard. The permitted sag is 7.2 V, so the first-order pack resistance budget is 36 mΩ.
Read that number as a budget, not a product specification. It covers the whole pack rather than cell DCIR alone, it relies on a simple voltage-drop model, and interconnect resistance, BMS current-path losses, measurement tolerance and the drive’s own undervoltage behavior all draw on the same budget. The resistance value used must also come from a measurement at a comparable pulse length, temperature and SOC — at 0 °C the cold-condition figure governs the design.
Weigh Battery Mass Against Runtime in Robot Design
Cell mass share of complete production EV packs, measured by teardown: total cell mass divided by total pack mass. These are empirical reference cases from electric-vehicle packs, not humanoid robot packs, and they show that no single cell-to-pack conversion factor applies — the ratio depends on chemistry and architecture. The remaining mass is enclosure, interconnects, BMS, harness, connectors and protective structure.
The Weight Spiral in Humanoid Robots
Adding battery capacity to extend runtime adds mass, and in a legged robot that mass is not passive cargo. Every additional kilogram must be accelerated, decelerated and held against gravity by the same actuators on every step, stand-up and balance correction. Higher joint torque means higher current, which means more copper loss and more heat, which requires more energy for thermal management. The added capacity is partly consumed by carrying itself.
The mass budget is tight. One 2026 perspective on humanoid robot energy use discusses a 5–8 kg battery-mass envelope for a roughly 70 kg platform as a reference design constraint. This should be treated as an application-specific design estimate rather than a universal limit for humanoid robots — a heavier machine, a different actuator scheme or a different duty cycle will move it.
Consider a 5–6 kg battery allocation. At a cell-level energy density of 250–300 Wh/kg, the cells alone would hold roughly 1.25–1.8 kWh nominal, and less than that once structure, connections and the BMS take their share. That sets the scale of the energy budget; it does not predict runtime, which also depends on average power, movement profile and energy-management strategy.
Fraunhofer IPA’s benchmark offers a measured reference point for runtime instead. On the same G1 EDU-4 configuration, its energy-efficiency scenario reported a maximum operating time of about 2 hours 49 minutes when standing and about 1 hour 49 minutes in the typical mixed scenario, which averaged roughly 239 W. Those figures come from one platform under one test protocol, and a robot with different loads, a different gait or different compute will land somewhere else. But they show where a 5–6 kg class of pack actually lands when the average load sits in the 150–280 W range, rather than at the 2–4 hour estimate often quoted for mixed activity.
The 350 Wh/kg figure cited in that discussion is likewise a cell-level threshold for escaping the weight constraint — not what commercial liquid-electrolyte cells routinely deliver today, and not a pack-level target. Crossing it takes either a chemistry change or an accepted trade in power performance, which puts the designer back on the Section 2 trade-off.
Semi-solid and hybrid solid-liquid systems are one route being explored. A higher energy-density figure does not, however, mean better performance in a humanoid robot. The comparison has to cover continuous and pulse discharge capability, internal resistance, thermal behavior, cycle life and pack-level energy density, and pack performance further depends on packaging, structural protection, the BMS and thermal management. Until such cells come with full data at the pulse lengths a robot actually uses, the practical starting point stays a liquid-electrolyte cell whose energy and power were characterized together.
Balancing Runtime, Battery Mass, and Movement Efficiency
Battery sizing is therefore better evaluated in terms of energy per completed task than energy per hour. Two packs of the same nominal capacity can deliver different productive runtimes once their mass and the resulting energy per step are accounted for, so the relevant comparison is the energy required to complete the intended work under the robot’s actual duty cycle.
In practice, three factors influence this balance:
Cell energy density at the pack level. A higher cell Wh/kg helps only in proportion to how much of it survives integration. Enclosure, BMS, harness, connectors and protective structure all consume mass, so the pack-level figure is what enters the mass budget.
Motion efficiency. Reducing the energy per step — through gait tuning, actuator efficiency, or reduced moving mass — lowers the demand that the battery must meet, which can matter more than a marginal capacity increase.
Duty-cycle discipline. Compute load, sensor suites and thermal management run continuously. A perception model that saves mechanical time but doubles compute power may still improve total energy per task, or may not; the judgment belongs to measured energy per completed task, not to one subsystem in isolation.
When Battery Swapping May Be More Practical
For sufficiently long missions, adding onboard capacity buys less runtime per kilogram with each increment, until the gain turns marginal at the mass constraint. Swapping reframes the problem: the robot carries enough energy for a segment and exchanges packs at a dock, so pack mass stays inside the dynamic envelope and runtime becomes a logistics question — swap time, charger availability and the number of packs in rotation.
That trade favors swapping when the mission is long relative to achievable pack energy, the robot works from a fixed base, and exchange time is short next to the work segment it enables. It works less well for long untethered operation away from a base, or where removing the pack compromises structural integrity or sealing. A review of humanoid battery integration lists modular swappable packs, alongside distributed and hybrid architectures, as a design direction for exactly this reason. What swapping does not change is the pack itself: it still has to meet the same peak-current, sag-budget and thermal requirements, just over a shorter segment.
How to Select and Validate a Humanoid Robot Battery
Start with the Robot’s Actual Motion Profile
Battery requirements should be derived from measurements of the robot’s intended operating tasks. Record the robot performing its real tasks — walking, standing, rising, lifting, carrying, stopping, recovering from disturbance — and log bus current, bus voltage, peak power and any regenerated energy against time for each action.
The output is a motion profile with three separable layers: the continuous baseline, the periodic walking and posture load, and the discrete peaks. Average power from this record sets the energy budget and therefore the approximate capacity. The worst-case peak current, its duration and its repetition rate set the power and resistance requirements. Both come from the same log, and neither can be inferred from the other.
If the robot does not yet exist, the profile comes from simulation plus actuator datasheets, and it should be treated as provisional until hardware measurements replace it.
Define Voltage, Current, and Energy Requirements
With the profile in hand, derive the requirements in this order:
Bus voltage window. Establish the nominal bus voltage and the drive’s minimum allowable input. The gap between them is the sag budget available to the pack.
Peak current and duration. Identify the maximum current drawn from the DC bus under the worst-case combination of joint movements, including any current limits imposed by the motor drives, and note the pulse length. This is the condition the pack must survive without crossing the sag budget.
DCIR ceiling. Divide the sag budget by the peak current to get the maximum pack-level resistance, then confirm the pack meets it at end-of-life and at the coldest operating temperature.
Energy requirement. Integrate the profile over the mission to get usable energy, then divide by the usable-energy factor to size nominal capacity. The usable factor accounts for depth-of-discharge limits, cutoff margins and temperature derating.
If the pack cannot maintain the required bus voltage during peak loads, increasing nominal capacity alone will not solve the problem.
Verify Thermal Performance and Regenerative Charging
Thermal behavior must be verified under the repeated peak pattern, not a single pulse. Run the profile’s peak sequence at its real repetition rate and record cell and pack temperatures through the cycle. Confirm that temperature stays within the cell’s operating window and that the BMS derating, if it engages, does so predictably rather than as an unannounced power cut.
Regenerative charging needs separate verification. When a joint decelerates or the robot absorbs a landing, energy can flow back toward the bus. Whether the pack accepts it depends on state of charge, temperature and cell imbalance — a nearly full or cold pack may accept little or none. The architecture must define where that energy goes — a braking chopper, DC-link capacitance or a separate buffer — along with its voltage thresholds and energy sizing. Verify the acceptance limits and the fallback path together, because a pack that rejects regeneration without a defined sink creates an overvoltage event.
Evaluate the Complete Battery Pack
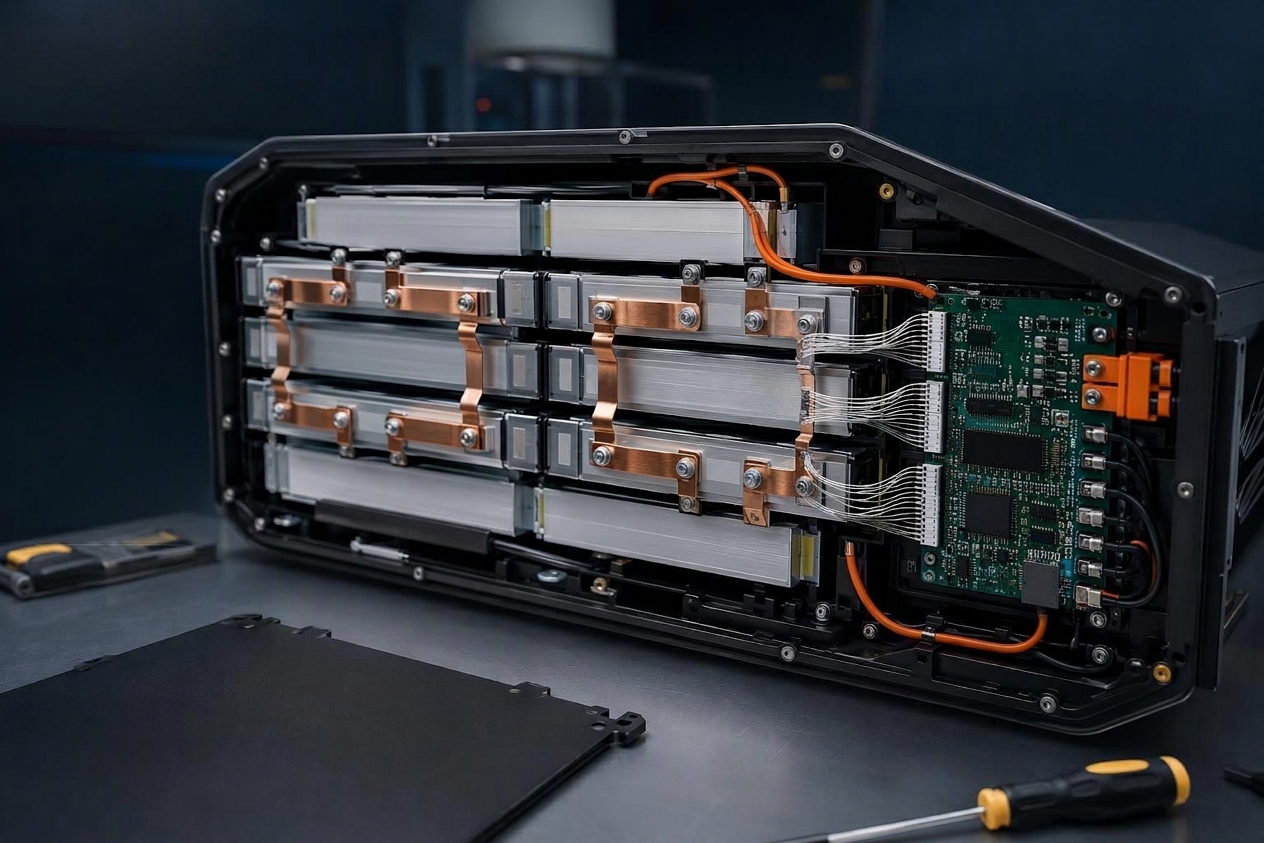
The final stage is to validate the complete pack, including the components and integration losses that are not reflected in cell-level specifications. The pack is not the sum of its cells: it includes the enclosure, interconnects, BMS, harness, connectors and protective structure, and each adds resistance, mass and thermal path.
What to request | What it establishes | What it does not establish |
|---|---|---|
Cell datasheet and cell test report | Cell parameters under the stated test conditions | Pack-level voltage response or energy density |
Pack pulse test at the robot’s peak current, duration and temperature | Whether the pack holds the sag budget under the real condition | Performance outside the tested conditions |
Pack-level mass and energy breakdown | Whether the claimed Wh/kg can be rebuilt from declared inputs | Independently measured performance |
Thermal test at the real repetition rate | Whether heat accumulates within limits | Long-term aging behavior |
End-of-life power data | Whether the peak requirement still holds after aging | Beginning-of-life margin |
Regeneration acceptance limits and sink definition | Whether recovered energy has a defined path | Performance under all states of charge |
Run these checks against one representative duty cycle rather than separately. Energy capacity against total task energy, peak-current capability and DCIR against the most demanding movement sequences, thermal behavior across repeated high-load operation, and voltage stability plus usable energy across the complete pack. The point is to separate a battery that meets individual component specifications from one that supports the robot’s actual working profile.
A pack Wh/kg or DCIR figure that cannot be rebuilt from the supplier’s own declared inputs is unverified, not necessarily false, and shouldn’t enter a design decision until it can be rebuilt. Herewin’s cell-level versus pack-level energy density analysis applies that same rebuild logic to energy claims, and a resistance claim deserves identical treatment.
Before tooling begins, the OEM and battery supplier should agree on a validation plan covering the motion profile, peak-load conditions, temperature limits, end-of-life targets and pass criteria. Coordinating cell and pack development around those requirements reduces the number of documents to reconcile later; Herewin’s in-house cell and pack production, together with ODM/OEM engineering support, keeps both sides of that development in one process. The final configuration and performance targets still have to be validated against the robot’s actual motion profile.
Select the Battery Around the Robot’s Motion Profile
A suitable humanoid robot battery must meet two requirements at the same time: it must store enough usable energy for the intended mission, and it must maintain stable power delivery during the robot’s most demanding movements.
They can’t be evaluated independently, and the starting point for OEMs is the robot’s motion profile: measured operating data to set the energy budget, the worst-case current pulses to set the resistance ceiling, and validation of the complete pack at representative temperature, SOC and end-of-life.
Variable | What it determines | What it means for selection |
|---|---|---|
Wh/kg | Energy stored per unit mass | Sets the theoretical runtime and the battery mass |
W/kg | Power delivered per unit mass | Sets the ability to supply high-load actions |
DCIR | Voltage response to a current step | Sets transient sag and power stability at the bus |
Peak current | The largest current the pack must supply | Determines whether stand-up, jump and lift actions complete |
Battery weight | The pack’s own mass | Feeds back into motion energy and dynamic performance |
Each variable can be optimized at the expense of another. No single datasheet value settles whether a battery suits a given humanoid robot; the complete pack’s behavior under the robot’s expected operating conditions does.
If you’re sizing a pack against a real motion profile, you can talk to Herewin’s battery engineering team about your project requirements.


 Bahasa Indonesia
 English
 Español
 한국어
 Deutsch
 Français
 日本語
 Русский
 ไทย
 العربية
 Português do Brasil
 Italiano
 Nederlands