
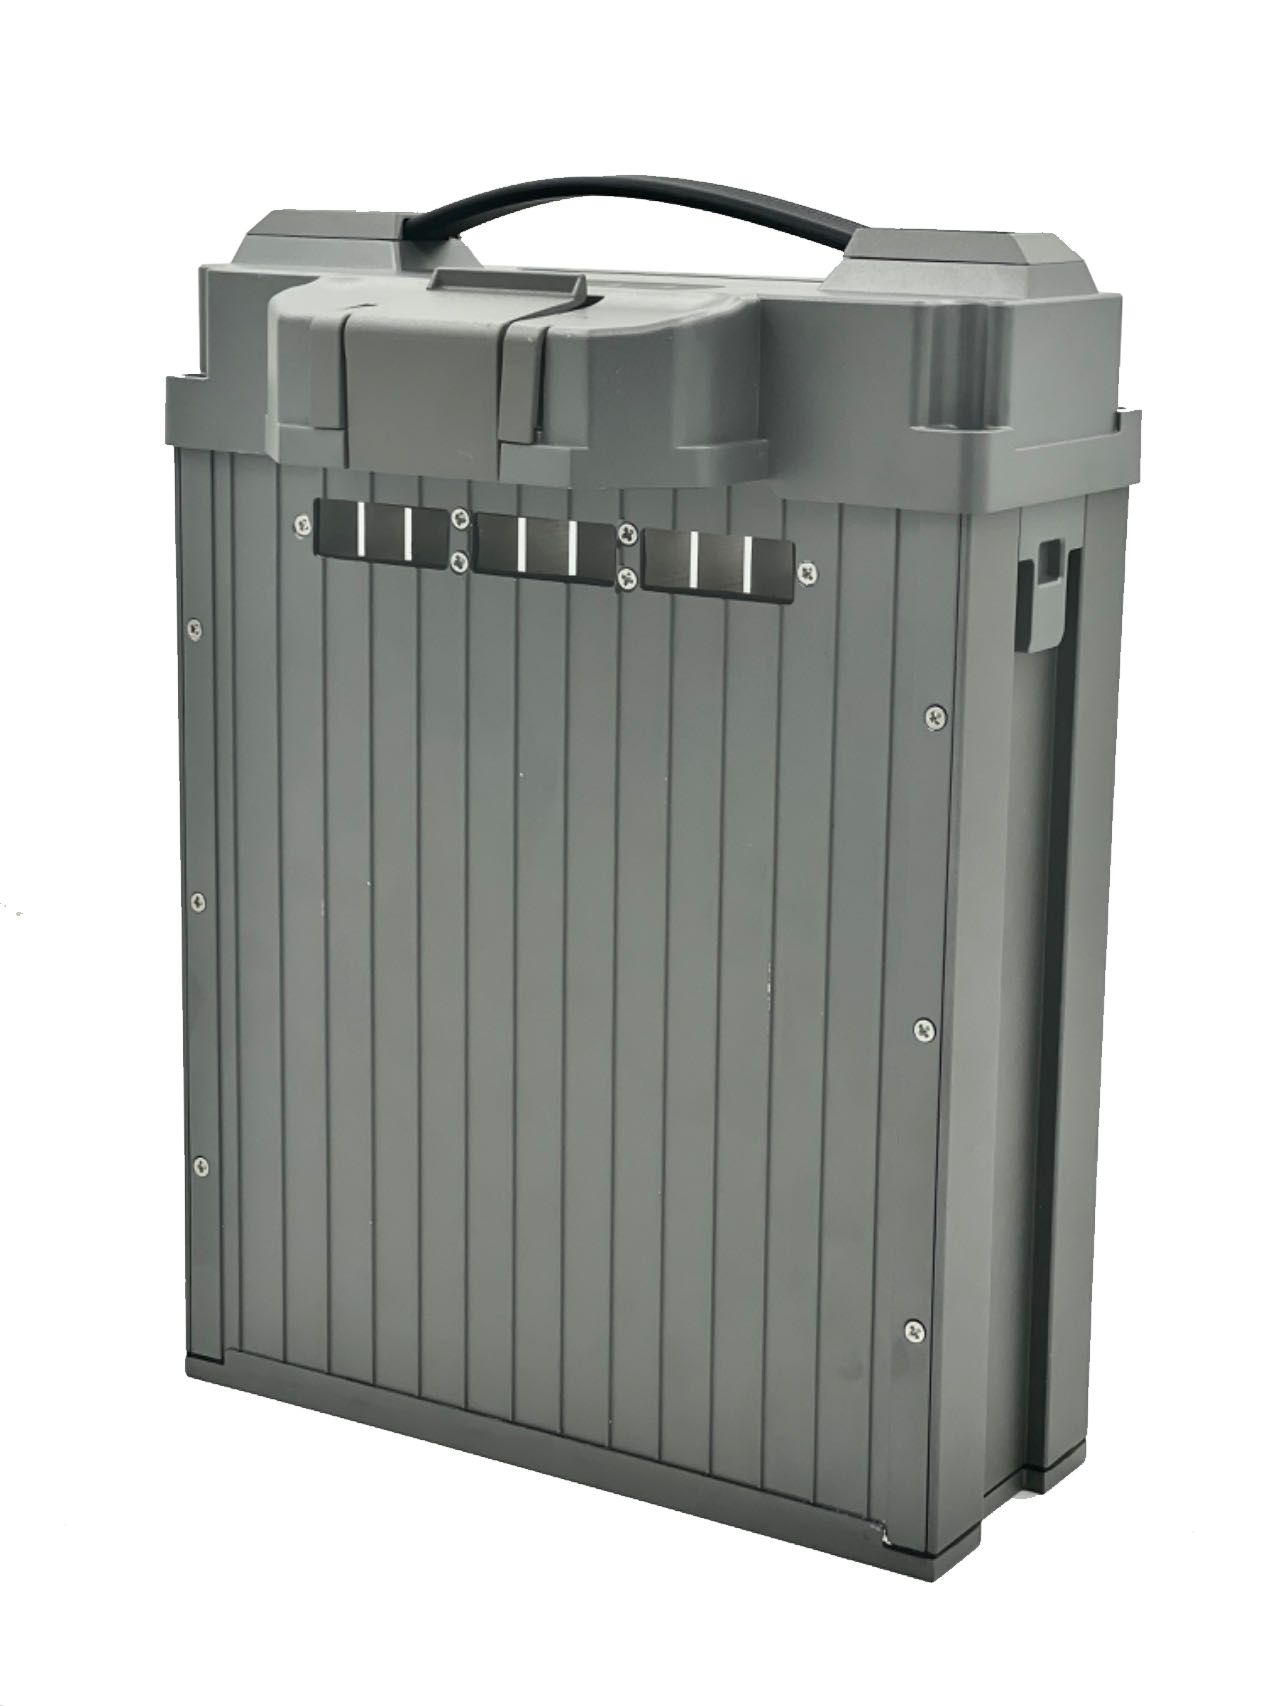
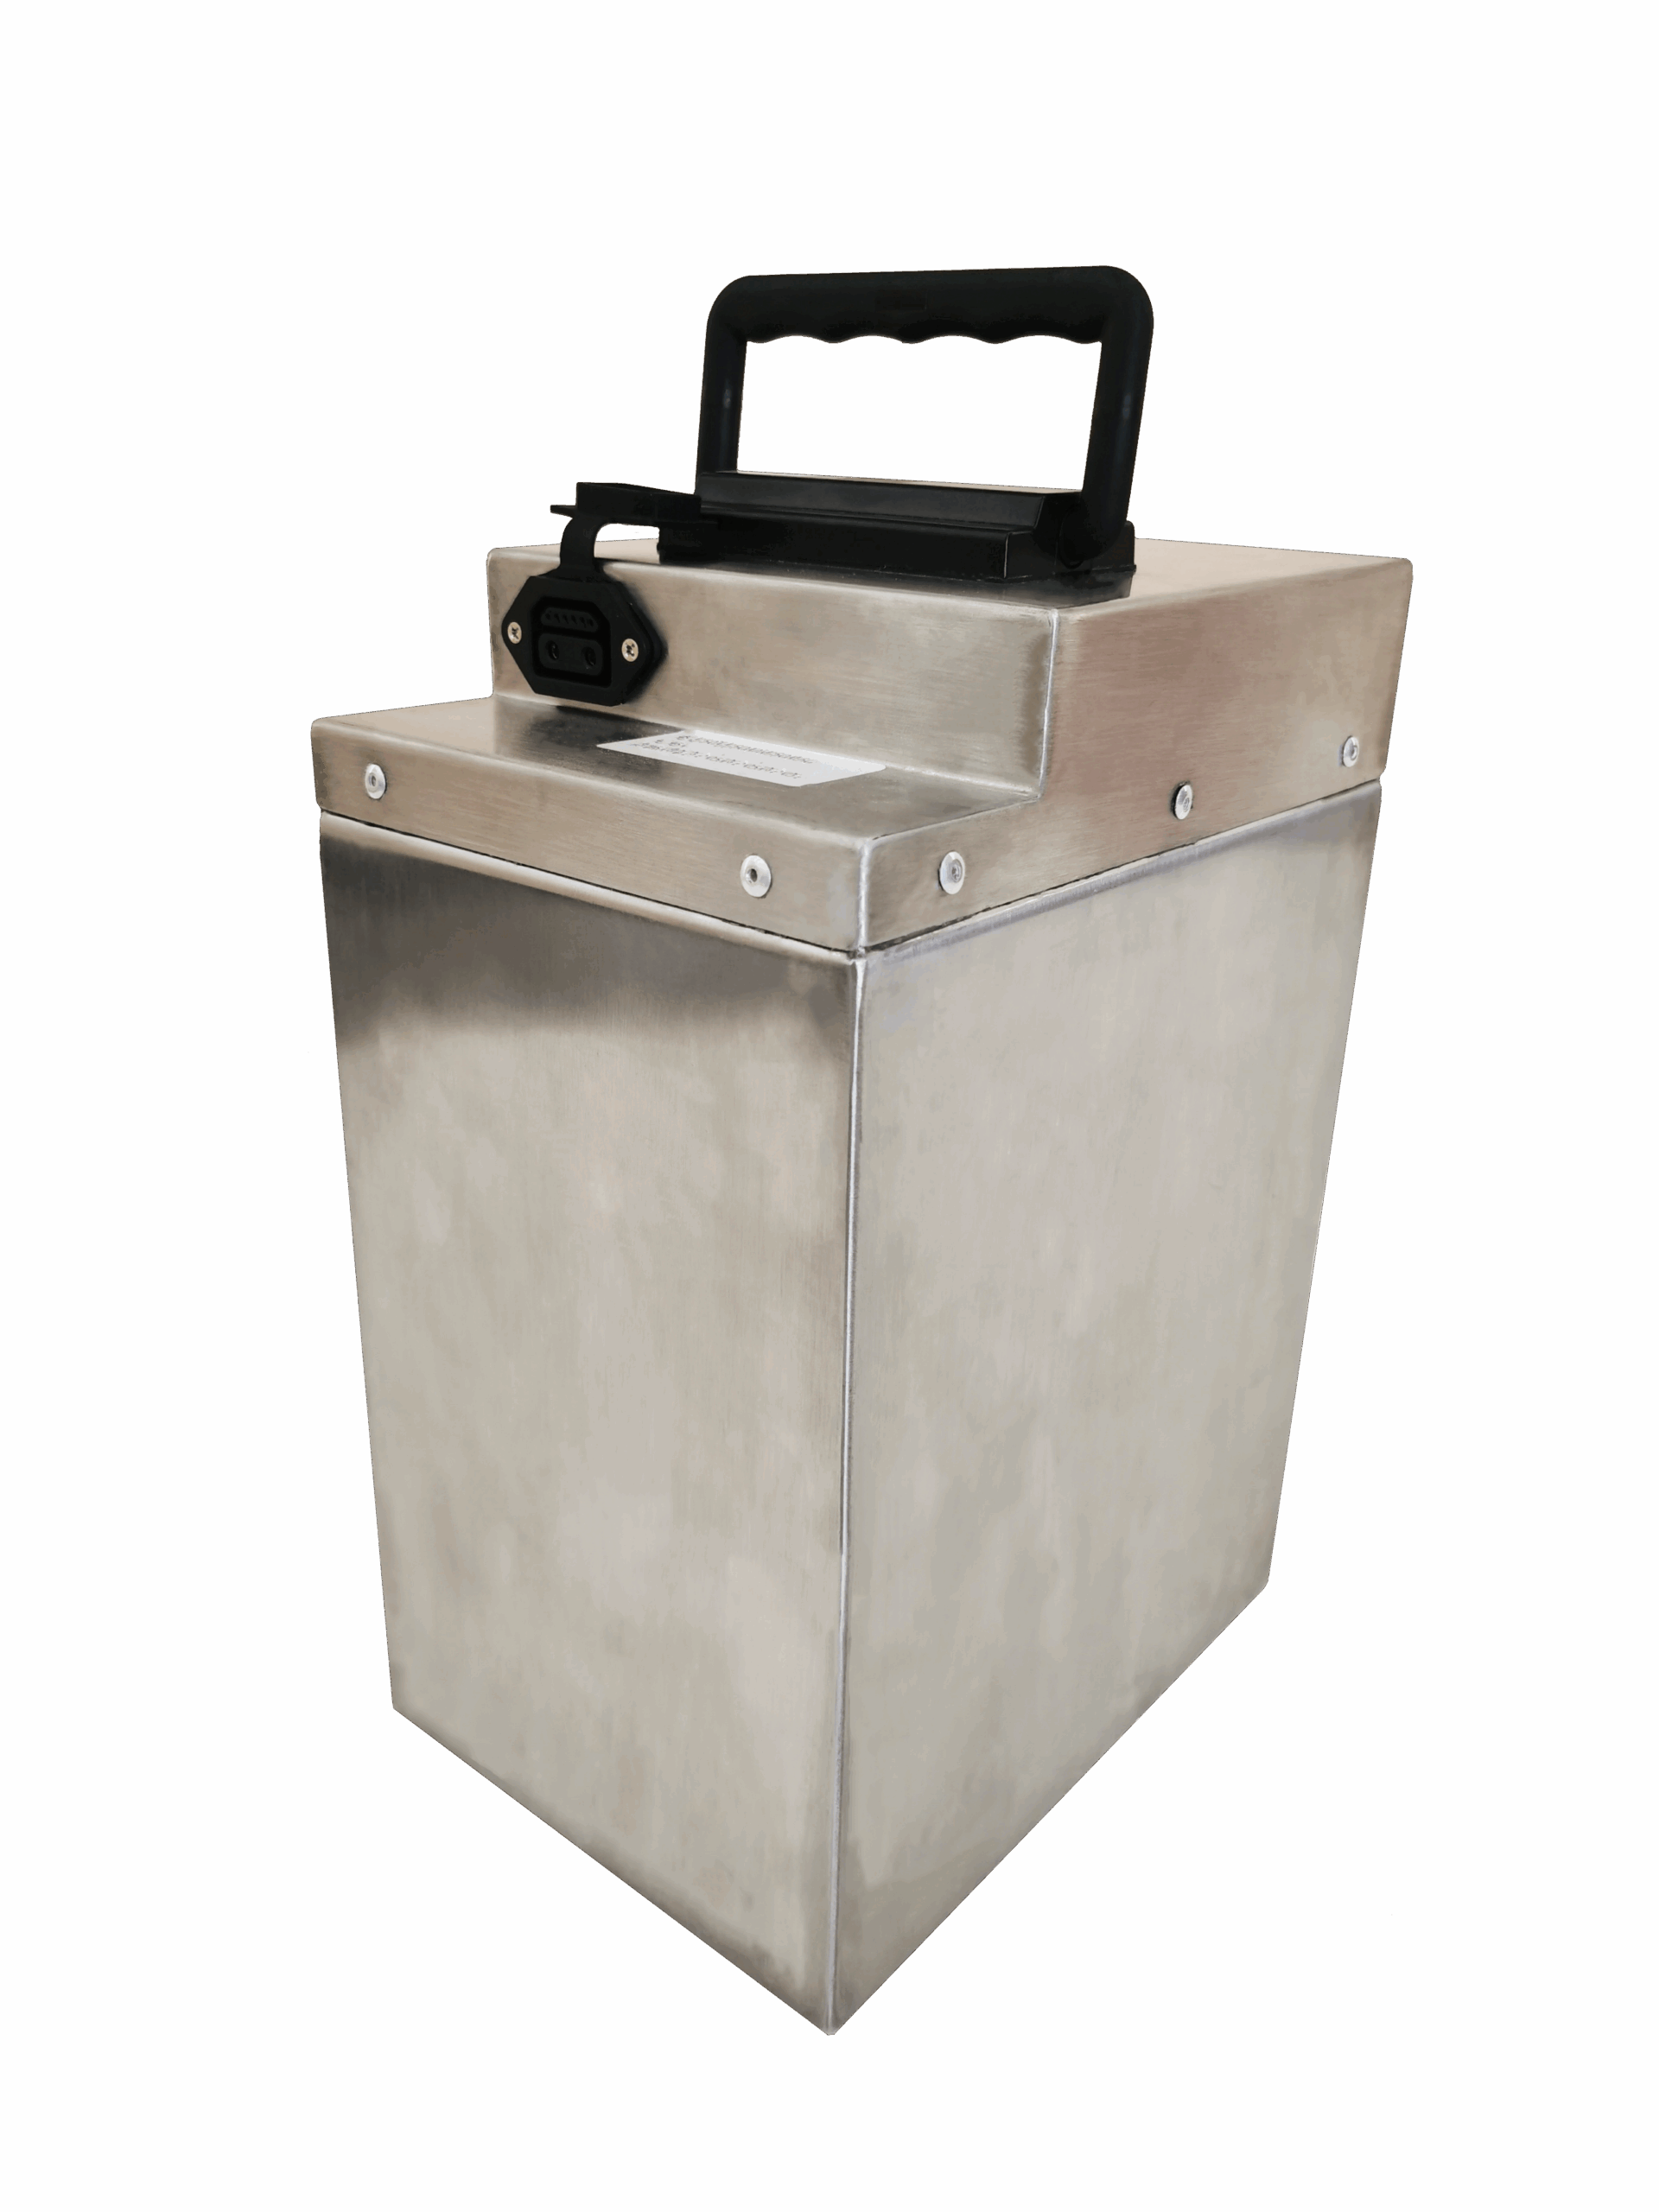
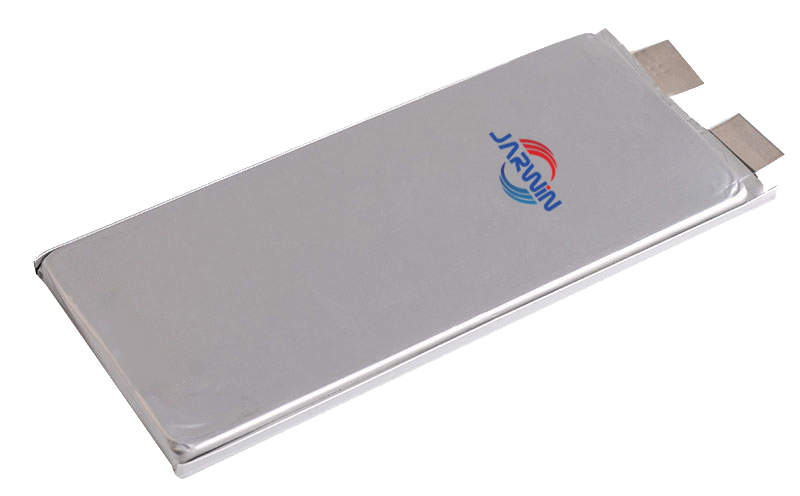
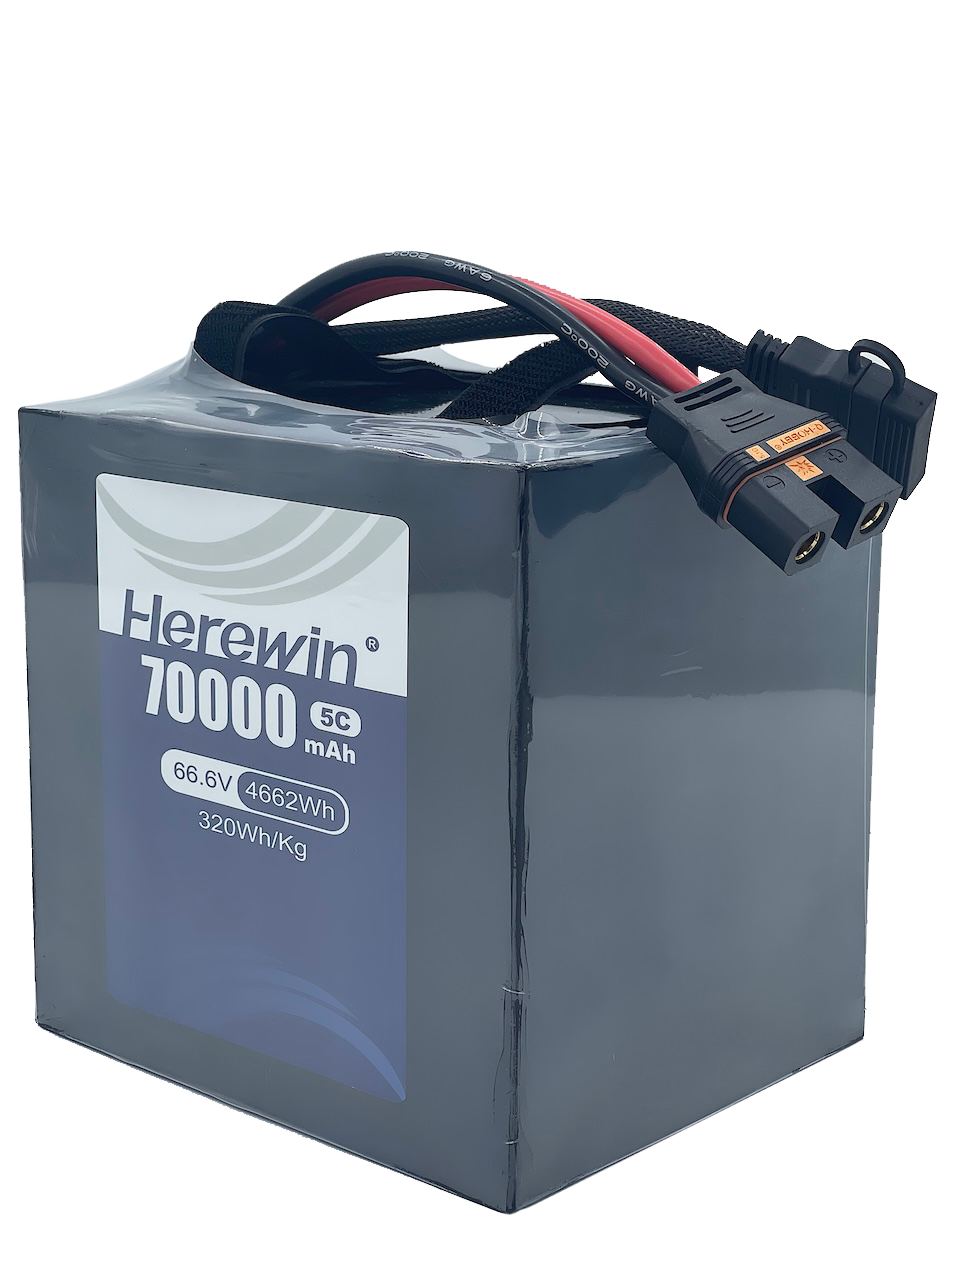





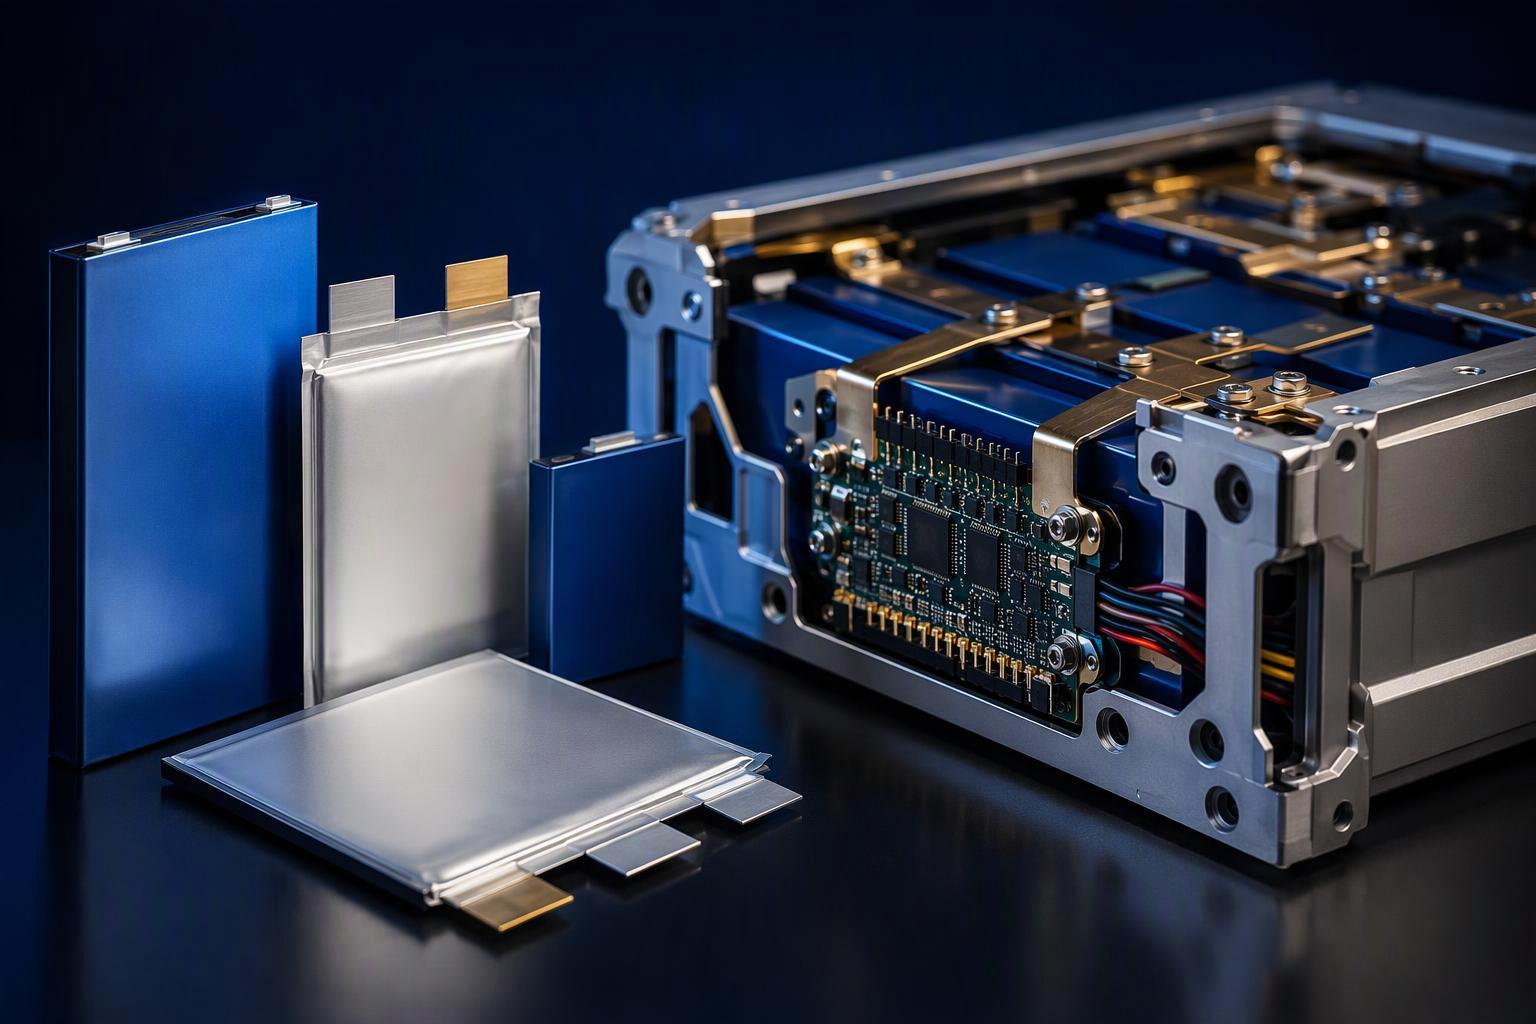
Two UAV battery suppliers can quote the same unit, Wh/kg, and still describe two different objects. One figure belongs to a bare cell weighed on a laboratory scale. The other belongs to a complete pack whose declared mass boundary may include an enclosure, interconnects, control electronics and mounting hardware. The number may look identical, but the objects being measured are different. That is why the measurement boundary matters as much as the figure itself.
A high cell-level Wh/kg is a useful starting point because it reflects the specific energy achieved by the complete cell design before pack integration. It does not represent the complete pack, since the pack carries mass the cell never had. So the buyer’s question is not “which supplier quotes the highest figure” but “which object, which energy basis and which mass boundary does this figure describe.” This article gives you a calculation you can run on a supplier’s own numbers, plus a way to verify the documents behind them.
What Is Cell-Level Energy Density?
Cell-level energy density is the cell’s stated or measured energy divided by the cell’s own mass. The figure should identify whether the energy is nominal or measured under specified discharge conditions. The denominator should include the complete cell as defined by the supplier’s specification, not pack components outside the cell.
The reference method is IEC 62660-1, which defines how to measure cell mass energy density (IEC 62660-1:2018). It was written for lithium-ion cells in electric road vehicles, so treat it as a documented method rather than a rule every UAV cell must follow. What carries over for supplier comparisons is simple: identify the tested cell, the energy basis and the discharge conditions behind any reported value.
The reported energy density also depends on the test conditions. A cell’s nominal rating is not the same as its measured discharge energy under a specific test. Discharge rate, temperature and cut-off conditions can affect the energy delivered, and therefore the calculated Wh/kg value. A spec-sheet figure without its rated parameters is incomplete, not necessarily wrong.
For procurement, a cell figure is a valid input when you are comparing cell and material options, and its scope stops at the cell. It cannot be transferred to a pack-level decision without the integration step covered later in this article.
What Is Pack-Level Energy Density?
Pack-level energy density is the energy attributed to a complete battery pack, divided by the mass of everything included within the supplier’s declared pack boundary. The energy figure may be nominal or measured under specified discharge conditions, and that distinction must be stated. Road-vehicle standards make the same point about scope. UNECE Regulation No. 100’s REESS definition includes the ancillary systems for support, thermal management, electronic control and enclosures, and it allows a report on either the complete system or a subsystem (UNECE Regulation No. 100 Rev.3). ISO 12405-4:2018 draws a similar line from the measurement side, separating pack-level performance testing from cell-level testing (ISO 12405-4:2018). Neither applies to UAVs directly, but both show why the boundary matters: a reported result may describe a complete energy storage system or a defined subsystem.
That is why a supplier must declare whether a figure describes a cell, a module or a pack. A complete pack may include cells, enclosure, interconnects, a battery management system, harness, connectors and protective structure, and the exact list depends on the product architecture. Two numbers in the same unit are not comparable when the object differs.
Why Does Pack-Level Energy Density Differ from Cell-Level Energy Density?
Four common design factors help explain the difference between cell-level and pack-level energy density:
Mechanical structure and protection. Enclosure, brackets and crash or impact structure hold the cells in place and protect them, and they add mass without adding energy.
Electrical interconnection. Tabs, busbars, welds and harness carry current between cells, and their mass scales with cell count and current path.
Control hardware. The battery management system monitors and protects the pack. Whether it, along with the harness, connectors and mounting hardware, is included in a quoted mass must be confirmed from the supplier’s declared pack boundary.
Application-specific design requirements. Thermal management, environmental protection and safety provisions can add mass depending on the pack architecture.
Two studies from outside the UAV world show how wide that gap can be, and both are worth reading as reference cases rather than as design coefficients. A 2025 empirical teardown study of production EV packs measured the ratio directly: total cell mass divided by total pack mass came to 0.77 for LFP, 0.63 for NMC and 0.67 for NCA (Koloch et al., MDPI World Electric Vehicle Journal 16(9):484). NASA’s electric-aircraft work reaches the same lesson from a different angle: the X-57 reference battery uses 225 Wh/kg cells to build a 149 Wh/kg pack, and the study warns that doubling cell energy density does not translate to doubled pack energy density (NASA/AIAA cell-to-pack scaling study).
Keep those two cases apart. They come from passenger cars and crewed electric aircraft, with their own structural, thermal and safety requirements, so their numbers show that the conversion ratio is not fixed, not what a UAV pack should achieve. The takeaway is directional, not numeric: higher cell energy density does not guarantee a proportional gain at pack level, because the result depends on how the cells are integrated.
The practical consequence is direct: ask which components a supplier’s mass figure includes, and use their own data instead of a cross-application average.
How to Calculate and Compare Cell-Level vs Pack-Level Energy Density
You can check a supplier’s pack claim with a calculation, but the right formula depends on what you already know. Each case below uses a different denominator, so never combine packing factor, cell mass share and inactive mass fraction in one equation. Fix the terms first. Define the cell mass share as total cell mass divided by complete pack mass, and the non-cell mass fraction as non-cell mass divided by the same pack mass. They are complementary when every part is counted once:
f_cell + f_non-cell = 1
Some sources call the cell mass share a “packing factor,” but check the term against the source’s own definition before using it. Stacking three overlapping mass factors is what double-counts the same gap.
Case A: you know the complete pack’s total energy and total mass.
This requires no cell-to-pack conversion factor, making it the most direct method:
Pack energy density (Wh/kg) = Pack energy (Wh) / Pack mass (kg)
Both values must belong to the same complete pack, and the result is only as reliable as its inputs. If the energy is measured discharge energy under stated conditions, the result is a measured pack-level energy density. If it is a nominal or nameplate value, the result is a nominal figure, not a substitute for a pack performance test. State which one you used, because the two are not interchangeable.
Case B: you only have cell energy density and the cell mass share.
Before you run it, note one assumption: the cell-level energy must be aggregable on a basis consistent with the pack-level figure. Actual pack energy may differ, because of pack configuration, operating limits, cell variation and test conditions. Use the formulas for a transparent estimate, not as a substitute for measured pack performance. If the cell and pack energies use the same basis, and the cell energy can be summed under that same condition, then:
E_pack ≈ E_cell × f_cell, where f_cell = m_cells / m_pack
f_cell is the total cell mass divided by the total pack mass. It is a single share, not one loss factor stacked on another. There is no separate active-mass term to multiply in.
Case C: you only have cell energy density and non-cell mass defined against cell mass. If the non-cell components weigh r times the cell mass, then:
E_pack ≈ E_cell / (1 + r)
Here r must be defined as non-cell mass divided by total cell mass. If instead you are given non-cell mass as a share of the complete pack, use Case B, not this one.
A quick example makes the difference concrete. Suppose a supplier quotes a cell at 250 Wh/kg and states that the cells weigh 80% of the complete pack. Under a consistent energy basis, Case B gives E_pack ≈ 250 × 0.80 = 200 Wh/kg.
Now check that result against the direct route. If the pack holds 2 kWh of cells at 250 Wh/kg, the cells weigh 8 kg. At an 80% share, the full pack weighs 10 kg, so 2 kWh / 10 kg = 200 Wh/kg. Both routes agree, which is the point of the check.
If the supplier instead reports a 12 kg pack at the same energy, the mass share becomes 8 / 12 = 67%, and the pack figure falls to approximately 167 Wh/kg. That number reflects the mass share only. It is a worked illustration, not a measured result for any Herewin pack.
Cases B and C are calculated estimates, not measured performance. Verifying the inputs can improve confidence in the estimate, but it does not turn the result into a measured pack-level figure; a discharge test is needed for that. When you rely on an estimate, record the cell figure, its C-rate, the share you used and the energy basis, so a reviewer can see where the number came from.
To check a real claim, rebuild it from the supplier’s own inputs. Run Case A with the pack’s total mass and energy, then Case B or C with the supplier’s cell rating and mass breakdown. If your calculation agrees with the claimed figure, the claim is arithmetically consistent with the inputs provided, though that does not independently validate performance. If the figures do not agree, investigate the mass boundary, energy basis, configuration or test conditions before drawing a conclusion. A pack Wh/kg that cannot be rebuilt from the supplier’s own data is unverified, not necessarily false.
Nominal Energy vs. Usable Energy: Why the Difference Matters
Nominal pack energy does not necessarily equal the energy available during a UAV mission. Nominal energy is a declared rating, while measured discharge energy depends on the test conditions. The usable amount depends on the operating limits, discharge profile, temperature and system requirements, so two packs with the same nominal rating can offer different mission energy. A usable state-of-charge window gives a first-order estimate of the energy available: a pack with a 95% maximum and 20% minimum state of charge has a 75% window, so a 10 kWh nominal battery gives 7.5 kWh. This is simplified; actual delivered energy depends on the load, temperature and cut-off conditions.
The mechanism behind the cutoff matters for UAV sizing. In a pack that monitors individual cell voltages, discharge may stop when the lowest-voltage cell reaches its protection threshold under load, even if the pack’s average voltage suggests energy remains. Cell-to-cell variation can push the weakest cell to its threshold earlier, so packs with the same nominal rating can deliver different usable energy.
For procurement, endurance claims belong with usable energy, not nominal energy. For flight-time estimation, a pack-level usable energy figure is a more relevant input than a nominal rating, and the drone flight time calculator shows how it combines with payload and power demand. It still has to be read alongside its state-of-charge window and cutoff conditions, and against the UAV’s power demand, system efficiency and mission profile.
How Should Buyers Compare Battery Energy Density Claims?
Compare claims by the object, energy basis, mass boundary, test conditions and evidence source, in that order, before comparing the numbers themselves. This UAV battery buying guide walks through the same review sequence. Fill in the table below for each supplier you are evaluating. It is built to copy straight into a procurement review sheet.
Comparison field | Supplier A | Supplier B | Why it matters |
|---|---|---|---|
Reported level | Cell / Module / Pack | Cell / Module / Pack | Confirms both figures describe the same object |
Energy basis | Nominal / Measured / Usable | Nominal / Measured / Usable | Identifies which energy definition each figure uses, rather than an exclusive category |
Mass boundary | List included components | List included components | Checks whether the same components are counted |
Test conditions | C-rate, temperature, cut-off | C-rate, temperature, cut-off | Shows whether the results are comparable |
Pack configuration | Model, configuration, version | Model, configuration, version | Confirms the data relate to the evaluated product |
Evidence source | Cell datasheet / Supplier calculation / Pack test report | Cell datasheet / Supplier calculation / Pack test report | Names the specific source behind the claim |
Reported energy and mass | Wh and kg | Wh and kg | Allows the buyer to recalculate Wh/kg |
Consider this illustrative example, using hypothetical supplier figures to show how the table separates two numbers that look alike on a spec sheet. Supplier A quotes a pack at 200 Wh/kg based on a pack-level test report at 0.5C, with the full enclosure and BMS inside the boundary. Supplier B quotes 230 Wh/kg from an estimate based on cell-level data reported at 3C, with the enclosure excluded from the pack mass. Same unit, same apparent category, and the table shows exactly where they stop being comparable. Supplier B’s figure is an estimate, not a measured complete-pack result, so it cannot be treated as a higher real pack Wh/kg until the estimate is reconciled with a clearly defined pack boundary and pack-level performance data.
The documents you receive fall into three groups, and each group supports a different judgment. Keep them separate instead of treating a file name as proof of anything.
Document type | What it can support | What it cannot prove on its own |
|---|---|---|
Cell datasheet or cell test report | Cell parameters and performance under stated conditions | Complete-pack energy density |
Pack performance test report | Performance of the stated pack configuration under stated test conditions | Performance across all operating conditions |
Supplier calculation or mass breakdown | An estimate that can be checked against declared inputs | Independently measured pack performance |
UN 38.3 test summary | Identification and traceability of the tested cell or battery design for transport | Pack Wh/kg, usable energy or cycle life |
A compliant UN 38.3 test summary records the key identity and safety data, including the mass and, for lithium-ion, the nominal energy or watt-hour rating (TÜV Rheinland UN38 information sheet). It is a transport-related test record, not a pack performance or bill-of-materials document. It identifies the tested design and records its declared nominal energy, but it does not independently establish usable energy, pack-level Wh/kg or cycle life. The same caution applies to a pack performance report: read the pack configuration, the test conditions and how the results are defined before you accept the headline number.
If these checks leave open questions, Herewin can help compare a pack figure against your target configuration. Share the reported energy and mass, and we’ll help you trace whether they describe the same object. You can reach our engineering team here.
Finally, a supplier claiming a pack figure should be able to point to pack-level measurement or a declared calculation with its inputs. Note that IEC 62619:2022 is a safety standard for industrial lithium cells and batteries; it specifies no energy-density test and sets no Wh/kg threshold (IEC 62619:2022). A safety certificate is not a density claim.
What Cell-Level vs Pack-Level Energy Density Means for UAV Design
For UAV design, pack-level Wh/kg is a more relevant starting point than cell-level Wh/kg because the aircraft must carry the complete battery assembly. But pack energy density alone does not determine flight time: usable energy, continuous and peak power, thermal limits, mounting constraints and mission demand all affect the final result.
When evaluating a battery for a specific UAV, start with the complete pack’s mass and energy, then check whether its usable-energy window and power capability match the mission. A cell with a higher Wh/kg rating is not automatically the better choice if the integrated pack cannot meet the aircraft’s weight, power or operating requirements.
PERTANYAAN YANG SERING DIAJUKAN
What is the difference between cell-level and pack-level energy density?
Cell-level energy density divides a single cell’s energy by that cell’s own mass. Pack-level energy density divides the complete pack’s energy by the mass inside the supplier’s declared pack boundary. The two describe different objects and are not interchangeable, so check the energy basis before comparing them.
Why is pack-level energy density lower than cell-level energy density?
Under comparable energy definitions and test conditions, pack-level Wh/kg is generally lower because the complete pack includes non-cell mass such as interconnects, control electronics and structural components. The size of the difference depends on the pack architecture, so no single reduction factor fits every UAV battery.
Is there a standard cell-to-pack loss percentage I can apply?
No. The ratio depends on architecture, chemistry and pack design. Instead of applying a blanket factor, ask the supplier for the mass breakdown and rebuild the pack figure from their own cell rating and component weights.
How do I calculate battery pack energy density from a cell rating?
It depends on the available data. If you know the complete pack’s energy and total mass, divide the energy in Wh by the mass in kg. If you know the cell-level energy density and the cell mass share, use:
E_pack ≈ E_cell × f_cell
where f_cell is the total cell mass divided by the complete pack mass. If non-cell mass is expressed as a ratio r of cell mass, use:
E_pack ≈ E_cell / (1 + r)
These are calculated estimates, not measured pack-level performance.
What data should buyers request to verify a pack-level energy density claim?
Ask each supplier for:
The reported object: cell, module or pack
The energy basis: nominal, measured or usable
The declared mass boundary and component list
The test conditions: C-rate, temperature and cut-off
The evidence source behind the claim
Then rebuild the pack figure from their own cell rating and mass breakdown, and tie any endurance claim to usable energy rather than nominal energy.
Compare the Object, Not Just the Number
The number that matters is the one whose object, energy basis and mass boundary you can name. Cell-level figures are valid inputs for comparing chemistries and cell options. Pack-level figures are what determine aircraft weight and endurance, and the step between them is set by pack design, not by a fixed percentage.
The next step is a data request, not a purchase order. Ask each supplier for the reported object, the energy basis, the mass boundary, the test conditions and the evidence source behind any density claim, then rebuild their pack figure from their own inputs. If the arithmetic closes, the claim is consistent with those inputs. It becomes comparable with another supplier’s figure only when the same fields are aligned.
If you already have supplier figures but want to know what they really cover, talk to Herewin. Share your target configuration and the specifications you’ve received, and we’ll walk through the pack-level energy, total mass, energy basis and test conditions together.
 Bahasa Indonesia
 English
 Español
 한국어
 Deutsch
 Français
 日本語
 Русский
 ไทย
 العربية
 Português do Brasil
 Italiano
 Nederlands