






Purchase price is only the starting point. The comparable figure is cost per flight hour, and it is built from your own operating data rather than read off a spec sheet. Two semi-solid battery quotes can arrive with the same capacity, the same voltage and two different cycle-life claims, and neither one tells you which pack is cheaper to fly. Choosing on purchase price alone can lead to higher battery costs over time. Conversely, paying more for a longer cycle life brings little value if the pack is retired before that additional life can be used.
No public benchmark exists for semi-solid battery cost in dollars per kilowatt-hour. The conventional lithium-ion averages that trackers publish describe that chemistry across the whole market; they are not a reference price for a drone pack, and they say nothing about semi-solid products. Any specific cost multiple you hear comes from a single vendor describing a particular product, not from a market rule. In both cases, a market average cannot stand in for the actual quote in front of you.
The calculation below uses landed pack cost, an estimated usable cycle count supported by relevant test data, and average flight hours per cycle. The result is only comparable when the cost scope, cycle-life criteria and operating assumptions are aligned.
What actually determines semi-solid battery cost?
The core calculation uses three inputs: landed pack cost, usable cycles and average flight hours per cycle. Other expenses, including charger costs and any required system modifications, should be assessed separately if you are comparing total project costs. A pack price often covers the pack and nothing else — the charger, any custom design or tooling, and freight and duties may sit outside the number — so line those items up before you treat either quote as final. And if you’re replacing an existing pack, check whether the new cell can work with the BMS, charger and airframe you already have: any required changes add upfront project costs that never appear in the pack quote or in the cost-per-flight-hour figure below.
How cycle life affects battery replacement
Cycle-life results can differ substantially with charge and discharge rates, depth of discharge, temperature and the end-of-life criterion, so a quoted number is only meaningful when those conditions are stated alongside it. Two vendors can quote the same cell at very different cycle counts without either being wrong.
The endpoint has to match. A 100 Ah pack rated to 80% end of life still has roughly 80 Ah available at that point — it has reached its rated threshold rather than stopped working. Compare two packs on the same endpoint (80%, 70%, or a power threshold), or the difference you see may be the definition rather than the product.
When a supplier provides a cycle-life range, ask for the source, the product it applies to and a verifiable test report. Until the test conditions and end-of-life criteria are clear, treat the figure as a planning estimate rather than a directly comparable input.
How do I calculate cost per flight hour from a purchase quote?
A few terms are worth fixing before the numbers start moving, so the comparison stays consistent from here on:
Pack purchase price — the figure in the supplier’s quote for the pack itself.
Landed pack cost — that price once the agreed freight, duties and other included charges are added.
Usable cycles — the cycles you can expect under your own operating conditions and retirement standard.
Flight hours per cycle — the average actual flight time you get from each usable cycle.
Put those together and the calculation is one line:
Battery Cost per Flight Hour = Landed Pack Cost ÷ (Usable Cycles × Flight Hours per Cycle)
Each input comes from a different place, and it’s worth knowing which is which:
Landed pack cost comes from the quote plus any extra charges you’ve agreed to include.
Usable cycles have to be estimated from relevant test data and your operating conditions, not read straight off a spec sheet.
Average flight hours per cycle comes from your own mission data.
What the formula returns is battery-only cost per flight hour, so it leaves out labor, downtime, maintenance and aircraft depreciation.
One input deserves a closer look, because it’s where estimates usually go wrong. Usable capacity has to match your operating protocol rather than the nameplate. Cap charging at 90% and land at 20%, for example, and the nominal SOC window is 70 percentage points — but that doesn’t mean 70% of rated energy is available for flight. If you don’t have measured energy data, use validated figures from a test or operation that matches your mission profile instead of converting an SOC percentage directly into usable flight energy.
Worked example. Say a semi-solid pack is quoted at $600 and you expect roughly 700 usable cycles, against a standard LiPo pack at $1,000 with roughly 200 usable cycles. Both give you 0.5 flight hours per cycle, both are retired at 80% capacity, and both prices already include agreed freight and duties. Running the formula gives:
Input | Semi-solid (example) | Standard LiPo (example) |
|---|---|---|
Landed pack cost | $600 | $1,000 |
Usable cycles | 700 | 200 |
Flight hours per cycle | 0.5 | 0.5 |
Battery-only cost per flight hour | $1.71 | $10.00 |
Every figure in your own comparison should trace back to the same three inputs, which is why it’s worth keeping the arithmetic visible rather than trusting a headline number.
The assumptions are deliberately round numbers for illustration, not quotes from any real product, and no C-rate or depth of discharge is attached to the cycle figures. They demonstrate the method; they aren’t evidence that semi-solid is generally more economical than LiPo.
What happens if the cycle-life advantage is weaker than the example implies? Drop the semi-solid pack to 400 usable cycles, leave everything else unchanged, and its cost rises to $3.00 per flight hour — still below the LiPo’s $10.00 on these particular assumptions. If the usable cycle-life advantage is smaller than expected, recalculate rather than assume the premium will pay back.
When does a semi-solid battery make economic sense?
A semi-solid pack becomes more economical when its battery cost per flight hour is lower than the alternative under comparable operating conditions. If both packs deliver the same flight hours per usable cycle, the comparison simplifies to landed pack cost divided by usable cycles; if flight time per cycle differs, stay with the full cost-per-hour formula instead. When the simplification applies, the break-even rule is arithmetic rather than a judgement call: a price premium requires a proportionally higher usable-cycle count to reach the same battery cost per flight hour.
The comparison can change if a pack loses usable capacity before reaching its rated cycle count. If voltage sag or another performance limit forces earlier retirement, the cost per flight hour will be higher than the original estimate, and the premium you paid for extra cycles only pays back if the pack lives long enough to use them. Usable cycles are not the only limit on service life, either: a pack stored for long periods, particularly in the heat and near full charge, can lose usable life without flying many cycles, and a program that ends or an airframe that is retired can leave remaining cycle life with no use in the project.
Cycle counts measured under different missions, temperatures or discharge loads are not directly comparable, so hold the mission constant before you compare the numbers.
What should buyers verify before comparing battery costs?
Before comparing two quotes, request the following information in writing. If a supplier cannot provide a key input, record it as an uncertainty rather than treating the quoted figure as verified.
The exact product and quote scope. Which cell or pack model, revision and batch the figures refer to, and whether the price covers the pack alone or the charger, tooling and freight. This confirms the two quotes describe comparable hardware and comparable scope.
The cycle-life test conditions. A one-cycle definition, the SOC window with voltage cutoffs, the charge and discharge C-rates, the cell and ambient temperature, and the cooling method. How to read and verify a cycle-life test report shows what a compliant protocol discloses. Check whether two cycle counts came from the same conditions before you put them in the same formula.
The end-of-life criterion. Whether the endpoint is 80% or 70% of rated capacity or a power/state-of-health threshold, whether calendar ageing and standby time were included, and whether the test covered a cell, module or full pack with the actual BMS, contactors, cooling and enclosure. Both quotes need to stop at the same threshold for the comparison to hold.
Your own mission data. The cycle count your charge-and-land protocol actually delivers, and the flight hours per cycle you actually average. These two numbers come from you, not the supplier, and they are what convert a pack price into a cost per flight hour.
Warranty and replacement terms. Whether the warranty uses the same end-of-life definition and operating conditions as the published cycle-life claim. Ask this to see whether the headline rating reflects the conditions under which a replacement is actually covered.
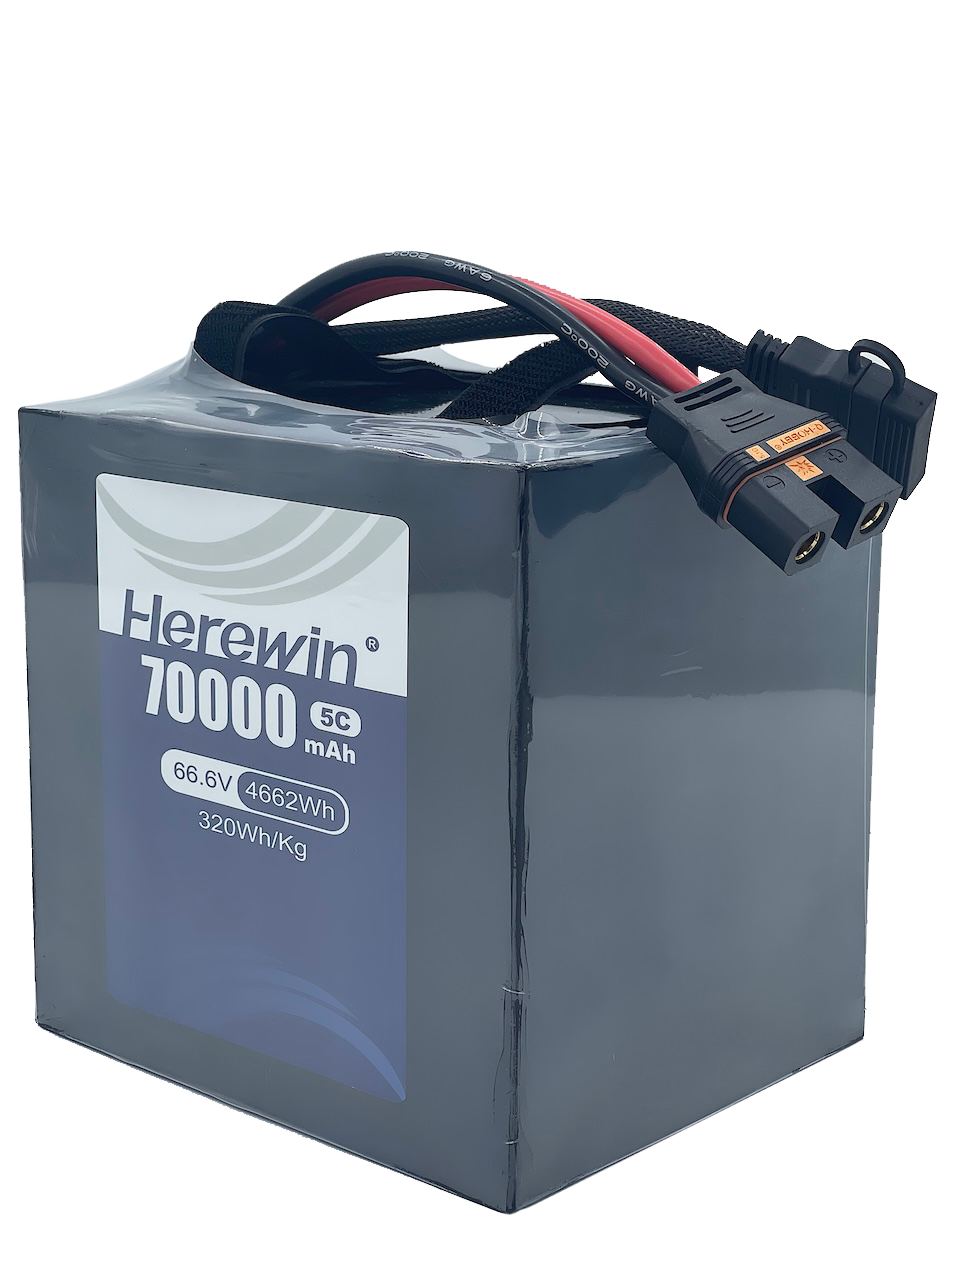
We apply the same standard to our own data at Herewin. Because our cells and packs are produced in-house, we can share the test conditions behind the cycle-life figures on our datasheets — and those figures belong in the formula only once they line up with your scope, your operating window and your retirement standard.
PERTANYAAN YANG SERING DIAJUKAN
How do I convert a battery quote into cost per flight hour?
Divide landed pack cost by usable cycles multiplied by average flight hours per cycle. Use the cycle count and average flight time supported by your actual operating data, not nameplate figures.
How many cycles does a semi-solid battery last?
There is no general figure, because it depends on the test conditions. Ask a supplier for the source, the product a quoted range applies to, and the test report behind it before using the number in any comparison.
Does transport and compliance affect the cost comparison?
Yes, if it changes the landed pack cost or the assumed cycle life. Shipping lithium cells and packs carries regulatory and handling requirements, and those charges may sit outside the pack quote. Declared capacity and shipping mode can also be set against a different rating than the one you use in the air. Treat transport and compliance as part of the landed cost, and confirm both quotes are measured on the same scope before comparing them.
Can a semi-solid battery be retired before its cycle count is used?
Yes. A pack stored for long periods, particularly in the heat and near full charge, can lose usable life without clocking many cycles. Check the warranty’s storage and calendar-life provisions alongside its cycle-life rating.
The defensible comparison is built from landed pack cost, usable cycle life and average flight hours per cycle under conditions your operation can actually reproduce. Get those three inputs from both suppliers, test them against your own mission data, and recalculate whenever an assumption changes. For a closer look at the chemistry and integration differences that may affect a replacement decision, see our semi-solid vs LiPo drone battery guide.




 Bahasa Indonesia
 English
 Español
 한국어
 Deutsch
 Français
 日本語
 Русский
 ไทย
 العربية
 Português do Brasil
 Italiano
 Nederlands