














A lithium battery can lose some voltage while sitting unused. That does not automatically mean the battery is defective.
The question that actually matters is whether the change you are seeing is normal relaxation, expected self-discharge, or a sign of abnormal leakage. A battery engineer, an integrator, or a procurement specialist who can answer that question correctly makes faster, safer sourcing and field decisions. This guide gives you a repeatable way to tell the difference — starting with the trend, not a single reading.
Why Does a Lithium Battery Lose Charge When Not in Use?
Two distinct things can drain a battery that is sitting idle, and it is worth keeping them separate because they point to different fixes.
Electrochemical self-discharge (cell level). Inside every lithium cell, slow parasitic reactions consume a small amount of stored charge even when no current is drawn. This is built into the chemistry — a healthy lithium-ion cell loses charge over time on its own. It is not a defect; it is baseline behavior that every manufacturer designs around.
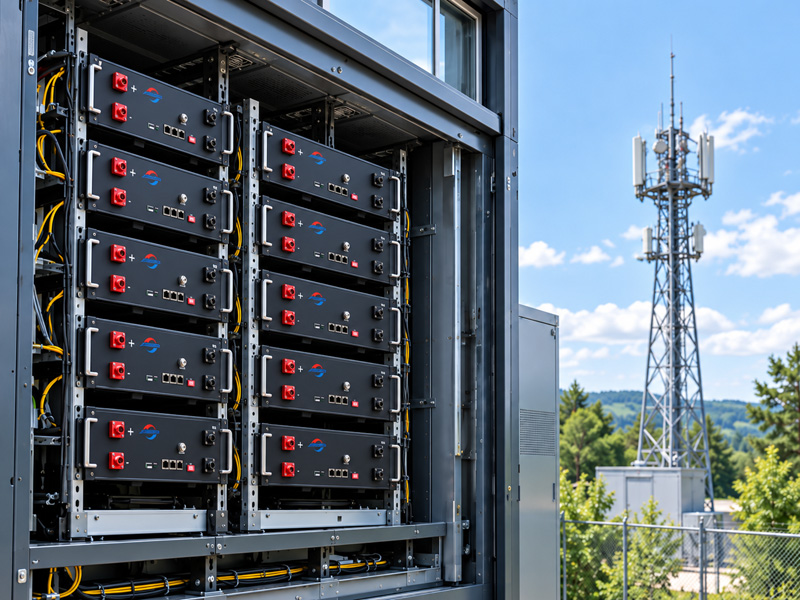
Standby consumption (pack level). A complete battery pack is more than its cells. The BMS, a Bluetooth module, a display, balancing circuitry, and any other always-on electronics draw a small quiescent current from the pack whenever it is connected. When a “battery” loses charge while idle, this electronics draw is often the real culprit — not the cells.
As a rough reference, standby current varies widely by design: an industrial-grade BMS with a low-power controller can hold its quiescent draw to roughly 5–20 µA in sleep mode, a general consumer protection board typically sits around 50–100 µA, and a feature-rich BMS with Bluetooth, live level display, active balancing, and temperature alerts can draw several times more than a basic board. These are design-inherent losses — stable and predictable — and they do not mean the cells themselves are defective.
Before you blame the cell, ask whether you are looking at a bare cell or a full pack. If it is a pack, the BMS and connected electronics can drain it even when every cell is healthy.
Is a Voltage Drop After Charging Normal?
When a cell comes off the charger, its electrode surface holds extra charge that hasn’t fully diffused into the bulk material. Over the next minutes to hours, that charge relaxes and the terminal voltage settles to a lower open-circuit voltage — OCV relaxation. It is a settling effect, not energy permanently lost.
That is why a proper self-discharge test waits for the cell to relax before recording the reference voltage: measuring the baseline too early makes a healthy cell look like it has a self-discharge problem.
Normal Self-Discharge vs. Abnormal Voltage Drop: A Judgment Framework
The goal is not to memorize one number. It is to place what you observe into a clear band — and to treat those bands as relative to your application, not as fixed industry thresholds. What counts as “normal” in one chemistry, SOC, or storage profile can be a red flag in another, so read every row as a comparison against reference behavior under the same conditions.
Consistent with Reference | Needs Investigation | Stop Use / Isolate |
|---|---|---|
Small post-charge relaxation | One cell drifts faster than peers | Rapid unexplained loss with physical warning signs |
Gradual, stable drift | Growing cell-to-cell divergence | Heating while idle |
Repeatable behavior | Inconsistent self-discharge | Swelling |
No abnormal physical change | Repeated unexplained voltage fluctuations | Leakage or abnormal odor |
Similar to matched references | Unexpected pack-level drain | Suspected internal short |
Before reading the rows as red flags, it helps to fix what “normal” looks like in your own application. A healthy cell that is genuinely just self-discharging typically shows three consistent traits:
Linear, stable decay. Voltage falls evenly over time — no sudden jumps, no step changes, no cliff-like drops. At room temperature, a good cell’s daily decay is very small and highly repeatable.
A rate that fits its reference. The drift stays inside the band expected for its chemistry, SOC, and temperature. Temperature changes how fast it decays, but it does not break the linear pattern.
No extra physical signs. No warming, no swelling, no electrolyte odor, and no spontaneous voltage rebound while resting.
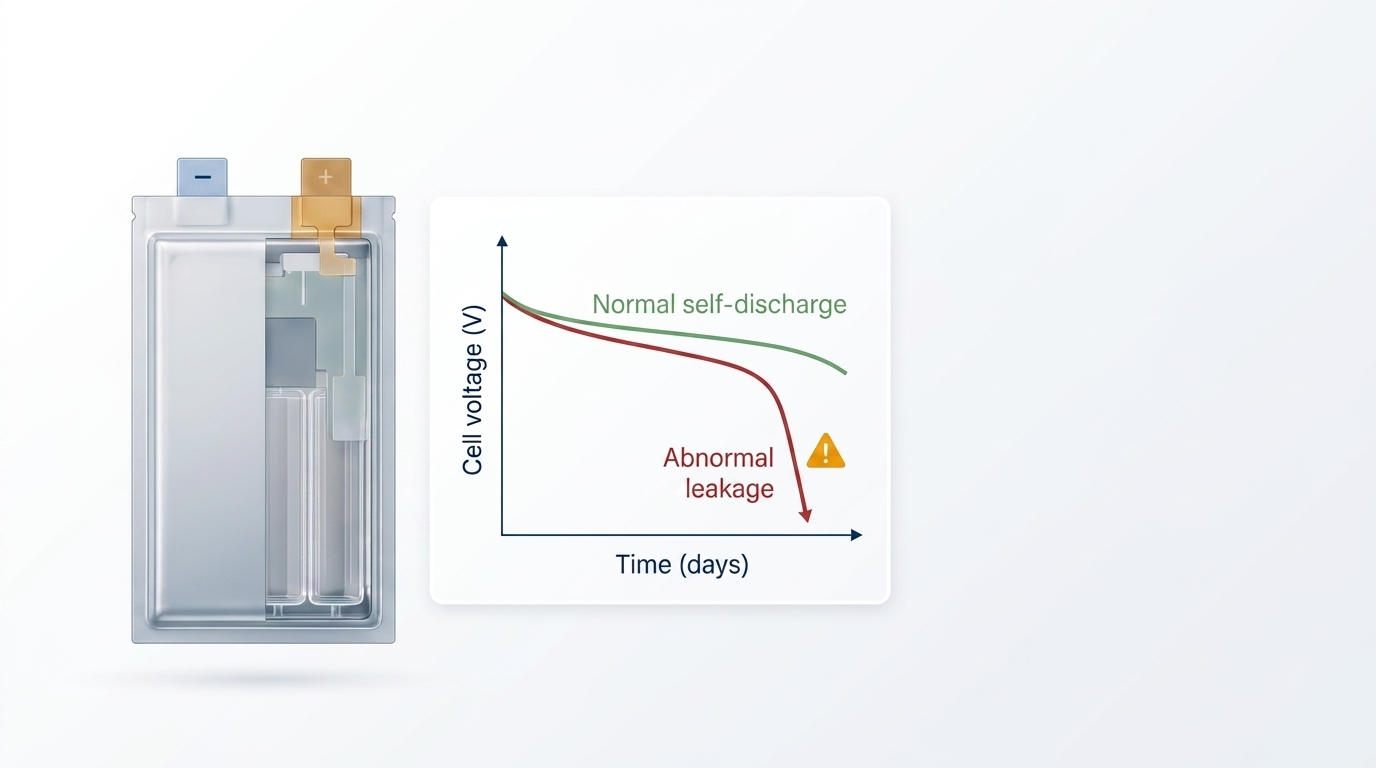
The most important habit to adopt is judging the trend across time and across cells, not a single voltage number. In a given application, a healthy cell shows a gradual, stable change compared with its reference group. A problem mostly announces itself through speed, inconsistency, or divergence from its neighbors — magnitude alone, without that comparison, is rarely enough to call it abnormal.
What Causes Abnormally Fast Battery Voltage Loss?
When a cell loses voltage much faster than its peers under identical conditions, something is creating an extra discharge path. Possible causes include:
internal leakage,
micro-short conditions,
separator or electrode defects,
contamination,
abnormal side reactions,
external leakage (pack-level), or
BMS standby consumption (pack-level).
A fast drop can be associated with any of these — but it does not tell you the root cause on its own. Micro-short is one possible cause, not the only one, and attributing it without further testing would be premature. The correct engineering move is to flag the cell for investigation, then run controlled tests to narrow down the cause rather than assume the mechanism.
Rather than treating every fast drop the same, it helps to recognize the three abnormal profiles a faulty cell tends to show:
Persistent fast decay. The voltage keeps dropping well beyond the normal band — for example, a cell that loses more than roughly 0.2 V in a single week at room temperature is losing charge far faster than a healthy one. This pattern usually points to a micro-short, which in turn traces back to processing defects such as metal dust contamination, separator micropore damage or creasing, unremoved burrs on the electrode edge, or electrode misalignment forming a tiny conductive path between the electrodes. That internal leakage current drains capacity continuously and generates Joule heat, which is why it is one of the more dangerous hidden triggers for thermal runaway.
Irregular voltage fluctuation. A healthy cell’s resting voltage only drifts slowly and smoothly. If it instead jumps up and down without a pattern, or briefly rebounds on its own, the cell is structurally unstable — often from weak tab welding, active-material shedding, unstable internal contact resistance, or localized separator failure. These disturbances internally upset charge balance and make charge/discharge voltage unstable in the field.
Gradual collapse from structural defects. Non-uniform electrode coating, inconsistent electrolyte fill, or impure raw material erodes cell-to-cell consistency. Initially it can look fine, but after storage or light cycling it shows up as cliff-like capacity loss and accelerating voltage decay that ends in premature cell failure.
A Note on Voltage Drop vs. Capacity Loss
It is tempting to see a cell fall from 4.20 V to 4.10 V and ask “how much capacity did I lose?” — but a single voltage reading does not translate cleanly into remaining capacity. The same confusion shows up during operation, where a sudden SOC drop is often voltage sag rather than real capacity loss.
Lithium-ion open-circuit voltage and state of charge are not linearly related, and the OCV-SOC curve differs by chemistry (NMC, LFP, LCO, LiHV), by temperature, and by whether the cell has fully relaxed. Two cells at the same measured voltage can hold different amounts of usable energy. So treat a small voltage change as a signal to investigate the trend, not as a directly convertible capacity number. The slow drift of voltage over time, and how consistently it behaves, is far more informative than the value at any one moment.
How to Figure Out Whether a Battery Is Actually Faulty
When a battery voltage drops while sitting, the first instinct is often “the cell is bad.” The more reliable path is to rule out the easy explanations first. Work through these steps in order.
Step 1 — Is the battery actually isolated?
Confirm there is no connected BMS, Bluetooth module, display, controller, or external load. Many “idle” packs are still draining through connected electronics.
Step 2 — Is the measurement reliable?
Check the multimeter, probes, connectors, and wiring, and use a consistent measurement interval. Meter resolution and contact quality can create false drops.
Step 3 — Compare cells under the same conditions.
In a multi-cell pack, does the whole pack fall together, or is one cell dropping clearly faster than the rest? Divergence between cells is a stronger signal than the pack average.
Step 4 — Check temperature and physical condition.
Look for abnormal heat while idle, swelling, odor, leakage, or deformation. Physical signs escalate the situation regardless of the exact voltage number.
Step 5 — Decide whether further testing is justified.
If the battery still shows abnormal behavior, move to a controlled self-discharge check or supplier investigation.
If you see rapidly unexplained voltage loss together with heating while idle, swelling, leakage, or an abnormal odor, stop using it, isolate it from other batteries and charging equipment, and do not attempt to recharge it.
How Do Battery Manufacturers Screen for High Self-Discharge Cells?
Before cells reach a pack, we use aging, storage, and electrical screening methods to identify units with abnormal self-discharge or unstable behavior. The exact test coverage, sample size, and acceptance criteria depend on the cell design and each manufacturer’s quality-control process. Keep in mind that not every quality-control step is a 100% inspection: for our own cells, we are transparent about which parameters we check on every cell and which we sample by lot, and we would encourage any buyer to ask a supplier the same. This is manufacturer validation — a production-level screen applied to the batch before assembly, distinct from the simpler pre-use check a buyer runs on received inventory. These tests share a common structure rather than a single fixed recipe:
controlled temperature,
a defined state of charge (SOC),
a defined storage or rest period,
OCV recording at set intervals,
capacity comparison, and
temperature monitoring.
Accelerated aging may use elevated temperatures under controlled conditions, but the exact profile varies by cell chemistry and by the manufacturer’s own qualification procedure. There is no single “correct” recipe that every reputable factory must follow — the value is in the controlled, documented method.
To give that same idea some scale: OCV screening across a production lot commonly checks batch-to-batch consistency around the ±10 mV level, watches for a single cell’s OCV drifting much more than about 2 mV over a week of storage, and flags any unit that falls well outside the lot — for example, more than roughly 20 mV off — as abnormal. Aged screening windows also tend to fall in a similar band across reputable factories, commonly around 45–55 °C for roughly 72–168 hours. Always confirm the exact temperature, storage time, SOC, and acceptance criteria with your supplier rather than assuming one recipe applies.
What you want to evaluate is consistency across three things: the initial OCV of a batch, how OCV changes during storage, and whether cell-to-cell differences widen over time. That last point — whether divergence grows — can be an especially useful early signal of a cell that is behaving differently from the rest of the batch. Because we run our own cell and pack plants in China, Vietnam, and Africa, we keep this screening routine aligned across facilities, so a batch from one site behaves like a batch from another — the kind of lot-to-lot consistency we want buyers to be able to verify.
What Battery Buyers Should Ask Their Supplier About Self-Discharge
Here is where the diagnostic mindset turns into a sourcing decision. Instead of accepting a single percentage, ask for the conditions behind it and the consistency across the lot.
Question | Why It Matters |
|---|---|
What is the tested self-discharge rate? | Reveals long-term storage behavior |
At what temperature was it tested? | Temperature strongly affects results |
What was the starting SOC? | SOC changes how OCV behaves |
How long was the storage test? | Short tests can miss slow leakage |
How is OCV recorded? | Ensures the data is comparable |
How are cells matched? | Prevents weak cells entering a pack |
What is the BMS standby current? | Critical for complete battery packs |
What happens when a cell fails screening? | Shows the supplier’s quality-control process |
How many cells were sampled per lot? | A small sample can miss subtle defects |
Can you share lot-level data across batches? | Reveals production consistency over time |
What acceptance criteria are cells held to? | Defines the boundary between pass and fail |
Ask for evidence, not just a claim. A credible supplier can share its cell acceptance criteria, matching parameters, and lot data — for example the OCV, capacity, and internal-resistance deltas it holds cells to before assembly, and we will share ours on request. Pay equal attention to sample size (how many cells per lot the screen actually covered) and to production consistency (whether downstream lots deliver the same distribution, not just one good batch). A documented sample across multiple lots provides a more useful view of production consistency than a single self-discharge percentage quoted in isolation — which is why cell-acceptance decisions rely on OCV, capacity, and impedance deltas checked across representative production samples rather than one headline rate.
How to Test Battery Self-Discharge Before Using a Cell or Pack
If you receive cells or packs and want a user screening before use, run a controlled OCV relaxation spot-check. This is deliberately simpler than manufacturer qualification: it verifies the units you actually hold against a reference, rather than re-qualifying the whole production line. This is a screening check, not a substitute for manufacturer qualification or safety testing. Use the same procedure consistently and compare every unit against known-good matched cells under identical conditions.
Only perform this check on cells that have passed basic visual, electrical, and safety inspection and are considered safe to charge under the manufacturer’s procedure.
Fully charge the cell under the specified procedure.
Record initial OCV, SOC, and temperature.
Disconnect all external loads.
Store under controlled temperature and SOC conditions.
Record voltage at defined intervals (allowing relaxation before each reading).
Compare the result with matched cells stored under the same conditions.
Investigate any abnormal cells before further use.
The key discipline is measuring the change over time against a proper reference, rather than reacting to a single voltage value. For incoming inventory, this kind of screening can help flag cells that behave differently from the rest of the lot before they enter a pack — while full production-lot qualification remains part of the manufacturer’s quality-control process, which is why the data you request from a supplier matters just as much as any test you run yourself.
When Should a Cell or Battery Pack Be Removed from Service?
Remove a cell or battery pack from service and isolate it when you see:
rapid, unexplained voltage loss,
abnormal heat while idle,
swelling,
leakage or residue,
an abnormal odor, or
a large, growing cell-to-cell imbalance.
None of these should be ignored. Stop use, isolate the pack from other cells and from charging, and inspect or replace it.
How to Reduce Self-Discharge During Storage
Storage conditions shape how much charge a battery loses and how evenly cells drift:
avoid prolonged high-temperature exposure,
avoid unnecessary full-charge (100% SOC) storage,
follow the manufacturer-recommended storage SOC,
monitor stored batteries periodically, and
separate any battery that shows abnormal self-discharge.
Keeping a pack at a moderate storage SOC and stable temperature slows calendar aging and keeps cell divergence under control. Storage practices do not eliminate intrinsic self-discharge; they mainly help limit additional loss and calendar aging caused by unfavorable temperature and SOC conditions. If you are setting storage procedures at a depot or fleet level, aligning them with the recommended storage SOC for your chemistry is a practical starting point.
الأسئلة الشائعة
Does a lithium-ion battery lose charge when not in use?
Yes. All lithium-ion cells self-discharge slowly at open circuit, and a full pack also drains through BMS and electronics.
How fast should a lithium battery lose charge?
For many commercial lithium-ion cells under controlled room-temperature storage, self-discharge is relatively low and is often discussed in terms of a few percent per month. However, this is not a universal acceptance limit and must be interpreted together with chemistry, SOC, temperature, storage time, and test method.
Why does my lithium battery voltage drop while sitting?
It can be OCV relaxation after charging, gradual self-discharge, electronics/standby consumption in a pack, or — if unusually fast or escalating — abnormal leakage. Check the trend and the test conditions before concluding it is a fault.
Is a 0.1V drop in a lithium battery normal?
There is no single number that answers this. A 0.1V drop is judged by context — how quickly it happened, whether the cell was resting, the chemistry, and how it compares with peers under identical conditions. Read it as a signal to check the trend across time and across cells, not as a pass-or-fail figure on its own.
How do you test lithium battery self-discharge?
Use a controlled OCV relaxation test: charge to a defined SOC at a set temperature, let the cell relax, record a baseline OCV, store under controlled conditions, and re-measure over time — comparing the change to matched cells.
Can a high self-discharge cell cause battery failure?
An abnormally high self-discharge cell can pull down a series pack and increase cell imbalance. If the abnormal behavior is accompanied by heat or other physical warning signs, the cell should be removed from service and investigated.
Does a BMS drain a battery when it is not being used?
Yes. A BMS and any connected electronics draw a small quiescent current, which is one reason a full pack loses charge faster than a bare cell.
Reliable self-discharge decisions come down to supplier qualification. For OEMs and integrators, the practical question is not simply whether a supplier quotes a low self-discharge rate. It is whether the supplier can show how that number was measured, how cells are matched, and whether the same quality holds across production lots.
Herewin works with OEMs and integrators on joint validation, sharing test conditions, OCV records, cell-matching parameters, and cell acceptance criteria so you can assess consistency across lots before committing to a design.







 العربية
  English
  Español
  한국어
한국어  Deutsch
  Français
  日本語
日本語  Русский
  Bahasa Indonesia
  ไทย
ไทย  Português do Brasil
  Italiano
  Nederlands