














During flight testing or heavy-payload missions, UAV OEM engineering teams frequently encounter a concerning fault: the battery State of Charge (SOC) drops precipitously without warning. A drone launching with an indicated 90% SOC can suddenly display 30% or trigger an automated low-voltage Return-to-Home (RTH) alarm within seconds of a hard takeoff, climb, or wind-gust response.
When flight crews land the aircraft and inspect the pack, they often observe an immediate rebound: the terminal voltage recovers, the displayed SOC climbs back up, and bench testing reveals no permanent cell rupture. Attributing this phenomenon strictly to a “failed battery” leads many engineering teams down expensive teardown rabbit holes. In reality, a sudden in-flight SOC drop is usually a system-level mismatch between dynamic load currents, terminal voltage sags, compartment thermal effects, cell internal resistance escalation, and BMS estimation algorithms.
This engineering guide breaks down the physical mechanisms behind dynamic SOC collapse, provides a structured diagnostic framework for flight test engineers, and outlines practical design choices for UAV original equipment manufacturers (OEMs).
A Sudden In-Flight SOC Drop Does Not Always Mean Battery Hardware Failure
State of Charge (SOC) measures the remaining usable capacity of a battery pack against its nominal rating. It is the single most critical input for flight time prediction, power allocation, and Return-to-Home (RTH) failsafes. Unlike consumer devices operating under predictable currents, industrial UAV power systems face rapid throttle bursts, wide temperature swings, and severe environmental stress. Because of these dynamic conditions, SOC is never a simple static energy counter—it is a calculated state inferred by the BMS using real-time voltage, current, internal resistance, and thermal inputs.
When an aircraft suddenly reports an SOC collapse, flight crews often assume the battery is physically damaged, leaking, or degraded. However, true chemical or mechanical defects display permanent capacity loss or monotonic decay—they rarely cause sharp, self-recovering drops. Most in-flight SOC collapses are system-level mismatches between the pack’s transient electrical behavior and the BMS’s static estimation lookup tables.
When evaluating in-flight SOC anomalies, engineers should distinguish between two fundamental conditions:
Genuine Chemical Power Depletion: Physical defects like internal short circuits, electrolyte leakage, or permanent cell isolation cause true capacity loss with non-recovering failure signatures.
Dynamic Estimation Discrepancy: A load-induced SOC anomaly tightly correlated with high-power maneuvers (takeoff, climb, payload activation, wind gust response) that displays a natural voltage and SOC rebound once the motors disengage and sit idle at rest.
If the SOC reading recovers after the electrical load is removed, the event is driven by load-dependent voltage sag, thermal shifts, and BMS estimation algorithms rather than permanent chemical destruction.
Understanding this distinction requires separating Open Circuit Voltage (OCV) from Loaded Terminal Voltage. OCV reflects the true thermodynamic state of charge when a battery is at equilibrium with zero current flowing. However, flight controllers and BMS hardware can only directly measure terminal voltage under live load. When high current demands pull the terminal voltage down through internal impedance and polarization, voltage-sensitive estimation models can misinterpret this transient drop as an apparent loss of usable energy.
What Causes Drone Battery SOC to Drop Under Dynamic Flight Loads?
To isolate why an SOC reading collapses during flight, engineers must evaluate four interacting factors across the electrochemistry, thermal environment, and BMS software stack:
High Load Current Burst (3C–10C): Drives instant ohmic drop (I * R_DC) and rapid voltage sag.
Internal Resistance (DC-IR) Rise: Causes deeper terminal voltage dips under identical loads.
Thermal Soak & Ambient Temperature: Shifts internal impedance and voltage response curves.
BMS Estimation Drift: Triggers artificial SOC jumps due to uncompensated voltage corrections.
High Current Spikes and Loaded Terminal Voltage Sag
Unlike ground electric vehicles that operate under relatively smooth power demand profiles, commercial multirotors and VTOL platforms experience extreme current dynamics. Cruising may draw 0.5C to 1C, but takeoff, climb, or maneuvering bursts can instantly demand 3C to 8C—with peak pulses exceeding 10C.
Under Ohm’s Law, drawing high current (I) through the battery’s internal DC resistance (R_DC) generates an immediate internal voltage drop. The effective loaded terminal voltage (V_term) is governed by:
V_term = E_ocv – (I * R_DC) – eta_polarization
E_ocv is the true Open Circuit Voltage of the cells.
I * R_DC is the instant ohmic voltage drop across cell tabs, internal foils, pack busbars, and BMS MOSFETs.
eta_polarization represents electrochemical and concentration polarization losses that build up over continuous discharge.
When current spikes, V term sags sharply. If the BMS relies heavily on terminal voltage thresholds to correct its SOC calculation, it interprets this loaded voltage drop as a collapse in E ocv, instantly forcing the display SOC downward.
Internal Resistance Escalation and Cell Aging
A factory-new lithium pack exhibits minimal DC internal resistance (R_DC). However, as cells undergo charge-discharge cycling, internal resistance naturally increases due to electrochemical aging.
When an aged battery with elevated R_DC experiences a high-power acceleration burst, the resulting I * R_DC voltage sag is significantly deeper than in a fresh pack. If the BMS software continues using factory-new lookup tables, it cannot distinguish between “a fresh battery under heavy load” and “an aged battery reaching empty,” leading to severe estimation jumps.
Always track DC internal resistance (mΩ) per cell during routine maintenance rather than relying solely on nominal mAh capacity. An aged pack may still retain acceptable measured capacity during a controlled low-rate bench discharge while performing poorly under high-C flight demands due to R_DC growth.
Thermal Soak and Temperature-Driven SOC Instability
The thermal environment inside a UAV fuselage directly alters battery output and electrochemical impedance through two distinct mechanisms:
Cold Ambient Conditions: Operating in low ambient temperatures elevates electrolyte viscosity and slows lithium-ion diffusion, causing R_DC to spike. A cold battery experiences severe voltage sag on takeoff, frequently triggering low-voltage cutoffs during initial climb.
Thermal Soak in Enclosed Compartments: UAV battery thermal environments involve dual heat sources: external aerodynamic friction, solar radiation, and structural conduction; plus internal Joule heat (I2 R) and electrochemical polarization heat generated during high-rate discharge. Thermal soak occurs when heat generated inside a sealed battery bay cannot dissipate effectively, continuously accumulating and penetrating into the cell core. Unlike short-term transient temperature spikes, thermal soak exhibits three distinct characteristics: time lag, persistence, and accumulation.
During prolonged high-load missions, internal bay temperatures can sustain steady high-temperature states between 45°C and 65°C, completely deviating from standard 25°C laboratory calibration baselines. This elevated thermal environment alters electrochemical behavior in two phases:
Initial Phase: Elevated temperature temporarily increases electrolyte conductivity and speeds up reaction kinetics, slightly reducing polarization voltage drop.
Sustained Thermal Soak: Prolonged exposure to 45°C–65°C promotes parasitic side reactions at the electrode-electrolyte interface and accelerates SEI (Solid Electrolyte Interphase) layer growth. This causes internal impedance to surge rapidly and temporarily suppresses effective discharge capacity.
Because standard BMS calibration tables assume a static 25°C baseline without dynamic thermal soak compensation, the accelerated terminal voltage decay under load causes the BMS model to miscalculate remaining capacity, triggering a precipitous SOC drop. Once the aircraft lands and cools to room temperature, interface side reactions pause, internal resistance normalizes, and displayed SOC automatically rebounds.
BMS SOC Estimation Algorithms and Calibration Deviation Factors
Modern smart UAV batteries with built-in BMS calculate SOC using a multi-parameter fusion model that combines Coulomb Counting, Open Circuit Voltage (OCV) Calibration, and Temperature Compensation Coefficients:
Coulomb Counting integrates real-time current over time to track capacity consumption. It delivers high short-term precision during steady cruising but accumulates integration drift over time.
OCV Calibration uses pre-mapped OCV-SOC lookup curves to periodically recalibrate and correct coulomb counting integration errors.
Temperature Compensation adjusts capacity calculations based on ambient and cell temperature sensors.
When real-world flight conditions diverge from factory bench assumptions, the estimation model breaks down, triggering sudden SOC jumps. Three specific calibration gaps cause these errors:
Cell Aging and Parameter Mismatch: As batteries undergo charge-discharge cycles, actual capacity decays, DC internal resistance (DC-IR) increases, and polarization characteristics shift. If the BMS firmware continues using factory-new baseline lookup tables without adaptive aging updates, the model cannot match the cell’s true voltage-capacity relationship during high-load or high-temperature events.
Sensor Sampling Drift and EMI Noise: High-voltage motor pulses and Electronic Speed Controller (ESC) switching generate intense electromagnetic interference (EMI). Combined with sensor component thermal aging, this induces current sensor zero-point drift and voltage sampling noise. Microscopic current errors compound through coulomb integration, while voltage sampling offsets misalign the OCV lookup interval, distorting the SOC estimation.
Algorithm Model Limitations under Dynamic Flight Loads: Commercial BMS algorithms designed primarily for steady-state, low-rate ground profiles lack dynamic fitting for high-rate pulse loads, rapid compartment heating, and thermal soak. The static algorithms fail to model polarization hysteresis and post-load voltage rebound, causing uncompensated corrections that trigger instant SOC collapses during load spikes.
How to Diagnose the Real Cause of an In-Flight SOC Drop
When an aircraft experiences an unexpected SOC collapse, field technicians and flight test engineers need a repeatable diagnostic procedure to isolate hardware faults from algorithm artifacts.
UAV Flight SOC Diagnostic Matrix
Observed Flight Symptom | Likely Underlying Cause | Verification & Diagnostic Check |
|---|---|---|
SOC drops during takeoff/climb; rebounds after landing | Load-induced voltage sag (I * R_DC) & uncompensated BMS voltage correction | Check flight logs for current correlation; measure cell R_DC; verify BMS load-compensation parameters. |
SOC drops smoothly until 50%, then plummets rapidly | Cell resistance imbalance or mismatched OCV-SOC lookup curve | Perform individual cell voltage logging under load; identify if a single cell exhibits deeper sag. |
SOC drops rapidly only in cold ambient weather | High electrolyte impedance due to low temperature | Measure pre-flight pack temperature; test with pre-heated battery enclosure. |
SOC drops steadily, but actual flight time is significantly reduced | True electrochemical capacity degradation (SOH decay) | Conduct a standard constant-current bench discharge down to cut-off voltage under controlled temperature. |
SOC display fluctuates erratically during steady hover | Current sensor zero-point drift or EMI noise on BMS telemetry bus | Check sensor calibration; inspect CAN/SMBus cable shielding against motor/ESC power lines. |
Step-by-Step Engineering Diagnostic Workflow
When diagnosing an in-flight SOC drop event, engineering teams should follow a structured 5-step workflow:
Step 1: Current Profile Correlation
Export flight telemetry logs (current, voltage, motor RPM, flight mode). Overlay the SOC drop curve directly onto the total current timeline. If every steep drop in SOC aligns precisely with a peak current pulse, the primary mechanism is load-induced voltage sag rather than sudden cell failure.
Step 2: Individual Cell Voltage Spread Analysis
Inspect cell-level telemetry data during high-thrust maneuvers. In a healthy pack, all cells sag uniformly within a narrow window. If a single cell sags substantially deeper than others, that specific cell suffers from higher internal resistance or capacity degradation, pulling down the entire pack’s reported SOC.
Step 3: Thermal Tracking
Analyze battery internal temperature logs alongside SOC data. Check whether SOC instability accelerates as battery compartment temperature rises or if it occurs while internal cell temperatures remain un-preheated in cold weather.
Step 4: Post-Landing Voltage Recovery Evaluation
Record resting cell voltages immediately after load removal and again after a defined rest period. A significant recovery delta confirms that the in-flight SOC dip was driven by dynamic load impedance rather than exhausted chemical capacity.
Step 5: Standard Bench Capacity Verification
Bench capacity testing is necessary but insufficient. Place the suspect pack in a temperature-controlled laboratory environment and perform a full constant-current discharge cycle.
If delivered capacity matches nominal specifications but flight issues persist, the battery chemistry is intact, but its high-current R_DC or BMS calibration is unsuitable for the flight load profile.
If delivered capacity is severely depressed even at low discharge rates, the cell hardware has reached end-of-life.
Engineering Solutions to Prevent SOC Instability in UAV Battery Systems
Resolving in-flight SOC jumps requires an integrated approach across three main engineering pillars:
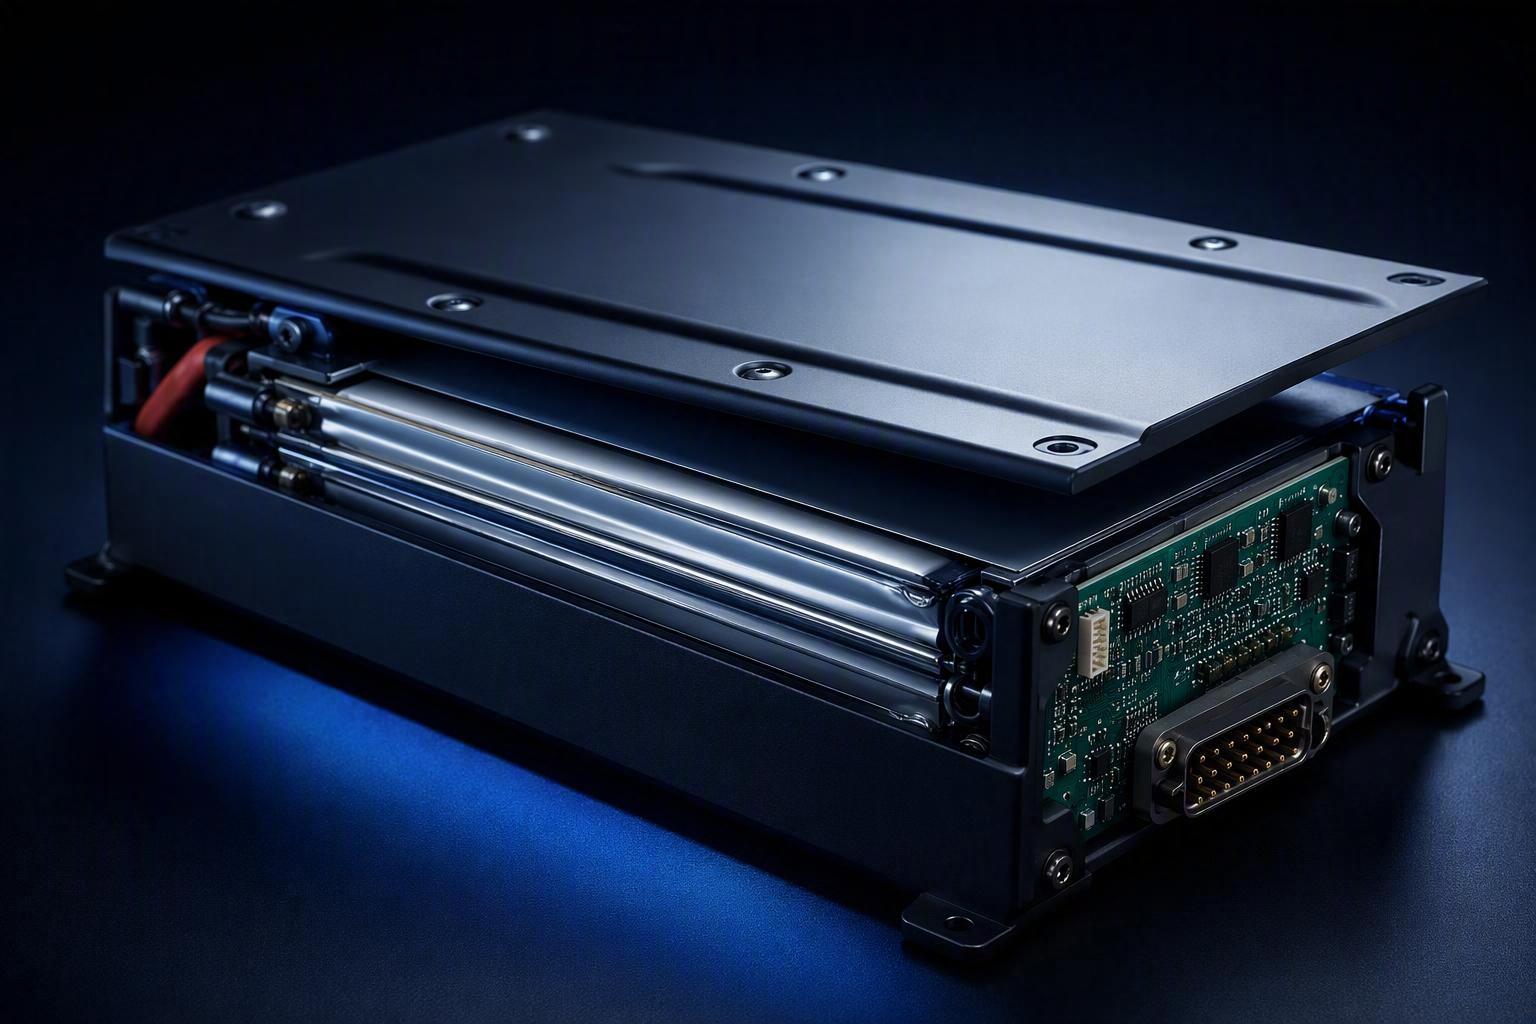
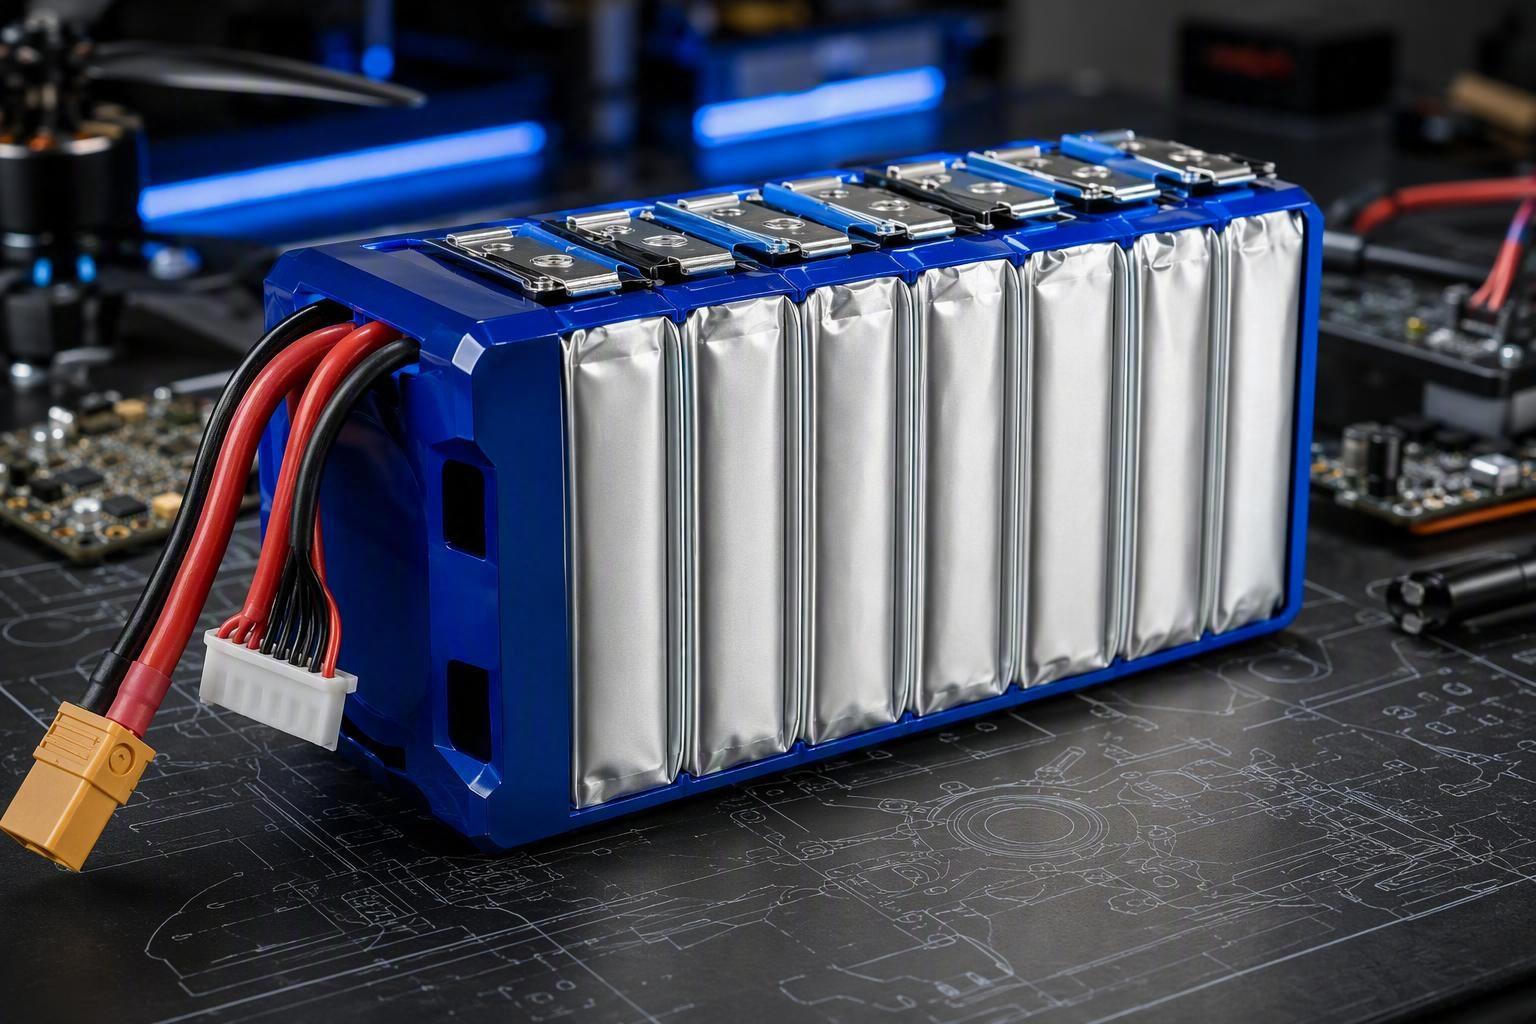
Cell & Pack Design: Specify ultra-low DC-IR cells, soft-pack architectures, and co-laminated copper busbars.
Thermal Management: Design active air cooling channels, thermal insulation for cold environments, and core temperature sensors.
BMS & Telemetry Integration: Implement dynamic I * R compensation, delayed low-voltage threshold filtering, and standardized CAN/SMBus telemetry protocols.
Low DC-IR Cell Selection and Soft-Pack Architecture
Preventing voltage sag begins at the electrochemistry and interconnect level. Standard commercial energy-density cells prioritize high nominal capacity at the expense of internal resistance. For industrial multirotors and VTOLs, OEMs must specify high-rate pouch or prismatic cells engineered for low DC internal resistance and low interconnect impedance.
Utilizing specialized soft-pack UAV battery architectures lowers overall pack DC-IR, directly reducing the I * R_DC voltage drop during maximum throttle bursts.
Compartment Thermal Management and Heat Dissipation
To mitigate thermal soak and extreme cold impacts:
For High-Temperature Environments: Incorporate forced convection channels or phase-change thermal conductive pads within the battery bay to vent Joule heat generated by high continuous discharge.
For Cold Weather Operations: Integrate self-heating BMS circuits or insulated thermal wraps that maintain internal cell core temperatures between 20°C and 25°C prior to takeoff.
Smart BMS Calibration and Telemetry Integration
The BMS acts as the central intelligence hub of the UAV power architecture, continuously processing multi-cell electrical parameters, thermal states, and SOC/SOH estimates to regulate power limits, thermal management, and closed-loop flight protection. Calibration defects in BMS parameters are a primary engineering cause of artificial SOC drops. Common UAV calibration gaps include fixed resistance parameters, narrow temperature compensation bands, missing high-rate discharge compensation coefficients, improperly tuned polarization response delays, lack of voltage rebound smoothing strategies (leaving displayed SOC stuck at low values long after load removal), and overly conservative protection thresholds that force precipitous SOC refreshes during routine maneuvers.
Resolving dynamic SOC jumps requires targeted firmware optimization and flight-profile-matched calibration:
Dynamic Voltage & Load Compensation: Configure the BMS algorithm to compute
V_comp = V_measured + (I * R_DC_est)prior to voltage-based SOC corrections, neutralizing transient ohmic sag.Voltage Rebound Smoothing & Polarization Hysteresis Filtering: Implement hysteresis filters and post-load recovery algorithms to accurately track cell voltage rebound after disengaging high-thrust maneuvers, preventing artificial low-battery lockouts.
High-Rate & Wide-Temperature Compensation Tables: Expand BMS calibration matrices to cover thermal soak ranges (45°C–65°C) and high-rate pulse discharge (3C–10C), providing realistic capacity models during severe operational profiles.
Transient Low-Voltage Filter Delays: Implement programmable trip delays (e.g., filtering out transient voltage dips lasting under 2 to 3 seconds) to prevent short pulse spikes from triggering premature Return-To-Home (RTH) alarms.
Adaptive Aging & Resistance Tracking: Ensure the BMS algorithm periodically updates cell internal resistance (
R_DC) and available capacity baselines based on cycle history, maintaining model accuracy over the battery lifecycle.Robust Flight Controller Communication: Stream real-time cell-level voltages, current, estimated internal resistance, and diagnostic flags to the flight control computer via standardized smart BMS telemetry protocols (CAN bus or SMBus).
Never disable low-voltage protection thresholds in the flight controller to bypass voltage sag. Disabling protection risks driving cells into deep over-discharge during forced maneuvers, leading to permanent cell damage or sudden mid-air power loss. Instead, implement dynamic load-compensated thresholds.
What UAV OEMs Should Validate Before Choosing a Battery Partner
For UAV OEMs and system integrators, preventing in-flight power instability requires evaluating battery suppliers on complete system integration capabilities rather than static datasheet specifications (like nominal mAh or C-ratings).
When specifying a custom power system, OEM engineering teams should mandate the following supplier validation criteria:
Mission-Specific Discharge Profiling: Test candidate battery packs using the aircraft’s actual current telemetry log (simulating takeoff bursts, hover, payload activation, and landing climb) rather than steady-state bench discharge.
Thermal Soak Characterization: Measure cell core temperature rise and terminal voltage sag inside a physical mockup of the aircraft’s battery compartment under maximum ambient operating temperatures.
Cell-Level R_DC Consistency: Require documented cell-to-cell DC resistance consistency using defined test methods and strict acceptance tolerances across all series-connected cells.
BMS Protocol & Firmware Customization: Confirm that the battery supplier supports custom CAN/SMBus telemetry registers, adjustable voltage-compensation tables, and field-updatable BMS firmware.
Partnering with an engineering-led manufacturer capable of providing custom UAV battery pack engineering ensures that the electrochemistry, pack mechanical architecture, and BMS firmware are fully tuned to your aircraft’s specific flight profile.
FAQ
Can a UAV battery pass bench testing but still show SOC instability in flight?
Yes. Standard constant-current bench tests do not reproduce the dynamic pulse current spikes, compartment thermal soak, or ESC electromagnetic interference encountered during real flight. A battery can retain acceptable measured capacity during low-rate bench testing while suffering severe voltage sag or BMS SOC correction jumps under actual flight profiles.
Why does battery voltage and SOC recover after landing?
Once the drone lands and disengages high-thrust motors, current flow drops to zero. Removing the load eliminates I * R_DC voltage sag, allowing cell terminal voltage to bounce back to its resting Open Circuit Voltage (OCV). The BMS detects this higher resting voltage and recalibrates the displayed SOC upward.
Does a sudden in-flight SOC drop mean the battery is permanently damaged?
Not necessarily. While physical internal short circuits cause irreversible capacity loss, dynamic SOC jumps that recover upon landing are frequently impedance estimation artifacts caused by high internal resistance, cold ambient temperatures, or uncompensated BMS lookup tables.
How can UAV OEMs validate battery performance before mass production?
OEMs should test candidate battery packs against real mission current profiles (simulating takeoff, climb, and maneuver spikes) inside physical mockups of the aircraft’s battery compartment, verifying cell-level R_DC consistency and BMS telemetry compatibility under real thermal and load conditions.
Precipitous in-flight SOC drops are rarely caused by dead battery cells. Instead, they reflect a system-level breakdown where static BMS software fails to track dynamic pulse current sag, compartment thermal soak, sensor EMI drift, and uncompensated polarization recovery. The primary diagnostic indicators of this mismatch are immediate post-landing voltage rebound, tight correlation with throttle spikes, and normal bench discharge results.
Solving these estimation jumps for industrial UAV fleets requires advancing from static lookup tables toward adaptive power system architectures:
Workload-Adaptive BMS Algorithms: Replacing rigid OCV tables with real-time parameter estimation (e.g., Extended Kalman Filtering or machine learning impedance models) that tracks polarization hysteresis and dynamic DC-IR during aggressive flight maneuvers.
Closed-Loop Thermal-Electrical Control: Co-designing battery bay ventilation with flight controller power limits to prevent core temperatures from exceeding 45°C during prolonged hovers or heavy climbs.
Automated Lifecycle Calibration: Implementing fleet-level telemetry tracking that periodically updates cell degradation baselines, keeping SOC accuracy tight across hundreds of operational flight hours.
If your flight test team is investigating unexpected in-flight SOC drops, premature low-voltage triggers, or BMS estimation errors, the next step is not necessarily to replace the battery pack.
Share your platform’s operating voltage range, peak current profile, thermal constraints, and flight controller telemetry protocol with our engineering team. These parameters help evaluate whether the issue stems from cell selection, pack impedance, thermal management, or BMS integration. Herewin can support comprehensive battery and BMS integration evaluation as part of a custom UAV battery development project.






 English
  Español
  한국어
한국어  Deutsch
  Français
  日本語
日本語  Русский
  Bahasa Indonesia
  ไทย
ไทย  العربية
  Português do Brasil
  Italiano
  Nederlands