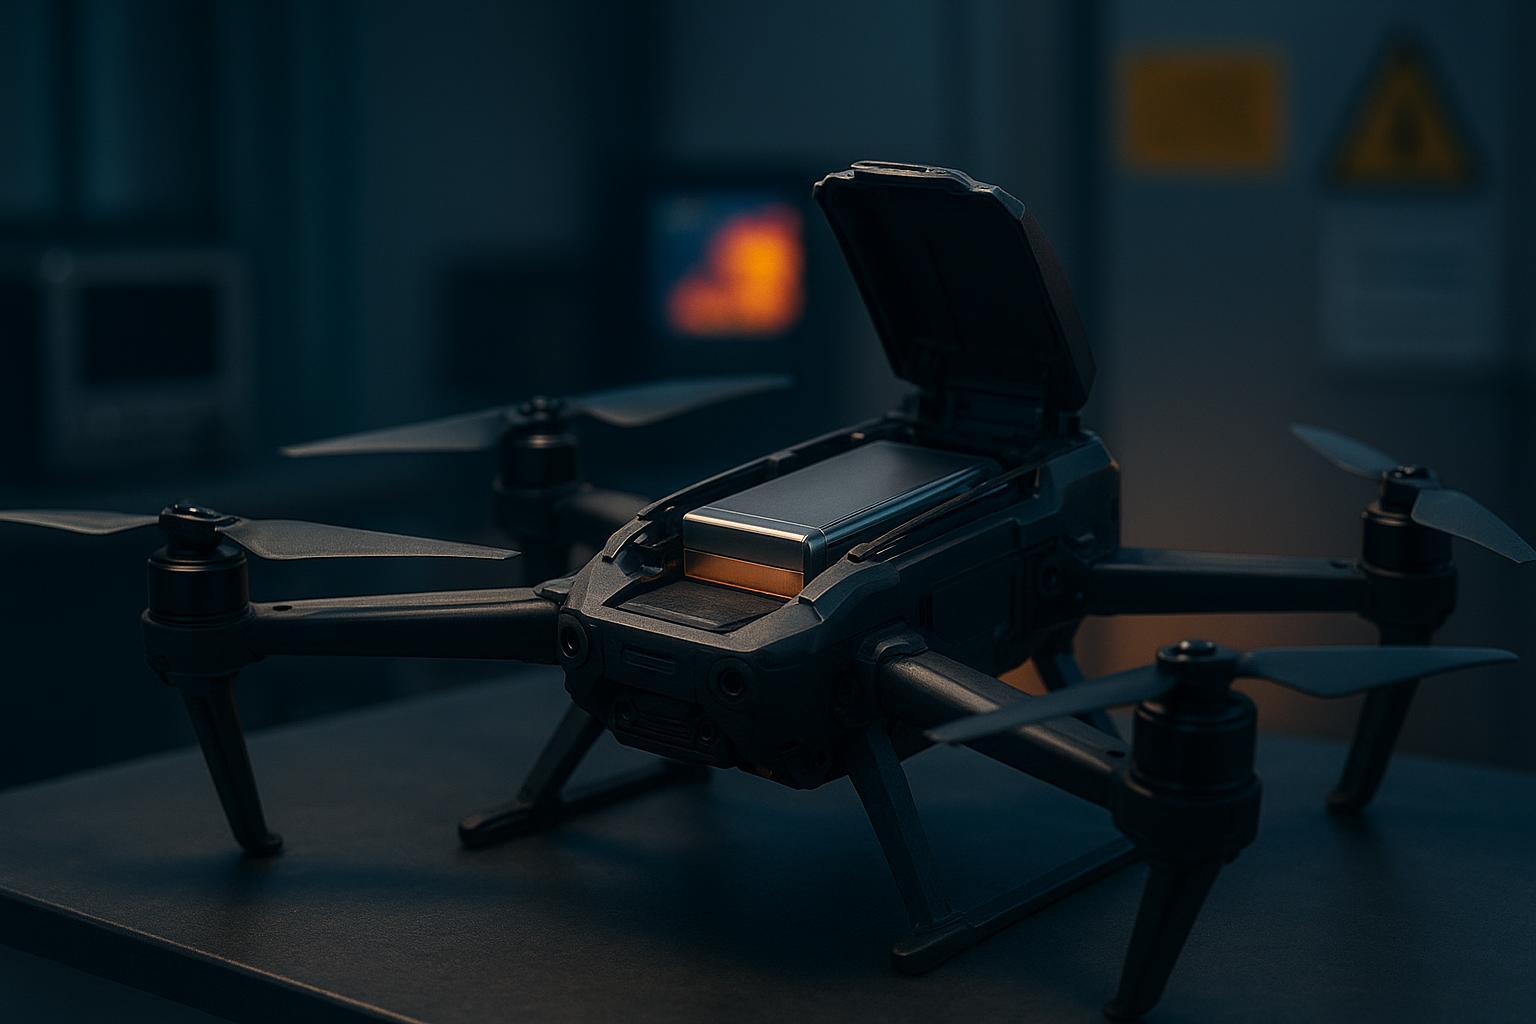


Many inspection UAV fleets don’t fail because the airframe lacks power.
They fail because battery behavior becomes unpredictable under sustained load: voltage sag near the end of a sortie, reserve collapsing faster than planned in cold wind, and thermal buildup that quietly accelerates aging across back‑to‑back missions.
Over time, those “battery quirks” turn into operational consequences: more aborted flights, more spare packs on the truck, more conservative dispatch decisions, and a higher inspection cost per kilometer.
In inspection operations, the cost of battery instability is rarely the battery itself. It’s the downstream disruption: delayed inspection windows, repeat flights, idle crews, conservative route planning, and lower daily asset utilization.
That’s why industrial drone battery selection is shifting away from chasing peak specs and toward sustained voltage stability, thermal reliability, and total cost of ownership (TCO). This guide walks through a practical selection method you can apply to inspection fleets—and defend in procurement and safety reviews.
Why inspection battery selection fails in real operations
Inspection profiles look deceptively “easy” on paper: long steady cruise with occasional corrections. In reality, fleets tend to get hit by the same three operational failure modes.
First, late-sortie voltage sag forces earlier returns. A pack can look fine in short tests and still dip below warnings when you’re trying to finish the route.
Second, cold wind and aging shrink the usable window. Internal resistance rises, usable capacity drops, and the same mission starts triggering return-to-home sooner than crews expect.
Third, sortie-to-sortie heat build-up changes behavior over the day. Packs that look fine in the morning may start running hotter by the third or fourth sortie, which pushes teams to cut missions short.
If you select around these failure modes, you don’t just get longer flights—you get fewer aborted missions and a steadier daily inspection output.
What “battery performance” means in inspection operations
For inspection fleets, “battery performance” isn’t a single spec. It’s whether crews can plan a route and trust the outcome.
A practical way to define it is:
- Sortie completion consistency → fewer aborted missions and fewer “we had to turn back early” flights.
- Turnaround predictability → less time lost to cooldown, pack swaps, or troubleshooting between sorties.
- Maintenance predictability → fewer surprise retirements and less day-to-day variation across the fleet.
Once you frame the job this way, the math becomes a tool for preventing operational surprises—not an academic exercise.
How to size an inspection UAV battery system
Once you’re clear on the operational failure modes, sizing becomes straightforward: energy first, then verify current, C‑rating, and thermal margin.
Capacity and energy tell you how long the aircraft can produce the required shaft power. Keep units straight.
- Energy in watt‑hours: Wh = V × Ah
- Endurance approximation: Flight time h ≈ [Energy Wh × usable state of charge] ÷ Average power W
- Usable state of charge is the fraction you plan to use each flight to protect cycle life. For inspection missions, many fleets plan 70–90% usable SOC.
A second useful identity relates power and current. At a given bus voltage, average current draw is Iavg = Pavg ÷ Vbus. This matters because current squared times resistance drives heat. For the same power, a higher bus voltage reduces current and I²R losses, which improves voltage stability and thermal headroom.
Why peak C‑rating is not the same as operational reliability
A lot of industrial drone battery selection mistakes come from treating a high C‑rating as a proxy for “reliability.” For inspection work, reliability is more specific: stable voltage under sustained load, predictable reserve near end‑of‑sortie, and manageable heat across repeated missions.
C‑rating still matters—but mostly as a way to sanity‑check that your pack won’t run hot or sag hard when gust corrections and hover transients stack on top of steady cruise.
For inspection fleets, C‑rating is usually not the primary bottleneck. In most cases, endurance instability shows up earlier through voltage sag and heat accumulation—long before peak discharge capability becomes the limiting factor.
That said, you still need C‑rating to confirm the pack has enough current headroom for real-world transients. Use these relationships:
- Maximum continuous discharge current (A) = Capacity (Ah) × C‑rating (continuous)
- Required C‑rating ≥ I_peak (A) ÷ Capacity (Ah)
Differentiate continuous from burst. Continuous defines what the pack can sustain thermally without premature degradation. Burst (or pulse) supports short transients but induces significant voltage sag and extra heat (I²R), so treat pulse ratings as headroom, not sustained duty.
For inspection profiles dominated by steady cruise with gust corrections, a moderate continuous C (about 10–20C when energy is correctly sized) often yields better TCO than high‑C packs.
- Why? Lower continuous C designs at the same chemistry typically run cooler at moderate loads and, all else equal, exhibit slower calendar and cycle degradation.
- The trade‑off: high‑C packs earn their keep in heavy takeoff and aggressive maneuvering but can add unnecessary cost, weight, and thermal stress for long, steady sorties.
Why many long‑endurance inspection platforms prefer 14S
For inspection missions, you usually care less about brief punch and more about steady cruise stability—especially when the pack is cold or nearing the end of its usable SOC window.
At constant power, current scales as I = P ÷ V. A higher bus voltage means lower current for the same flight power, which typically translates to:
- less I²R heating in wiring, connectors, and the pack
- less voltage sag during gust corrections and hover transients
- more thermal headroom for back‑to‑back sorties
That’s the operational reason many heavy‑endurance inspection airframes and custom VTOLs lean toward 14S when integration allows.
For reference, typical nominal and maximum voltages are:
- 12S nominal about 43.2–44.4 V, full charge up to about 50.4 V
- 14S nominal about 50.4–51.8 V, full charge up to about 58.8 V
If your aircraft and ESCs accept both 12S and 14S, 14S is often the more forgiving choice for long‑range inspection—provided your BMS current limit exceeds your peak by a comfortable margin and your telemetry exposes per‑cell voltage and pack temperature for in‑flight monitoring.
Real inspection mission example: a 2-hour powerline sortie
Consider a common powerline inspection problem: you need two hours of endurance, stable cruise in crosswind for imaging, and a reserve margin that doesn’t vanish when the pack gets cold or ages. The numbers below show how to size energy first, then use C‑rating as a reliability check.
Given mission assumptions for a power line inspection sortie:
- Average electrical power: 500 W
- Target flight time: 2 h
- Transient peak current: 30 A
- Example bus voltage for the math step: 14.8 V
- (this is a simple arithmetic example; platform guidance follows)
Step 1. Compute required energy and theoretical capacity at the example bus voltage.
- Energy Wh = 500 W × 2 h = 1,000 Wh
- Capacity Ah = Energy Wh ÷ Voltage V = 1,000 ÷ 14.8 ≈ 67.6 Ah
Step 2. Theoretical C‑rating from peak current.
- C ≥ Ipeak ÷ Capacity = 30 A ÷ 67.6 Ah ≈ 0.44C
On paper, that looks tiny. In operations, it’s a warning sign that the bottleneck isn’t “peak current”—it’s reserve predictability under temperature, aging, and sag.
Step 3. Convert theory to an engineering recommendation with conservative margins.
- Usable SOC window. If you plan to use 80% of the pack to protect cycle life, divide by 0.8. 67.6 Ah ÷ 0.8 ≈ 84.5 Ah
- Aging and temperature derating. Add about 15% to account for early life variance, measurement error, and winter IR rise. 84.5 Ah × 1.15 ≈ 97.2 Ah
- Burst and sag headroom. Add 10–15% for gusts and aggressive hover corrections. 97.2 Ah × 1.15 ≈ 111.8 Ah equivalent at 14.8 V
At a 12S or 14S enterprise voltage, you will meet the same 1,000 Wh energy target with different current. For a 14S nominal bus around 51.8 V, average current is roughly 500 ÷ 51.8 ≈ 9.6 A, which materially reduces I²R heating and helps stabilize voltage late in the sortie compared with a lower‑voltage configuration for the same energy.
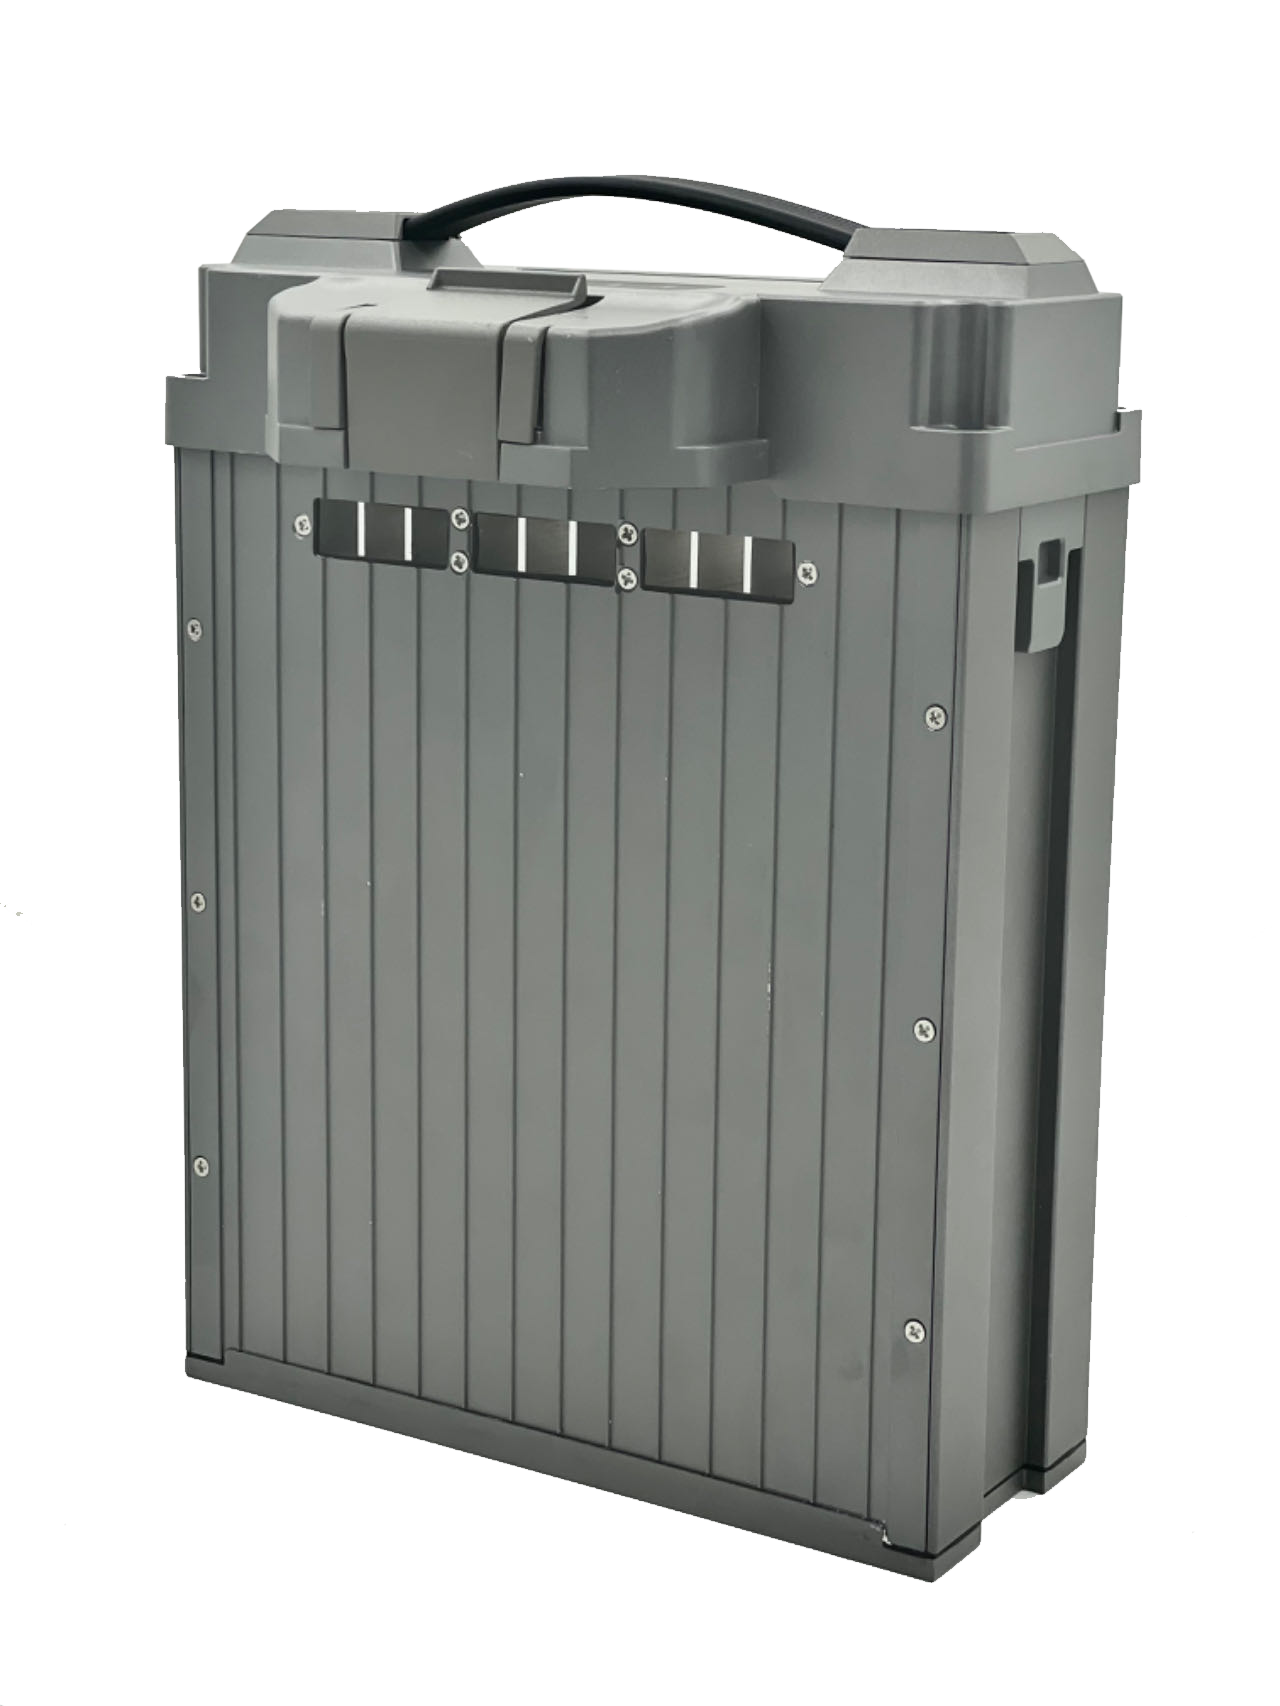
Practical recommendation from this example. Configure your pack array to deliver about 1,000 Wh net with the margins above. On 12S or 14S modules, that often translates to one or more modules between about 22 Ah and 33 Ah each in parallel or hot‑swap configurations, with a continuous C‑rating around 10–15C and a datasheet pulse rating aligned to your ESC limits.
The logic is: size energy first, then verify continuous and pulse ratings provide thermal and voltage headroom for your mission.
Industrial drone battery selection in practice (how to apply this method)
For inspection missions, start from energy and margin, not just C‑rating. Size total system energy to the duty cycle with realistic reserves, then confirm that continuous C‑rating comfortably covers your average and bursts, and finally select the highest voltage platform your airframe accepts to minimize current and sag.
Below is a compact matrix you can use to align mission goals with pack specs. Values are indicative ranges grounded in inspection fleet profiles and the engineering logic discussed above.
| Scenario | Operational KPI | Recommended capacity per module | Recommended continuous C | Engineering notes |
|---|---|---|---|---|
| Power or pipeline inspection | Zero‑failure long distance | ≥ 22,000–33,000 mAh at 12S or 14S | 10C–15C | Size to ≥1,000 Wh system energy with reserve; favor 14S to reduce current and sag; ensure BMS limit ≥1.2× peak |
| Mapping and surveying | Single‑sortie coverage area | ≥ 10,000–22,000 mAh | 15C–25C | Balance endurance with posture corrections in variable terrain; moderate C for gusts |
| Agriculture spraying | Uniform spray and turnaround efficiency | 15,000–30,000 mAh | 20C–30C | High lift and frequent transients demand higher C and robust thermal management |
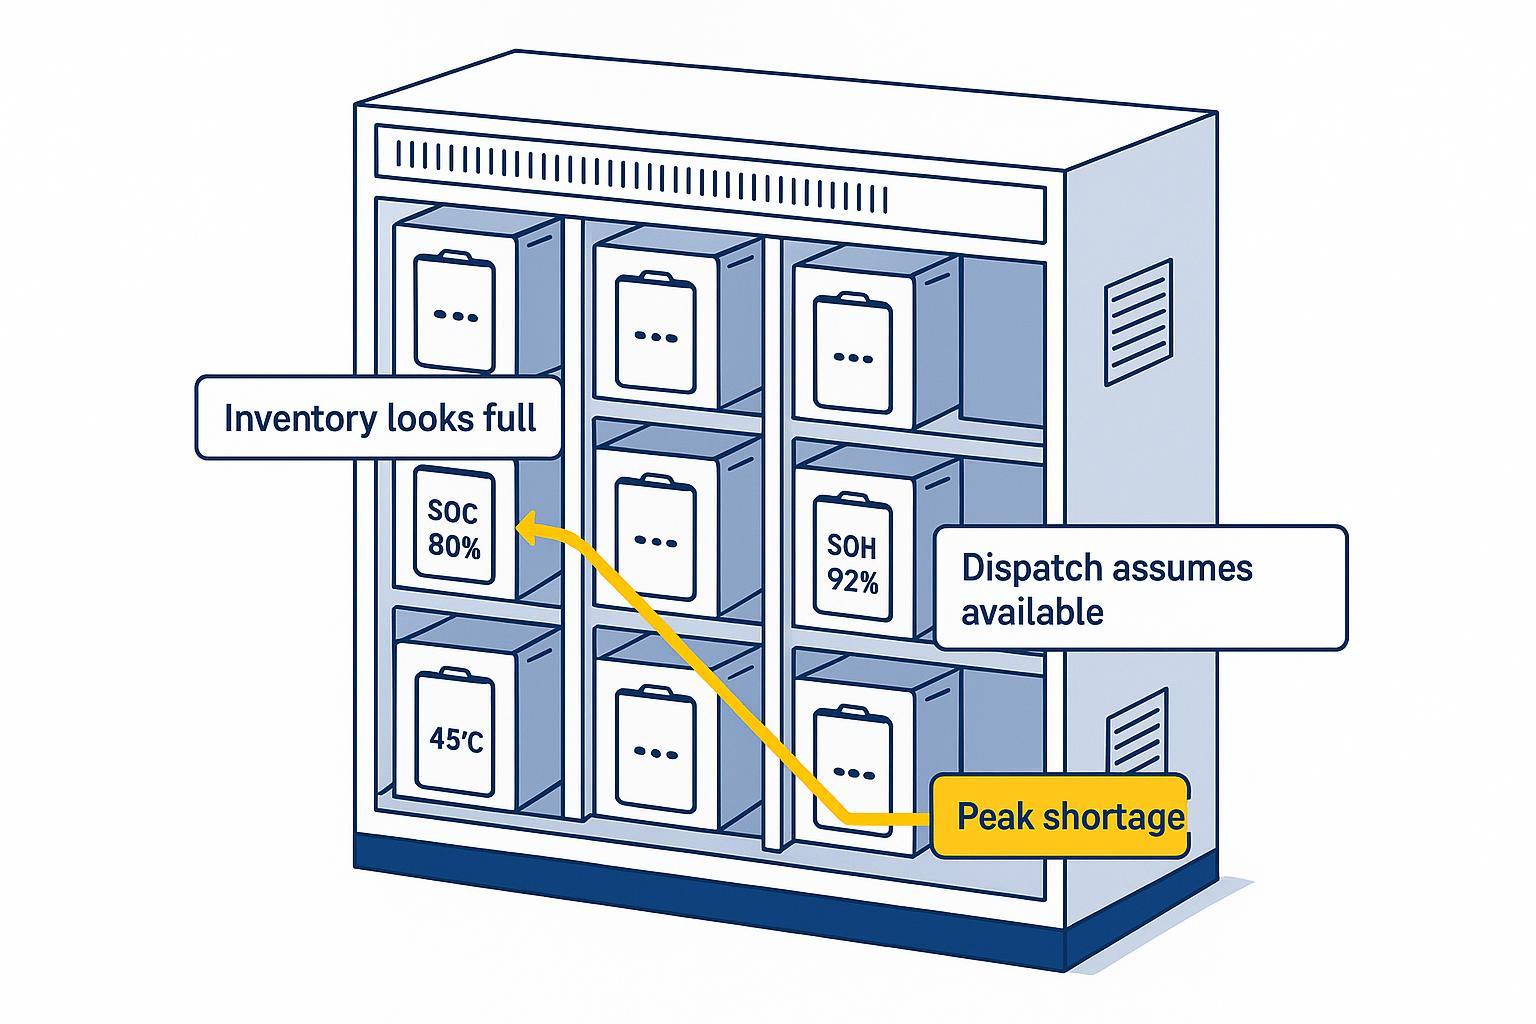
Use the matrix to narrow options, then validate on your airframe with telemetry logs. Watch pack temperature rise per minute at cruise, observe minimum cell voltage during bursts, and check that low‑voltage warnings appear well above your safety reserve.
If you’re buying for a fleet, ask suppliers for evidence that maps to those logs—not just a headline C‑rating:
- The exact test setup behind the continuous and pulse ratings (how long the test ran, cutoff voltage, and temperatures).
- Evidence showing how fast the pack heats up during an inspection-style mission profile (not just a short burst).
- Whether different packs behave consistently across the fleet (how much capacity and resistance spread you should expect) and what “end of life” means.
- BMS limits and what telemetry you can actually pull after a flight (cell voltages, temperatures, event logs).
TCO modeling and risk management (quantified example)
TCO for inspection batteries is driven by pack cost, cycles to 80% SoH, and downtime. A practical framing:
Cost per flight hour ≈ Pack cost ÷ (Cycles to 80% SoH × Hours per cycle) + Unplanned incident probability × Cost per incident + Logistics/compliance overhead
Example (illustrative — request vendor cycle data):
| Parameter | Pack A (moderate C) | Pack B (high C) |
|---|---|---|
| Continuous C band | 10C–15C | 25C–30C |
| Pack purchase cost | $1,200 | $1,500 (+25%) |
| Expected cycles to 80% SoH | 1,200 | 700 |
| Avg hours per cycle | 2 h | 2 h |
Simple capital cost per flight hour:
- Pack A: $1,200 ÷ (1,200 × 2) = $0.50/flight hour
- Pack B: $1,500 ÷ (700 × 2) ≈ $1.07/flight hour
Key takeaways
- Savings: Under these assumptions, moderate‑C packs cut battery capital cost per flight hour by ~53% (illustrative).
- Caveat: Results depend on vendor‑specific cycle tests (DoD, temperature) and operational downtime; include incident costs in full TCO.
- Procurement actions: Request cycles‑to‑80% SoH at representative DoD/temp, continuous and pulse C ratings with test durations, thermal profiles under mission loads, and lab accreditation/method summary.
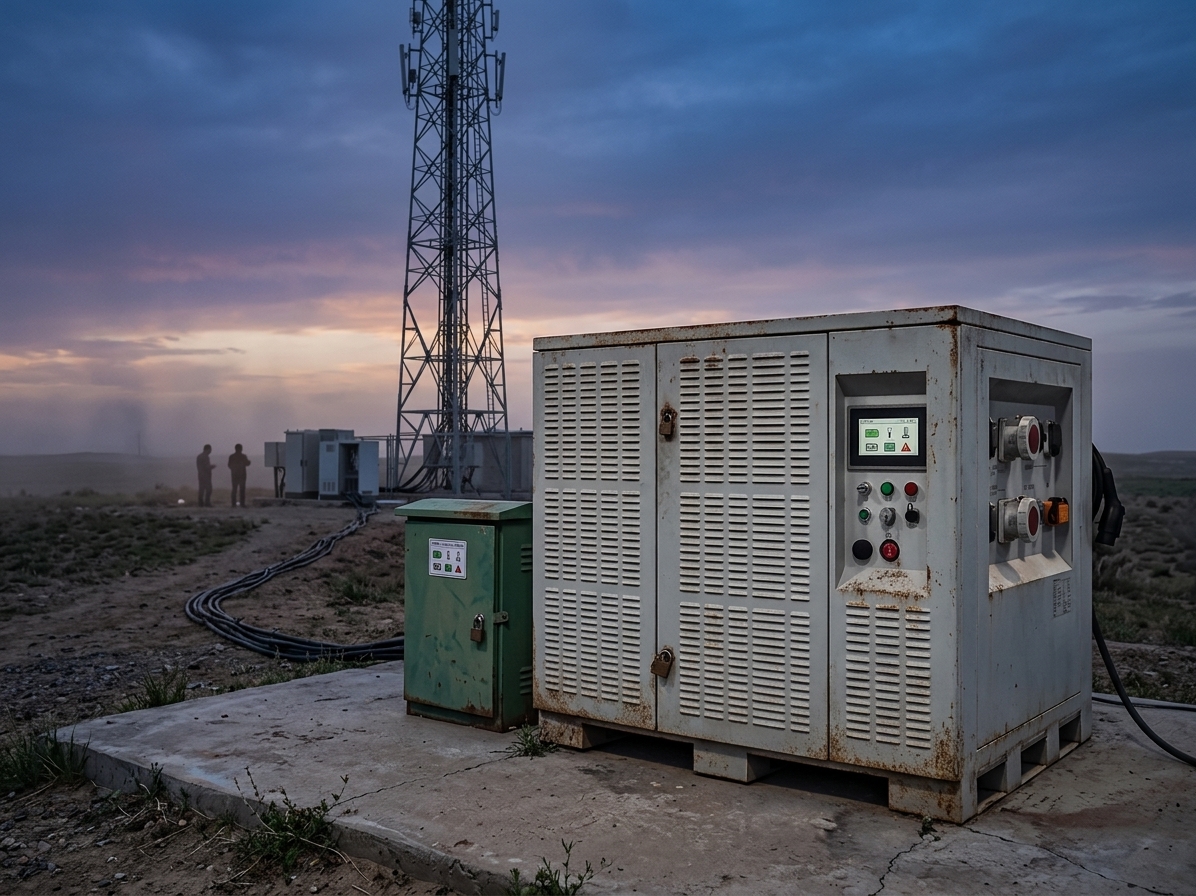
Environmental adaptation for steady, zero‑failure sorties
Cold reduces power and capacity by raising internal resistance and slowing reaction kinetics, while high heat accelerates aging and can precipitate thermal incidents. What practical rules help inspection operators?
- Preheat to a core temperature near 20–25°C and maintain insulation between sorties in winter. Avoid charging below about 5°C to reduce lithium plating risk. These practices are consistent with enterprise guidelines and vendor advisories; for a materials perspective on cold‑induced degradation see the SLAC/Stanford summary on particle cracking in extreme cold: SLAC/Stanford cold‑damage summary.
- Expect voltage sag under gusts at low temperature. Reserve extra SOC buffer and avoid steep descents at minimum SOC.
- In hot climates, avoid prolonged exposure above ambient mid‑30s Celsius and respect BMS over‑temperature limits. Park in shade, ensure airflow paths are not obstructed, and plan shorter cycles during heat waves.
For inspection‑specific endurance and environmental tactics, see operational tips on lithium batteries for mapping and inspection drones: Herewin mapping & inspection guide.
Procurement checklist for inspection UAV batteries
In practice, most procurement delays don’t come from chemistry selection. They come from missing documentation, unclear discharge test conditions, or incomplete transport compliance.
For procurement teams, treat compliance as documentation you can audit—not marketing claims. The minimum set most fleets ask for:
- UN38.3 Test Summary (per 38.3.5) showing Tests T1–T8 passed. Official reference: UNECE UN38.3 Rev.8 + Amend.1.
- IATA air-shipping readiness for UN3480: standalone lithium‑ion batteries shipped by air are capped at 30% SoC under Packing Instruction 965. Reference: IATA Lithium Battery Guidance Document.
- IEC/UL 62133‑2 safety test report (accredited lab) to support market access and safety review. Reference: UL 62133 family overview.
Also request the latest Safety Data Sheet, the manufacturer Declaration of Conformity for your target markets, and a brief summary of how continuous and pulse discharge ratings were tested (duration, cutoff, and temperature window).
Semi‑solid packs for inspection UAVs: what to evaluate
Some operators are starting to evaluate semi‑solid architectures not primarily for “maximum endurance,” but for improving energy density without proportionally increasing pack current and thermal stress.
If you’re evaluating semi‑solid (or any higher‑energy pack design), don’t accept the chemistry label as proof. Ask for evidence that maps to inspection operations:
- Cycles to 80% SoH at representative DoD and temperatures.
- Continuous and pulse C‑ratings with test durations and cutoff criteria.
- Evidence showing how quickly the pack heats during inspection-style missions (temperature rise rate and hotspots).
- Pack-to-pack consistency data so you know whether fleet behavior will be uniform or variable.
Stepwise sizing checklist for inspection fleets
- Quantify average mission power from propulsion and payload logs across representative wind and altitude.
- Size total energy to mission time using Wh = V × Ah and include SOC, aging, and temperature margins as shown in the worked example.
- Choose the highest supported voltage platform to reduce current for the same power and confirm ESC and avionics compatibility.
- Select continuous C‑rating to cover average current with headroom and ensure datasheet pulse rating exceeds expected bursts and BMS limits. Prefer 10C–15C for steady inspection missions; reserve higher C (20C–30C) for heavy‑lift or high‑maneuverability platforms.
- Validate with telemetry: confirm temperature rise rates, per‑cell minimums, and reserve SOC at landing across hot and cold days.
Next step
The best inspection battery systems are rarely the ones with the highest headline specs. They’re the systems that keep sortie behavior predictable across temperature shifts, aging, and repeated daily operations.
In practice, that predictability is what lets fleets scale inspection coverage without scaling operational risk.
If you run inspection sorties and want to validate this selection method on your airframe, set up a small-scale pilot. Using your telemetry and environmental windows, evaluate a 12S or 14S module set configured to about 1,000 Wh with a continuous 10–15C rating, and compare suppliers using the same discharge test conditions and flight-log criteria.