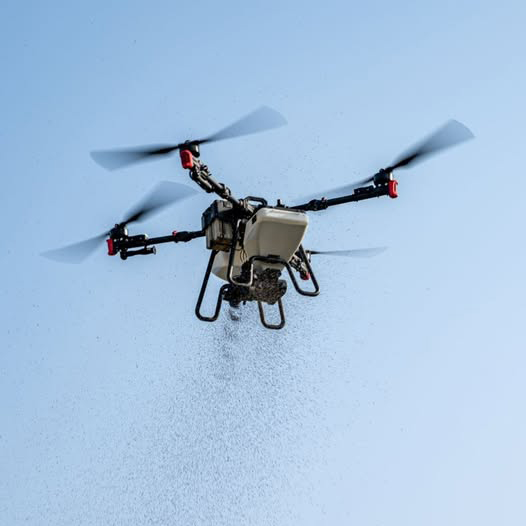


Industrial UAV procurement in 2026 is going through a quiet reset.
Not because fixed-wing airframes suddenly got “better.” Not because multirotors stopped being useful. But because the market changed what matters.
As BVLOS programs move from pilots-and-prototypes to repeatable operations, the limiting factor stops being “can this aircraft fly far?” and becomes:
-
Can the operation hold a schedule?
-
Can you keep crew hours そして battery swap logistics for drone fleets from dominating OpEx?
-
Can you increase coverage per sortie enough to change drone inspection cost per kilometer?
-
Can you make the whole system auditable for regulators, insurers, and internal safety teams?
That’s why long-endurance fixed-wing (and fixed-wing VTOL) platforms are back on serious buyers’ shortlists: under the combined pressure of energy constraints, regulatory maturity, and large-area mission growth, fixed-wing mission economics start to look rational again.
Why “more payload” stopped being the only buying metric
Many enterprise drone programs spent the last few years optimizing for payload-first tasks: heavier sensors, better optics, more compute, more specialized gimbals.
But once you move from single sorties to production-scale operations, payload specs stop being the bottleneck. The bottleneck becomes the number of cycles you can complete per day without friction:
-
launch → mission → recovery
-
swap/charge → re-dispatch
-
data offload → QA → reporting
If payload adds capability but also increases sortie count (because endurance drops or charging cadence slows), the “better payload” can produce a worse program.
How BVLOS industrial drone operations changed procurement priorities
BVLOS maturity changes procurement logic because it increases the value of repeatability.
In the U.S., the FAA has been moving toward a more standardized BVLOS pathway through the proposed Part 108 framework described in the Federal Register’s 2025 BVLOS NPRM, Normalizing Unmanned Aircraft Systems Beyond Visual Line of Sight Operations.Federal Register BVLOS NPRM (2025)
In the EU, BVLOS missions commonly sit inside the “Specific” category, where EASA’s Specific Operations Risk Assessment (SORA) methodology exists to classify risk and define mitigations for complex operations. Meanwhile, EU U-space rules (Regulation (EU) 2021/664) are intended to support scalable UAS operations in designated airspace with required digital services.
Once BVLOS becomes operationally possible, buyers start optimizing for dispatch reliability そして cost per completed mission, not demo-day performance.
Why operators are now optimizing for coverage per sortie
A procurement-grade question in 2026 isn’t “what’s the max endurance?” It’s:
If our mission profile stays constant, what architecture gives us the highest coverage per sortie with the lowest operational friction?
For corridor inspection and large-area mapping, fixed-wing cruise efficiency converts stored energy into distance more efficiently than multirotors can—because multirotors must continuously generate lift through high power draw.
The compounding operations tax of short-flight cycles
Short flight cycles don’t just cost minutes. They create an operations tax that grows with scale:
-
more packs staged and transported
-
more charging channels and field power planning
-
more handling events (risk, wear, human error)
-
more variance across packs that shows up as schedule slips
In small deployments, that tax is easy to hide.
At scale, it becomes a KPI problem: lower km²/day, lower utilization, and higher $/km—even if the aircraft is technically “performing.”
Once turnaround planning and pack variance start driving the schedule, “buy more batteries” is usually a short-lived fix. It increases inventory, storage/transport complexity, and the odds that weak packs appear mid-operation.
The first endurance constraint is flight time. The second endurance constraint is fleet-level predictability.
Signs Your Drone Program Has Outgrown Multirotor Economics
This is the “procurement trigger” layer. If you recognize two or more of these, it’s usually time to model fixed-wing (or fixed-wing VTOL) seriously—not as a shiny upgrade, but as an operations redesign.
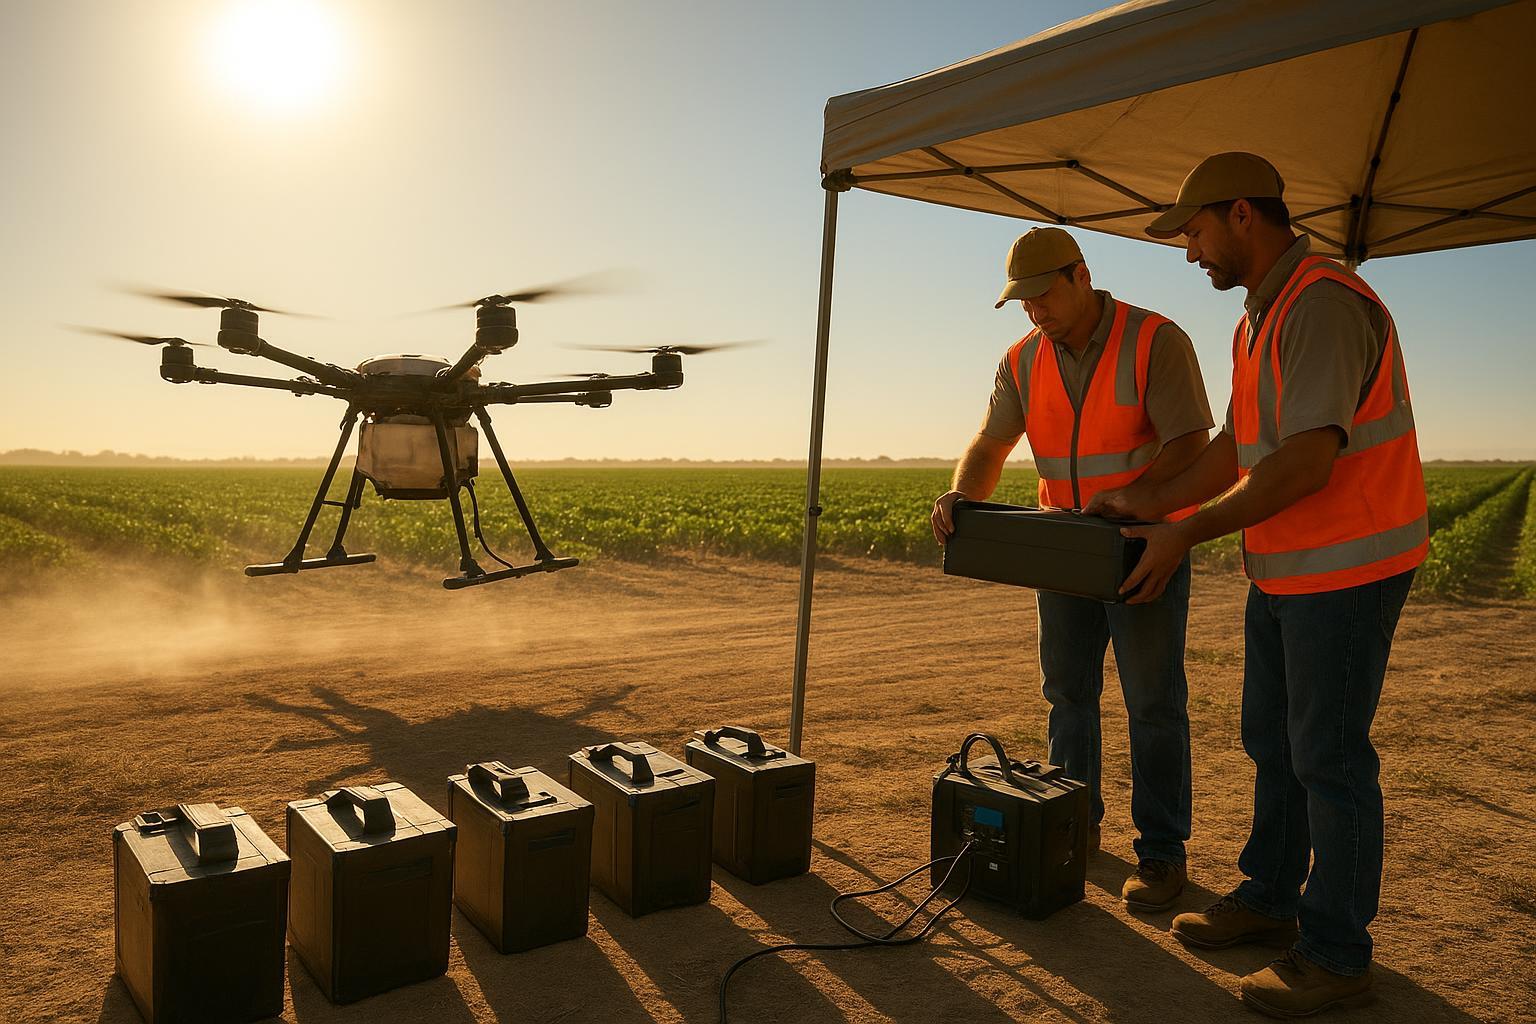
When battery logistics become a dedicated workflow
If your field plan includes staging, labeling, transporting, cooling, charging, and rotating packs as a primary workstream (not a supporting task), you’re already paying an operations tax that fixed-wing endurance can sometimes reduce.
When coverage per day stops improving despite adding aircraft
If adding aircraft increases inventory and complexity but doesn’t increase km/day or km²/day, you’re likely bottlenecked by turnaround: recovery, pack handling, charging channels, and data workflow—not by airframe count.
When crew cost scales faster than mission output
If your headcount grows faster than completed kilometers (or mapped area), short-flight cycles and repeated recovery/setup are probably dominating the day. At that point, improving crew utilization matters as much as improving endurance.
When BVLOS approval makes corridor operations viable
Once BVLOS is feasible in your regulatory pathway, your constraint shifts from “can we fly it?” to “can we repeat it on schedule?” Platforms that reduce sorties and handling events become more attractive.
When inspection cost per kilometer becomes a management KPI
As soon as $/km becomes the number leadership tracks, the aircraft category matters less than the throughput model: sorties required, turnaround cadence, and the variance you can’t explain away in weekly reporting.
Where fixed-wing platforms now outperform rotary UAVs
Fixed-wing starts winning when the mission is defined by distance, area, and repeatability, not hovering and close-in maneuvering.
Pipeline and transmission corridor inspection
Fixed-wing is a natural fit when you’re inspecting linear assets and the economics are driven by:
-
km covered per sortie
-
number of launch/recovery events per day
-
how long you can stay on task without interruption
Long-range mapping and surveying
For large-area mapping, fixed-wing cruise efficiency often converts to fewer sorties, fewer swaps, and fewer handoffs—meaning the same team can cover more ground per day.
Border, forestry, and environmental monitoring
These missions tend to be:
-
geographically large
-
time-bound (weather, daylight windows)
-
operationally repetitive
Long-endurance platforms reduce the operational overhead per mission.
Maritime and coastal operations
Coastal missions often punish operations with:
-
fewer safe landing points
-
wind exposure
-
long distances between staging areas
Endurance and mission radius can reduce dependency on perfect staging logistics.
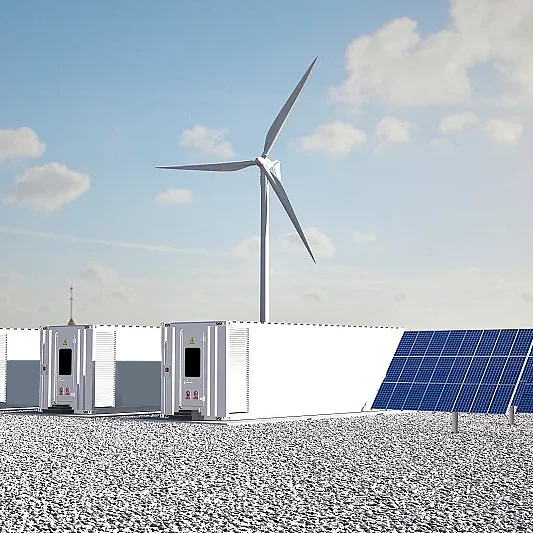
Energy systems are changing the fixed-wing value equation
Most articles about fixed-wing “coming back” talk about airframes. Procurement teams should care more about energy architecture—because energy constraints show up as turnaround constraints.
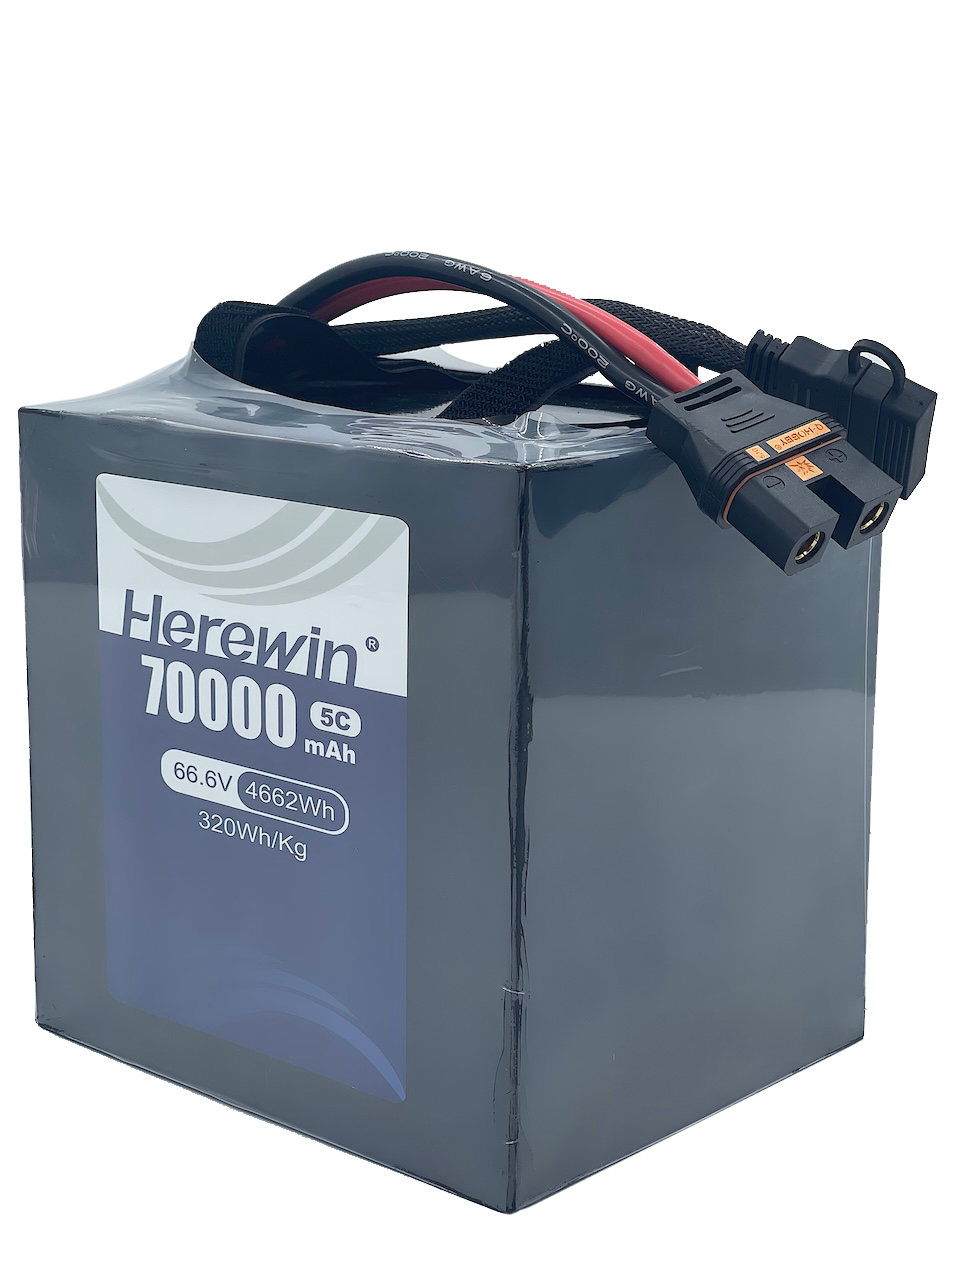
Higher pack-level energy density and longer mission windows
Higher energy density doesn’t just make a drone fly longer. It reduces the number of swaps and creates more margin for wind, reroutes, and extra passes.
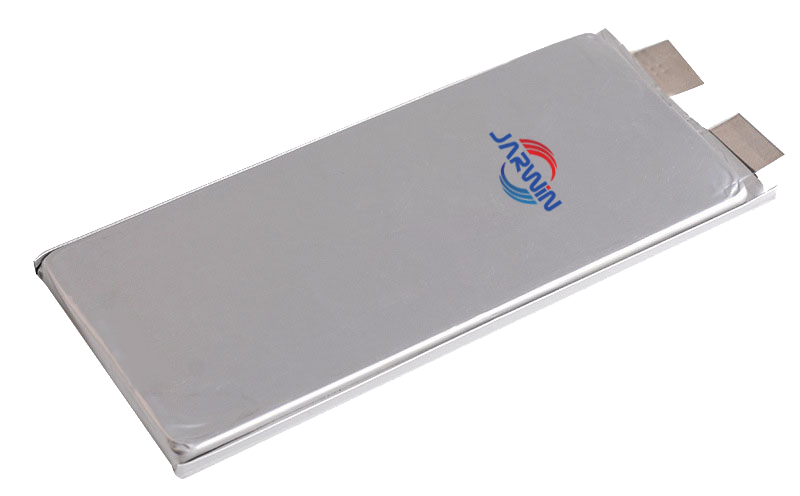
Herewin’s analysis frames energy density as a system-level constraint for industrial UAV performance and payload economics—not a niche spec: Why 400Wh/kg Semi-Solid-State Batteries Are Reshaping Industrial UAV Performance.
For third-party context on UAV battery safety and thermal runaway risk management, see UL’s UAV-focused UL 3030 battery safety standard and the FAA–EASA Thermal runaway for propulsion battery white paper.
Why cruise efficiency matters more than peak thrust
Multirotors are power-hungry because hovering is expensive. Fixed-wing generates lift aerodynamically, so cruise efficiency can dominate corridor and mapping mission economics.
In practice, energy architecture + cruise profile often matter more than “burst” performance.
Semi-solid battery impact on long-endurance UAVs
Energy density improvements can shift the breakeven point where fixed-wing becomes operationally rational. But buyers should treat this as an integration problem, not a drop-in upgrade:
-
charge curves and internal resistance behavior
-
thermal behavior under sustained load
-
BMS requirements for predictability and traceability
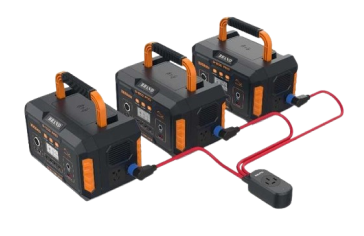
The growing importance of charging logistics and turnaround planning
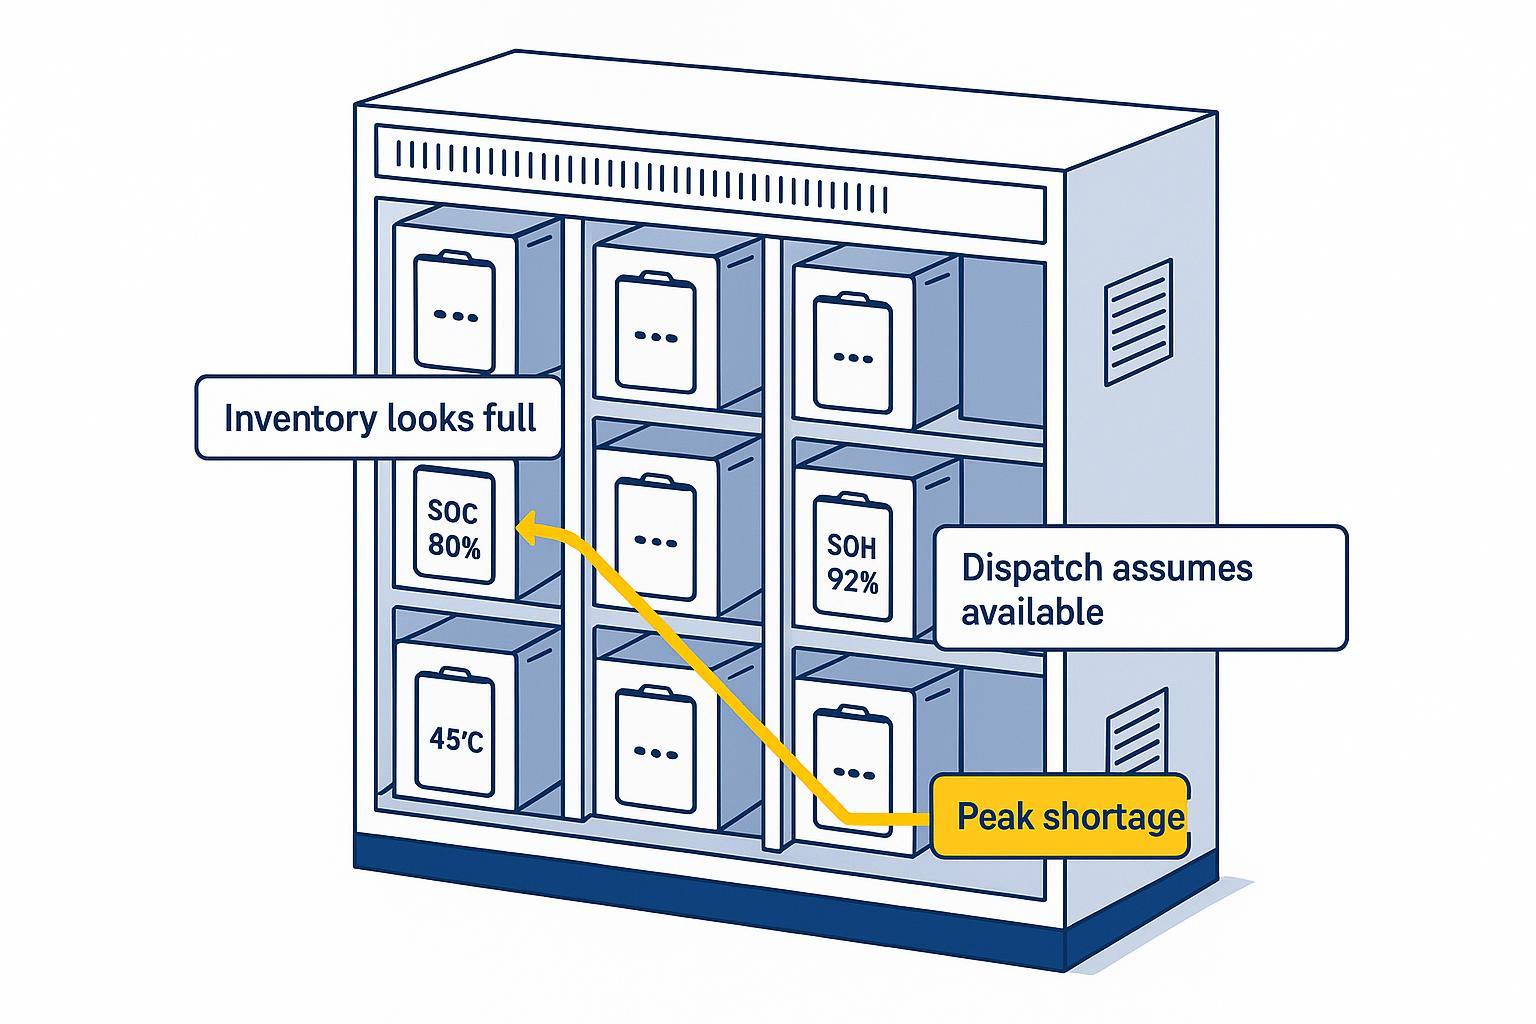
In high-frequency schedules, charging variance becomes a hidden cost.
Herewin’s thermal-stability view is blunt: peak C-rate is not the KPI; sustained stability and predictable charging windows determine whether the fleet can hold a BVLOS schedule: Thermal Stability for UAV Batteries: Peak C-Rate Isn’t the KPI
This reframes procurement: you’re not buying a battery—you’re buying a turnaround system.
Why buyers are evaluating mission economics, not aircraft specs
If you want a procurement-grade decision, you need to model the operation.
Cost per kilometer vs cost per flight
Specs answer cost per flight.
Operations need cost per outcome.
For inspection and mapping, that outcome is usually distance or area:
-
drone inspection cost per kilometer
-
$/km² mapped
-
km/day or km²/day per crew
Coverage per operator per day
Coverage per day is a compound KPI.
It includes:
-
sortie time
-
recovery time
-
swap + charging time
-
preflight QA time
-
data workflow time
Fixed-wing tends to reduce the number of cycles needed for the same coverage.
Battery replacement cycles and spare-pack strategy
Two fleets can have the same endurance and wildly different cost profiles because of:
-
cycle life under actual mission load
-
thermal stress exposure
-
variance across packs and batches
-
replacement policy (preventive vs failure-driven)
This is a procurement conversation, not a pilot conversation.
How procurement teams now model fleet TCO
Below is a simple model you can defend in a meeting. It avoids invented performance numbers.
|
Input |
What to measure |
Why it matters |
|---|---|---|
|
Mission distance (km) / area (km²) |
Your actual weekly workload |
Sets baseline demand |
|
Coverage per sortie (km or km²) |
From flight logs, not brochures |
Determines sortie count |
|
Turnaround time per sortie |
Recovery + swap/charge + preflight |
Determines daily throughput |
|
Crew required per sortie |
Pilot + observer + field tech (if any) |
Dominant OpEx lever |
|
Charging infrastructure |
kW available + channels + field constraints |
Limits throughput |
|
Pack variance |
worst-pack behavior, not average |
Drives schedule risk |
|
Battery lifecycle policy |
cycle cap, derating thresholds, retirement rules |
Controls unplanned downtime |
Example assumption framework (replace with your numbers):
-
sorties/week = weekly required coverage ÷ coverage per sortie
-
field hours/week = sorties/week × (flight time + turnaround time)
-
labor cost/week = field hours/week × blended crew hourly cost
-
battery handling events/week = sorties/week × swap events per sortie
The key is that fixed-wing changes the denominator: coverage per sortie and often swap events per unit coverage.
Fixed-wing vs multirotor UAV for corridor inspection: when each wins
Use “operational envelope” thinking. Don’t buy a platform category. Buy a mission fit.
Fixed-wing starts winning when
-
your mission is distance- or area-defined
-
your daily plan is limited by swap cadence and turnaround time
-
you’re trying to increase coverage per operator per day
-
your business case depends on stable $/km at scale
Multirotor still wins when
-
you need hover, close standoff, and precision positioning
-
your sites are tight and recovery risk is unacceptable
-
the mission is short, episodic, or highly irregular
Why fixed-wing adoption still fails in some deployments
Launch and recovery constraints
Fixed-wing (even VTOL variants) can impose site constraints:
-
landing risk
-
recovery area requirements
-
more complex procedures
If your sites are cramped or unpredictable, the operational tax can erase endurance gains.
When fixed-wing economics look good on paper but fail in deployment
This is the common failure pattern: the spreadsheet assumes smooth, repeatable launch and recovery—but the field reality is discontinuous.
Typical causes include:
-
too many sites with constrained launch/recovery areas or inconsistent ground conditions
-
insufficient landing corridors or recovery zones once you factor in wind direction and crosswind limits
-
mixed mission sets where teams still need hover + close-in inspection for a meaningful share of tasks
-
unstable weather windows that force frequent aborts and re-launches
-
under-modeled recovery risk that drives conservative procedures, longer checklists, and more crew time
Wind sensitivity and landing risk
Fixed-wing can be more sensitive during takeoff/landing phases.
Procurement should ask: do we have enough safe operating days and sites to make the economics work?
Payload limitations for close-range inspection
If the mission requires:
-
stable hover
-
extremely close standoff distances
-
precision positioning around structures
Multirotors remain the right tool.
Why some operators still prefer multirotor fleets
Because their mission envelope is dominated by:
-
precision, not coverage
-
short travel distances
-
complex geometry around assets
A hybrid fleet often wins.
What industrial UAV buyers should validate before scaling fixed-wing fleets
Use this as a procurement checklist—because endurance alone doesn’t protect you from operational failure.
Mission-profile validation
-
Can the platform hold your required GSD or inspection quality at cruise speed?
-
What is the real coverage per sortie under your wind and temperature conditions?
BVLOS workflow compatibility
-
What roles are required (pilot, observer, coordinator) under your approval path?
-
What conformance monitoring and deconfliction services are required?
For EU-style “Specific” operations, align your internal documentation and mitigations to what SORA expects (see the EASA SORA methodology referenced earlier).
Battery and charging infrastructure planning
-
How many charging channels do you need to sustain the schedule?
-
What is the worst-case charging window and cooldown time?
-
What’s your plan for pack variance and weak packs?
Validate what you need from an energy partner in engineering terms: BMS visibility and logging, charge-rate and thermal constraints under real ambient conditions, certification/traceability documentation, and a plan for pack variance (including weak-pack detection) before it shows up as missed dispatch windows.
Data-link reliability and redundancy
-
What is your comms plan for long corridors?
-
What is your redundancy strategy for link degradation?
Maintenance and field-support requirements
-
What maintenance interval and parts supply plan supports your utilization targets?
-
What are your field failure modes and recovery procedures?
In scaled operations, don’t ask “What’s the average performance?” Ask “What’s the worst-pack and worst-day behavior—and how do we detect it early?”
The real takeaway for 2026: endurance only matters when operations scale
Why endurance alone is not enough
Endurance is a spec. Scaling is a system.
If your operation can’t handle charging cadence, variance, and compliance workflows, endurance won’t translate into lower $/km.
Matching aircraft architecture to mission economics
The winning procurement mindset is:
-
define the mission
-
model the throughput
-
identify the bottleneck
-
pick the architecture that removes the bottleneck
The shift from demo performance to operational efficiency
In 2026, the “better drone” is increasingly the one that makes your program predictable:
-
fewer interruptions
-
fewer handling events
-
fewer field hours per unit coverage
-
more auditable compliance
For a broader ROI framing of industrial inspection programs, see Herewin’s Industrial Drone Inspection 2026 guide.
Why hybrid fleets may become the dominant model
Most industrial teams don’t need fixed-wing instead of multirotor.
They need fixed-wing for the missions where coverage and cadence dominate, and multirotors for the missions where precision and hover dominate.
Next step: turn your mission into a defensible throughput and TCO model
Many fixed-wing procurement failures don’t come from bad aircraft performance. They come from bad operational assumptions.
Teams evaluating fixed-wing deployment at scale usually begin by modeling the variables that actually determine throughput and schedule reliability:
-
coverage per sortie under real wind and payload conditions
-
turnaround cadence (recovery, swap/charge, preflight, dispatch)
-
charging infrastructure load and channel constraints
-
battery replacement assumptions under mission-realistic thermal stress
-
crew-hours required per km/day or km²/day
-
worst-pack behavior and schedule variance across the fleet
Once those assumptions are validated, the conversation changes from “Which drone flies longer?” to:
Which system delivers the most predictable coverage at the lowest operational friction?
That’s the real shift happening in industrial UAV procurement in 2026: buyers are increasingly optimizing for repeatable throughput and auditable operations—not brochure endurance numbers alone.