







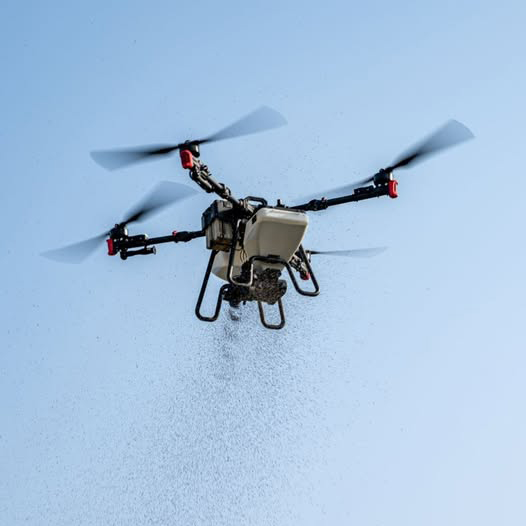


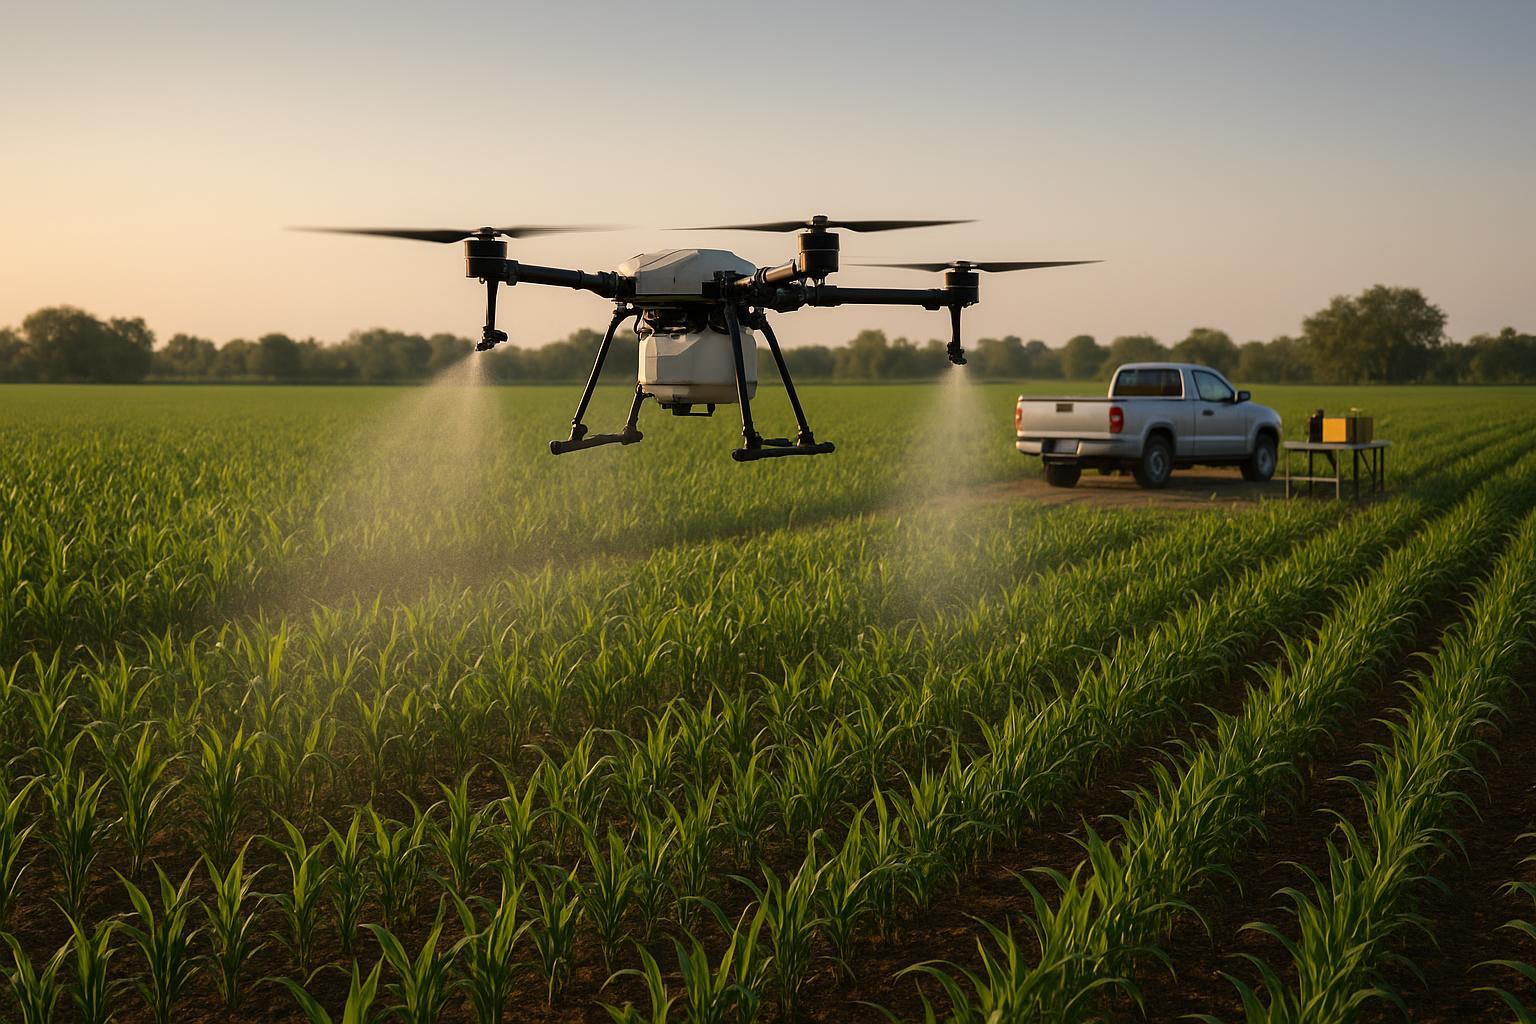
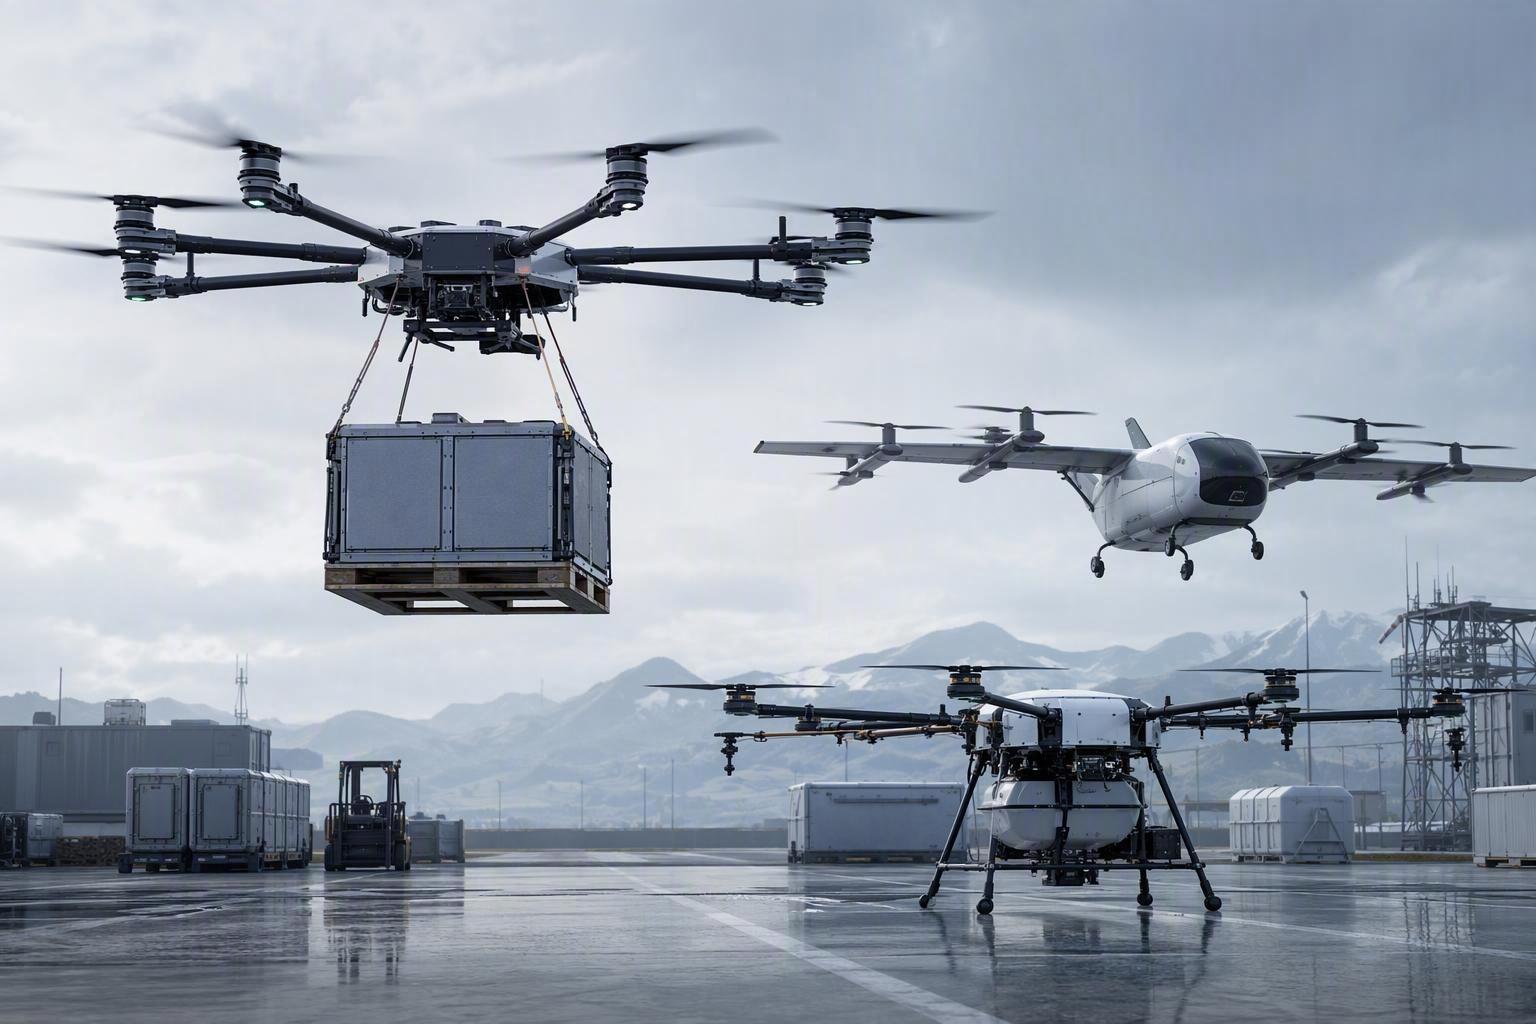
If you manage a spray drone operation, you already know the first question everyone asks about an agricultural drone battery: “How long can it fly?”
Flight time is the easiest metric to visualize. It’s a single number. It fits on a spec sheet.
But for spraying, flight is only one step in the job your team is paid for.
The job is: finish a field on time, within label constraints, without overheating packs, and without a charging queue that turns your peak window into idle time.
So the KPI that actually matters is not “minutes in the air.”
It’s hectares per hour (or in the U.S., acres per hour) — the field output your operation can sustain.
Longer flight time is a component of productivity, not a guarantee of higher field throughput.
Flight Time Is Only One Part of Field Productivity
Why flight time became the default battery metric
Flight time became the default because it is the simplest proxy for “battery performance.” It feels like the battery’s job.
For agricultural spraying, that mental model is incomplete.
A spray drone mission has a “useful work” phase (spraying), and a long list of non-spraying phases that still consume your day:
takeoff and positioning
turns, headlands, and obstacles
return and landing
battery swap (or charging hookup)
mixing and refill
checks, logs, and relaunch
If your cycle is inefficient, adding two minutes of flight time can be erased by five minutes of ground delay.
That’s the turning point: once you’re running multiple sorties per hour, “minutes in the air” stops being the bottleneck — the loop does.
Why agricultural operations require a different KPI
Agriculture is a narrow-window business.
When the wind is wrong, or temperature inversions show up, or a field has access issues, you don’t “average it out later.” You lose the window.
That’s why operators end up building the whole system around reality, not spec sheets: spare packs, charging power, and people on the ground. Those constraints decide how much area you can complete in a day — not just how long one flight lasts.
The right KPI should match the business outcome:
Output: hectares per hour / acres per hour
Predictability: can you sustain it across the day?
التكلفة: what does each hectare actually cost you to deliver?
What Actually Determines Hectares per Hour (Acres per Hour)
When operators ask “how many acres per hour can we actually sustain?”, they’re really asking about effective field capacity — the output after you account for the non-spraying parts of the day.
Understand the complete field operation cycle
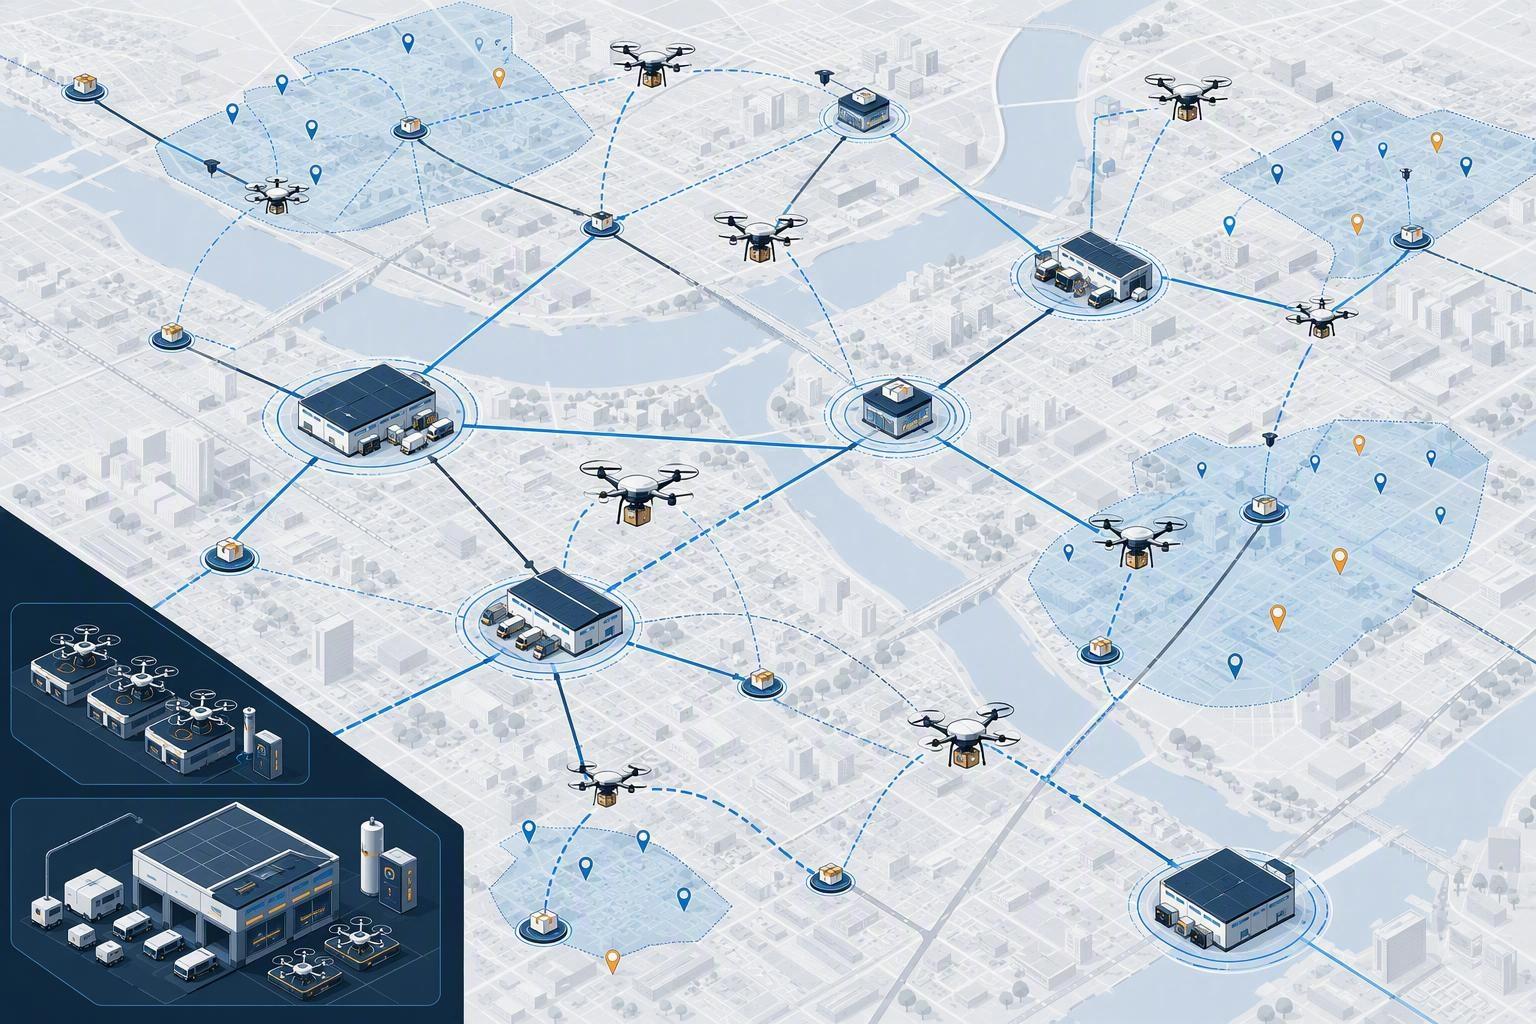
Stop thinking “flight.” Start thinking cycle. A simplified spray operation loop looks like this:
Take off
Spray
Land
Battery swap (or connect to charge)
Chemical refill / mixing
Pre-flight checks
Take off again
Your operation repeats cycles, not flights.
Here’s the simplest way to keep the conversation tied to business output:
Daily output = (Number of completed cycles) × (Area per cycle)
People naturally focus on “Area per cycle” (payload, spray width, speed, flight time). But in real shifts, the battery system mostly determines the other half: how many cycles you actually complete.
In other words: a battery system is part of the cycle, not separate from it.
If packs aren’t ready (charging bottlenecks, cooldown limits, inconsistent behavior), you don’t just lose a few minutes — you lose entire cycles, and your daily coverage drops fast.
That’s why battery discussions have to move beyond chemistry and headline capacity. What matters is whether the pack helps your team keep that loop tight, repeatable, and interruption-free.
Where field time is lost between flights
Most productivity loss lives in the “between flights” layers.
Queueing: waiting for a charged, cooled pack
Power constraints: limited generator capacity or charging points
Handling: slow swap workflow, connector friction, safety checks
Refill friction: slow pumps, inconsistent mixing station setup
Logistics: repositioning your trailer, water supply, field access
Even practical operator guidance on acres/hour makes this explicit: real coverage depends on “how quick you are at getting it back in the air,” and that ground time adds up — including travel to the spray zone and refill time (AgriSpray Drones, “How Many Acres Per Hour or Day Can a Spray Drone Spray?” (2023)).
Why cycle efficiency matters more than individual endurance
You can model throughput in a way your ops team can measure with a stopwatch:
Cycles per hour = 60 / (cycle time in minutes)
Hectares per hour = (area per cycle) × (cycles per hour)
That’s it. Flight time influences cycle time — but it does not dominate it.
In many real operations, the system behaves like this:
adding a bit of flight time marginally increases area per cycle
but small delays in swap/charge/readiness massively reduce cycles per hour
If you want more hectares per hour, you don’t only need endurance.
You need repeatability.
How Battery Performance Influences Field Output
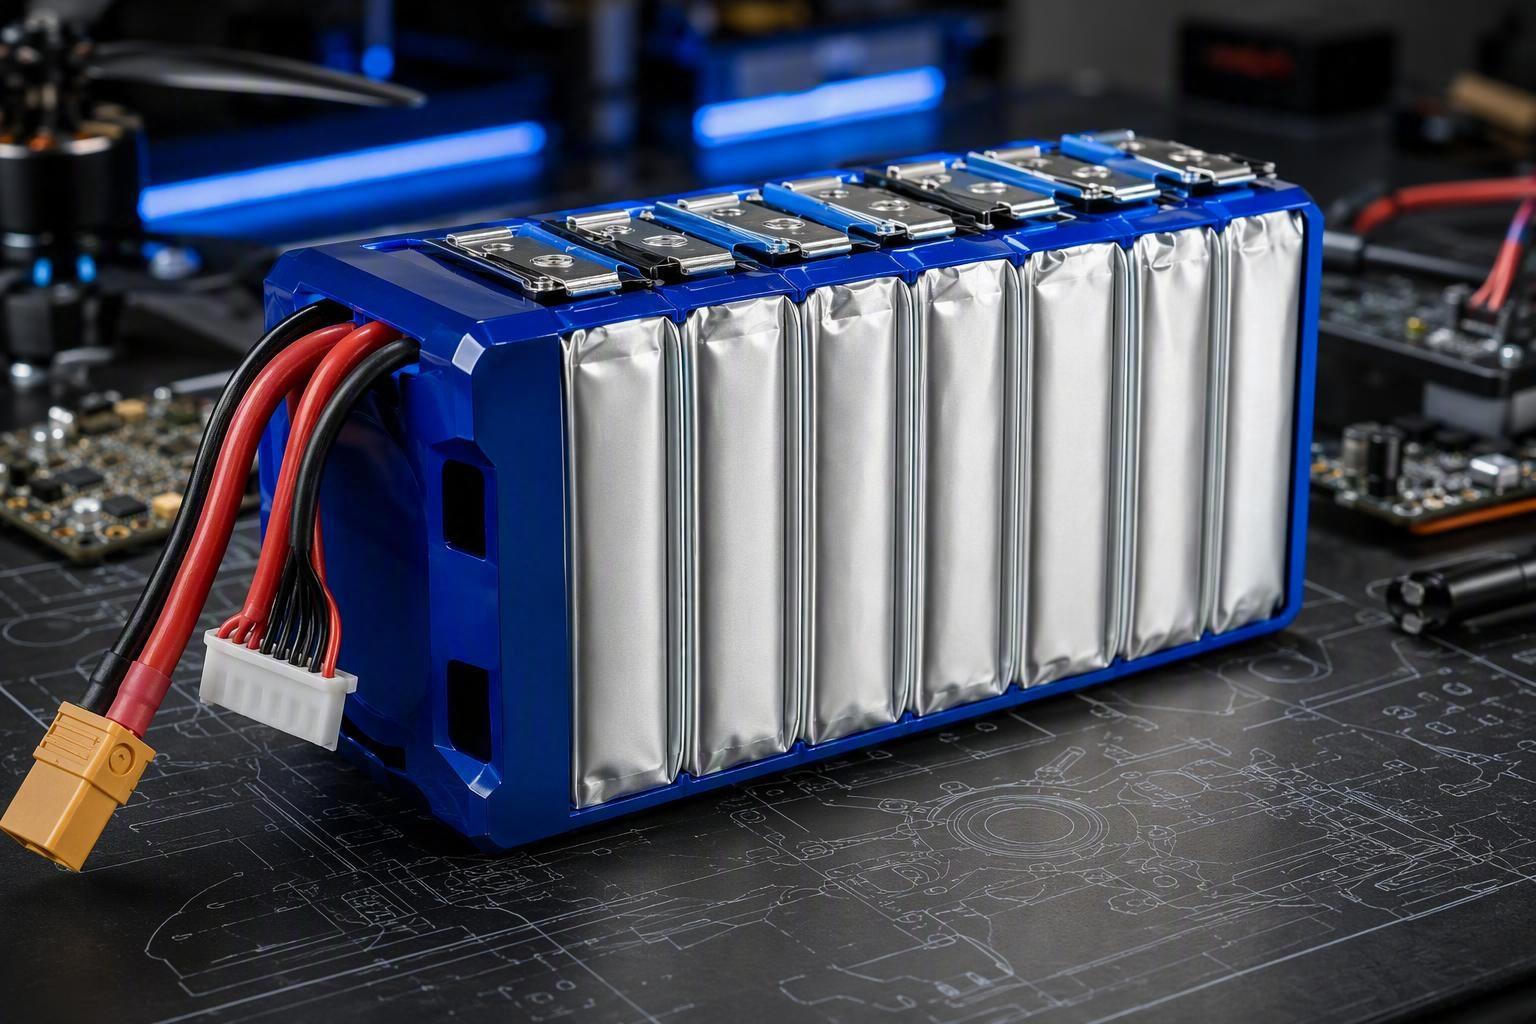
A battery in a spray operation is not just an energy source. It’s a field resource that either keeps the cycle moving or slows everything down.
Faster battery turnaround reduces idle time
“Charge time” on a spec sheet doesn’t tell you whether the pack is actually ready when your team is ready.
What matters is:
ready-to-fly turnaround (including heat limits and any cooldown requirement)
swap time (how quickly a safe swap happens under field conditions)
ready-pack count (how many packs are usable right now, not just owned)
A pack is doing its job when it’s:
ready when the tank is ready
safe to handle at pace
consistent from the first cycle to the last
Stable power delivery prevents mission interruptions
Spec-sheet flight time can hide a practical failure mode operators actually feel: unexpected interruptions under heavy load.
During takeoff and high-load spraying phases, unstable power delivery can trigger reduced performance or protective cutoffs. The result isn’t “a little less endurance.” It can look like:
reduced thrust margin or sluggish response with a full tank
an unexpected return-to-home / landing decision
a mission that ends early, forcing an extra refill, extra swap, and more ground time
From a field-output standpoint, the key question isn’t whether a pack holds voltage in a lab. It’s whether power delivery stays predictable when the drone is doing real work.
Predictable rotation is what keeps the day moving
“Battery availability” isn’t just how many packs you own — it’s how many are ready, safe, and consistent at the moment you need them.
Rotation becomes reliable when:
packs age in a predictable way (so you can plan spares instead of guessing)
health signals are tracked over time (so issues show up before they cost you a cycle)
Metrics That Matter When Evaluating Agricultural Drone Batteries
If you’re comparing packs, don’t ask “which one flies longest?”
Ask: which one helps us cover more ground per hour, with fewer slowdowns?
The four metrics to track
Metric | What it captures | Formula |
|---|---|---|
Hectares per hour | sustained field output | (Area per cycle) × (60 / Cycle time) |
Cycle time (minutes) | end-to-end loop time | Takeoff + Spray + Land + Swap + Refill + Checks + Delays |
Battery availability | whether packs are ready when needed | Ready packs at peak demand / total packs |
Cost per hectare | unit economics you can defend | (Battery cost over life + charging energy + labor + downtime) / total hectares delivered |
These aren’t “battery-only” numbers — and that’s the point. Batteries are purchased to improve mission completion and daily coverage, not to win a spec-sheet contest.
If you want to go deeper later, you can break “availability” into charge-to-ready time, cooldown behavior, and early-warning health signals. But the four metrics above are enough to evaluate most real-world buying decisions without turning your blog into a consulting report.
Choosing Batteries for Higher Field Productivity
At this point, the question isn’t “Is this a good battery?” It’s “Does this battery help us keep the day moving?”
A productive spray drone operation is measured by field output, not by individual flight duration.
So when you choose batteries, prioritize the decisions that increase throughput and reduce exposure:
design your workflow around cycle time
measure “ready-to-fly” availability, not just charge time
manage thermal constraints like a scheduling variable
require evidence for performance under load (not just headline capacity)
If you work with an ODM/OEM partner, the highest-value contribution is often not “a higher spec.”
It’s the ability to validate your KPI assumptions (cycle time, pack readiness, monitoring expectations, compliance documentation) and build packs and charging workflows that behave predictably at fleet scale.
Battery partners with true ODM/OEM capabilities can support this through customized pack development, validation, and manufacturing consistency for industrial applications.
A practical procurement check
Before you commit to a pack supplier (or a new spec), ask for answers you can verify in the field:
What is the ready-to-fly turnaround under your real conditions (including heat buildup and cooldown limits), not just “charge time” in a lab?
How many packs will be ready at peak demand with your current chargers and power source?
Under full payload, does the pack show any early returns, protection events, or unexpected mission stops?
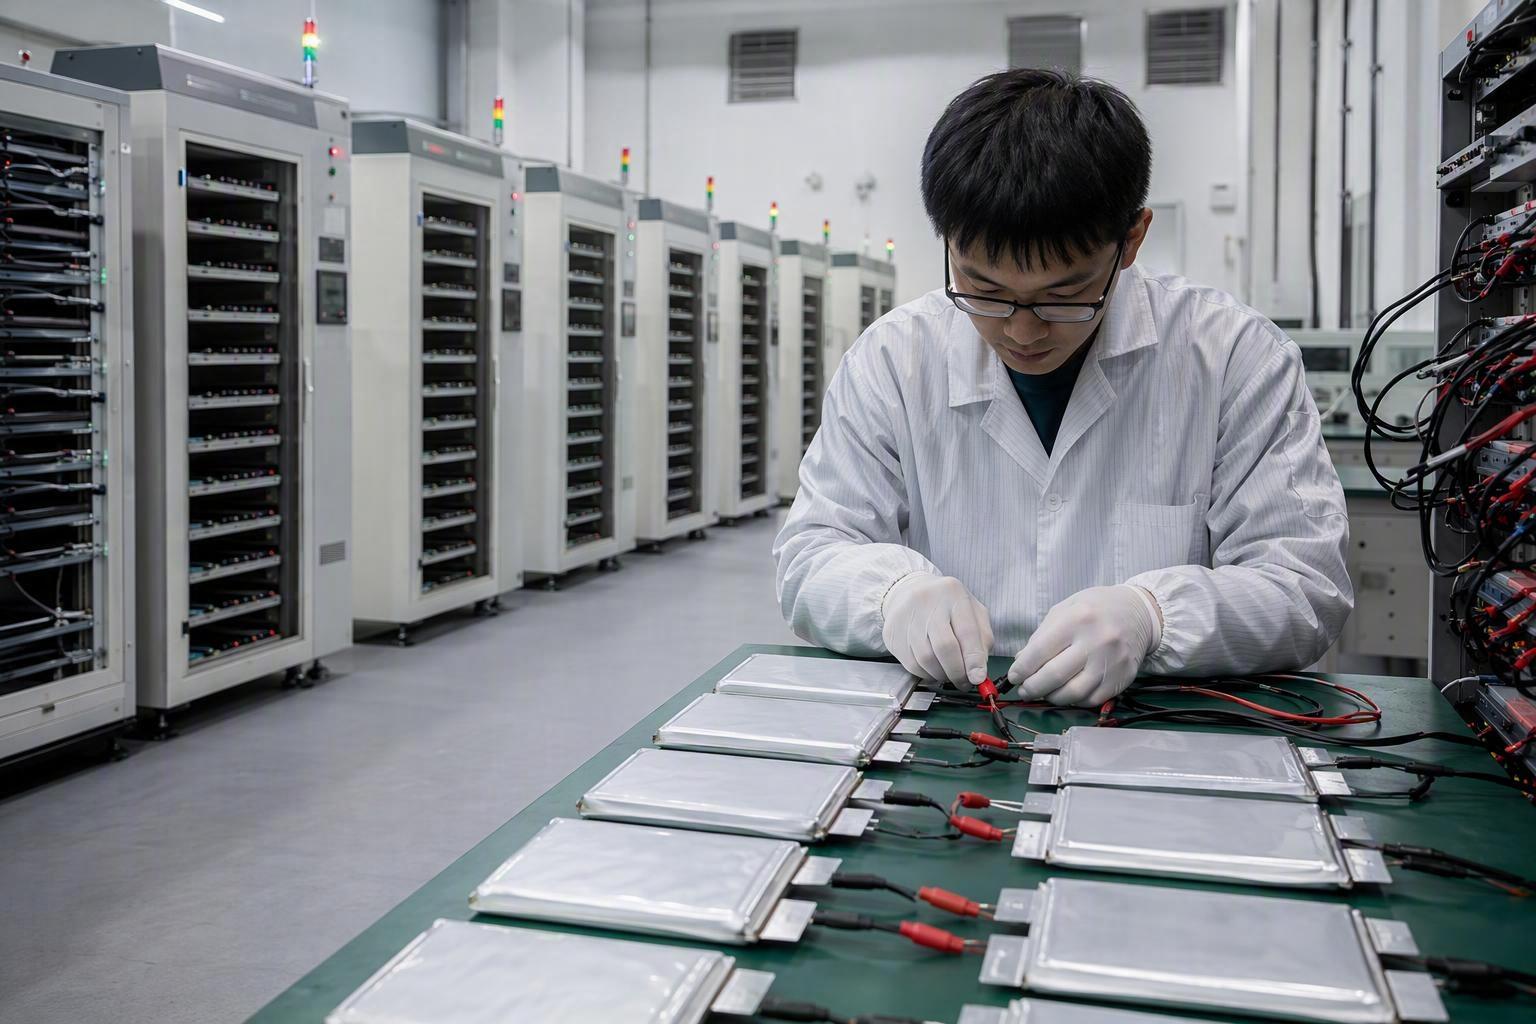
What evidence will you receive and review (for example, temperature history, fault logs, state-of-health trend, and the warranty/acceptance terms tied to real usage) — and who owns that review in your team?
If a supplier can’t support those questions with test conditions, logs, and a clear operating plan, the headline flight-time number is likely hiding a readiness bottleneck.
 العربية
  English
  Español
  한국어
한국어  Deutsch
  Français
  日本語
日本語  Русский
  Bahasa Indonesia
  ไทย
ไทย  Português do Brasil
  Italiano
  Nederlands