















Your supplier sends a qualification sheet that opens with a clean statement: “This cell delivers 2,000 cycles.”
It reads like a simple, decisive fact. In practice it prompts several questions you cannot answer from the number alone. At what charge rate? At what discharge rate? At what depth of discharge? At what temperature? Across which voltage window? At what capacity-retention threshold is the test stopped? And how many cells were actually tested?
A cycle-life number is only meaningful when the conditions behind it are clear. This article gives you a repeatable way to read a battery cycle-life report so you can tell whether a supplier’s claim reflects your application. You will learn what a cycle-life number actually represents, which test conditions to check, how to judge whether the testing was statistically credible, and how to decide whether the result should influence a sourcing decision.
What Does “Cycle Life” Actually Mean?
Cycle life is frequently treated as a simple capacity tag. In practice it is a conditional result: the number of charge–discharge events a cell sustains before it reaches a defined end-of-life threshold under explicitly stated conditions. Without those conditions, two cells that both claim “2,000 cycles” may have very different useful lives.
Cycle Count Is Not the Same as Useful Life
A claim of “2,000 cycles” does not by itself mean the cell can provide 2,000 full-performance cycles. You need to know the point at which the test was stopped. A “2,000-cycle” result measured to an 80% retention threshold is not directly comparable with one measured to a 90% threshold.
Capacity Retention Defines the Result
Capacity retention is the remaining capacity divided by the initial capacity, expressed as a percentage. For example, a test record might show 92% after 1,000 cycles, 85% after 1,500, and 78% after 2,000. That is why “2,000 cycles” does not automatically equal “2,000 useful cycles” — the figure only becomes useful once you know the retention threshold at which the test stopped.
What Does End of Life (EOL) Mean
80% capacity retention is commonly used as a reference point for defining end of life, but the actual EOL criterion should be defined by the application or the applicable test specification. Some systems retire a battery on capacity alone, while others care more about power capability or rising internal resistance. State the threshold explicitly when you evaluate a datasheet, and ask the supplier to do the same. A report that does not define its end-of-life criterion makes the reported cycle number difficult to interpret.
Check the Charge and Discharge Rate
Rate is one of the first test conditions you need to align when comparing cycle-life results.
What Does C-Rate Mean
C-rate expresses current relative to the cell’s rated capacity. 1C is roughly the current that discharges a full cell in about one hour, 0.5C in about two hours, and 2C in about half an hour. Higher charge or discharge rates generally increase electrical and thermal stress on the cell.
Charge Rate and Discharge Rate Are Not the Same
A supplier can write “1C cycling” without telling you which leg of the cycle is at 1C. A result from a 1C charge plus 1C discharge is not interchangeable with a 0.5C charge plus 2C discharge. Ask whether both current steps match the duty your system actually runs.
Match the Test Rate to the Application
Energy-storage batteries commonly operate at lower rates, while industrial drones and heavy equipment pull higher, more transient loads. A 0.5C cycle-life result should not be treated as automatic evidence of performance at 2C or 3C. When the tested rate is gentler than your real duty, treat the result as evidence under a different operating condition rather than a direct prediction of field life.
Confirm the charge rate and the discharge rate separately, and compare both to the rates your application actually demands.
Check DoD and the SOC Operating Window
Depth of discharge changes cycle-life results more than many datasheets make obvious.
What Is DoD
Depth of discharge (DoD) is the share of a full cycle actually used. A 100% DoD test uses the full specified operating window, from the upper SOC limit to the lower SOC limit. An 80% DoD test uses 80% of the specified usable capacity within that operating window.
Why DoD Changes Cycle-Life Results
Deeper cycling typically delivers more usable capacity per cycle, but it also increases electrochemical stress and can accelerate degradation. Shallow cycling generally favors longer life. The relationship is real, but it is not a fixed number you can assume — the effect should be verified, not guessed.
Look at the Actual SOC Window
DoD is one way to describe operation; an explicit state-of-charge window is more precise. A “100% DoD” claim and a “20%–80% SOC” window describe different operating methods even when numbers look similar. A complete report should state the initial SOC, the upper SOC, the lower SOC, and the equivalent DoD so you can map the test onto your real voltage and charge envelope.
Check the Test Temperature
Laboratory temperature is often treated as a universal baseline. It rarely matches the field.
25°C Does Not Represent Every Application
A lab result at 25°C ambient is not a prediction of behavior inside an enclosed energy-storage cabinet, under an outdoor UAV on a hot day, or in high-current industrial equipment. In any of these, the cell can run measurably hotter or colder than the sheet’s reference.
Ambient Temperature vs. Cell Temperature
Ask whether the reported “25°C” is the chamber ambient temperature or a temperature measured at the cell surface. The two can differ, and the distinction affects how the test conditions should be interpreted. When a report lists only a single temperature with no basis, ask which one it is.
Consider High- and Low-Temperature Operation
Elevated temperature tends to accelerate the aging mechanisms that shorten useful life. Low temperature can raise resistance, reduce available performance, and, when charging, introduce additional degradation or safety concerns. Avoid assuming a simple universal rule like a fixed doubling for every 10°C rise — treat temperature response as condition-specific and verify it against the relevant range for your site.
Check the Upper and Lower Voltage Limits
Cycle-life testing always runs inside a defined voltage window, and that window shapes the result.
Why Voltage Window Matters
The window limits how much of the electrode’s usable range is exercised, which influences usable capacity, electrode stress, and aging behavior. A report should state the exact limits, not imply them from a nominal cell voltage.
Check the Charging Cut-Off Voltage
Different upper voltage limits can produce different capacity and aging results. This is not about accusing a supplier of manipulating data. It is about recognizing that a cell charged to one cut-off is not being tested under the same conditions as one charged to another.
Check the Discharge Cut-Off Voltage
The lower limit changes usable energy and, in some chemistries, how hard the electrodes are cycled. A report that omits it leaves an important boundary unverified.
Compare the Test Window With Your BMS
The most engineering-relevant check is whether the test voltage window matches the limits your battery management system (BMS) will enforce in production. If it does not, the cycle-life number may not represent real-life system-level performance, because the report describes a cell under one set of limits while your product runs under another.
Do Not Ignore the Test Protocol
A professional report cannot stop at “1C / 1C / 25°C / 80% DoD.” You need to know how the cell was cycled.
Charging Method
Confirm whether charging used a constant-current/constant-voltage (CC-CV) profile and how the charge cycle was terminated.
Discharge Method
Discharge can be performed at constant current, constant power, a mission-specific profile, or a pulsed load. Different methods can produce different results, so the method should match how your system draws power.
Rest Time Between Steps
Heat, polarization, and measured capacity all depend on the rest between charge and discharge steps and between discharge and charge. A report should record the rest duration rather than leave it unstated.
Test Equipment and Measurement Method
The report should identify the measurement method and confirm that the equipment and calibration were appropriate for the test.
Look at the Degradation Curve, Not Just the Final Number
One of the most useful ways to read a cycle-life report is to look at the degradation curve, not just the final cycle count.
Capacity Retention vs. Cycle Count
Plot capacity retention against cycle count and ask what the curve looks like. A smooth, gradual fade, an accelerated bend late in life, or a sudden drop all reveal different behavior that a single “2,000 cycles” headline hides.
A Final Number Can Hide What Happened in the Middle
Two cells can share an identical final number yet age completely differently. One might hold 95% at 500 cycles, 91% at 1,000, 86% at 1,500, and 80% at 2,000. Another might stay at 97% through 500, 94% at 1,000, 92% at 1,500, and only reach 80% at 2,000. The end value matches, but the degradation behavior does not — and that difference matters for predicting when performance becomes a problem in the field.
Track Internal Resistance / DCIR
Capacity is not the only indicator of aging. A rising DC internal resistance (DCIR) can mean higher voltage sag, more heat under load, and reduced power capability before capacity loss becomes obvious on its own. This matters most for high-power applications such as industrial drones, where available power and voltage margin can fade faster than total capacity.
Check for Physical Changes
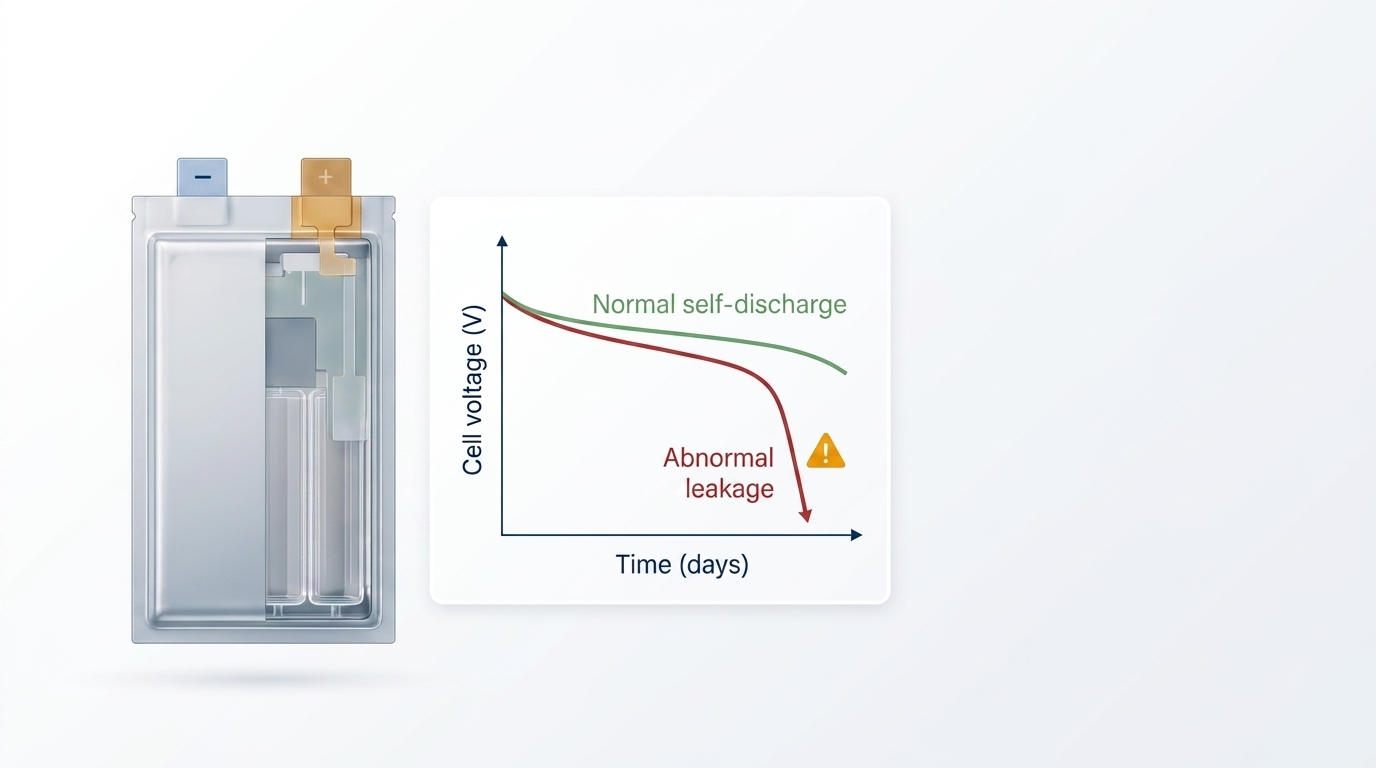
Watch for signs such as swelling, leakage, deformation, or abnormal temperature rise during or after testing. A cell that technically reaches the target cycle count but develops abnormal physical or electrical behavior should not automatically be counted as a successful result.
Check Sample Size and Batch Representativeness
A convincing single curve can still be statistically weak if it came from the wrong sample.
One Cell Does Not Represent a Production Batch
A single-cell result demonstrates what one cell achieved. It does not establish batch-level consistency, and manufacturing can produce meaningful cell-to-cell variation within the same run.
Ask How Many Cells Were Tested
There is no single universal minimum, but sample size needs to be appropriate for the purpose: qualification, supplier approval, batch validation, or building statistical confidence. The right number depends on the risk of the decision you are making.
Ask for Individual Data, Not Only Average Results
An average capacity-retention figure can mask a wide spread. Look for individual results, the mean, the variation, outliers, and any failed or discarded samples rather than accepting a single headline average.
Check Batch Information
Production batch, manufacturing date, and sample traceability let you judge whether a lab result is actually relevant to the cells you would receive. A result divorced from batch context has limited sourcing value.
Can You Compare Two Suppliers’ Cycle-Life Claims?
Compare the test conditions first, and compare the cycle count second.
Consider two offers. Supplier A claims 2,000 cycles; Supplier B claims 1,500. Supplier A looks better until you inspect the details:
Condition | Supplier A | Supplier B |
|---|---|---|
Charge rate | 0.5C | 1C |
Discharge rate | 0.5C | 2C |
DoD | 80% | 100% |
Temperature | 25°C | 35°C |
EOL threshold | 80% | 80% |
Because the test conditions differ materially, the two numbers cannot be compared directly. Supplier B’s 1,500 cycles are being demonstrated under a more demanding test profile, so the lower headline number does not necessarily indicate weaker cycle-life performance. Compare the test conditions first, and compare the cycle count second.
A cycle-life claim only becomes comparable to another after you align the conditions, the EOL threshold, and the degradation data behind each one.
A Practical Supplier Cycle-Life Report Checklist
Use this checklist when reviewing a supplier’s cycle-life report.
Test conditions
Charge rate
Discharge rate
DoD / SOC window
Test temperature
Upper voltage limit
Lower voltage limit
Charge protocol
Discharge protocol
Rest time
End-of-life definition
Initial capacity
Capacity retention
EOL threshold
Cycle count at EOL
Applicable standard or specification
Data credibility
Number of cells tested
Production batch
Individual cell results
Capacity degradation curve
DCIR / resistance trend
Temperature records
Physical inspection
Abnormal or failure records
Application relevance
Does the test match the real charge rate?
Does the test match the discharge profile?
Does the DoD match the actual SOC window?
Does the temperature represent the operating environment?
Do the voltage limits match the BMS?
What to Ask a Battery Supplier Before Accepting a Cycle-Life Claim
When the checklist flags unanswered questions, turn them into direct supplier questions:
What charge and discharge rates were used?
What DoD or SOC window was tested?
What was the test temperature, and was it ambient or cell temperature?
What were the upper and lower voltage limits?
What capacity-retention threshold defines end of life?
How many cells were tested?
Were the samples from the same production batch?
Can you provide the capacity-retention curve rather than only the final number?
Can you provide DCIR or resistance data over cycles?
How does the test profile compare with our application?
Clear answers to these questions make the cycle-life result much easier to evaluate. If any of these points are missing, ask the supplier to clarify them before using the cycle count in a sourcing decision.
How Herewin Approaches Cycle-Life Validation
Cycle-life validation is most meaningful when it starts with the application rather than with a headline cycle count. For a custom battery project, the first step is to define the operating profile — the required charge and discharge rates, SOC window, temperature range, voltage limits, and expected service life — and only then select the cell chemistry, cell design, pack configuration, and validation plan. This is the sequence our engineers follow in validation, and it is the same discipline worth carrying into any report you review.
A cycle-life result is never a standalone specification; it is always the product of a defined test protocol, an operating window, and an end-of-life criterion. So rather than trusting a headline count at face value, apply the checks laid out in the sections above — on rate and duty cycle, DoD and SOC window, temperature, voltage limits, the degradation curve, and the sample — because each one changes what that number is really telling you.
One boundary applies regardless of who ran the test: a cell-level cycle-life result is not automatically a pack-level service-life guarantee, because pack design, thermal management, cell matching, BMS limits, and real operating conditions add variables that no single datasheet number can capture.
If you are evaluating a cycle-life claim and are unsure whether the test conditions match how the battery will really be used, the Herewin team can help you work through that question with your operating profile in hand. A supplier’s “2,000-cycle” claim is only the beginning of the evaluation, not the conclusion.






 العربية
  English
  Español
  한국어
한국어  Deutsch
  Français
  日本語
日本語  Русский
  Bahasa Indonesia
  ไทย
ไทย  Português do Brasil
  Italiano
  Nederlands