





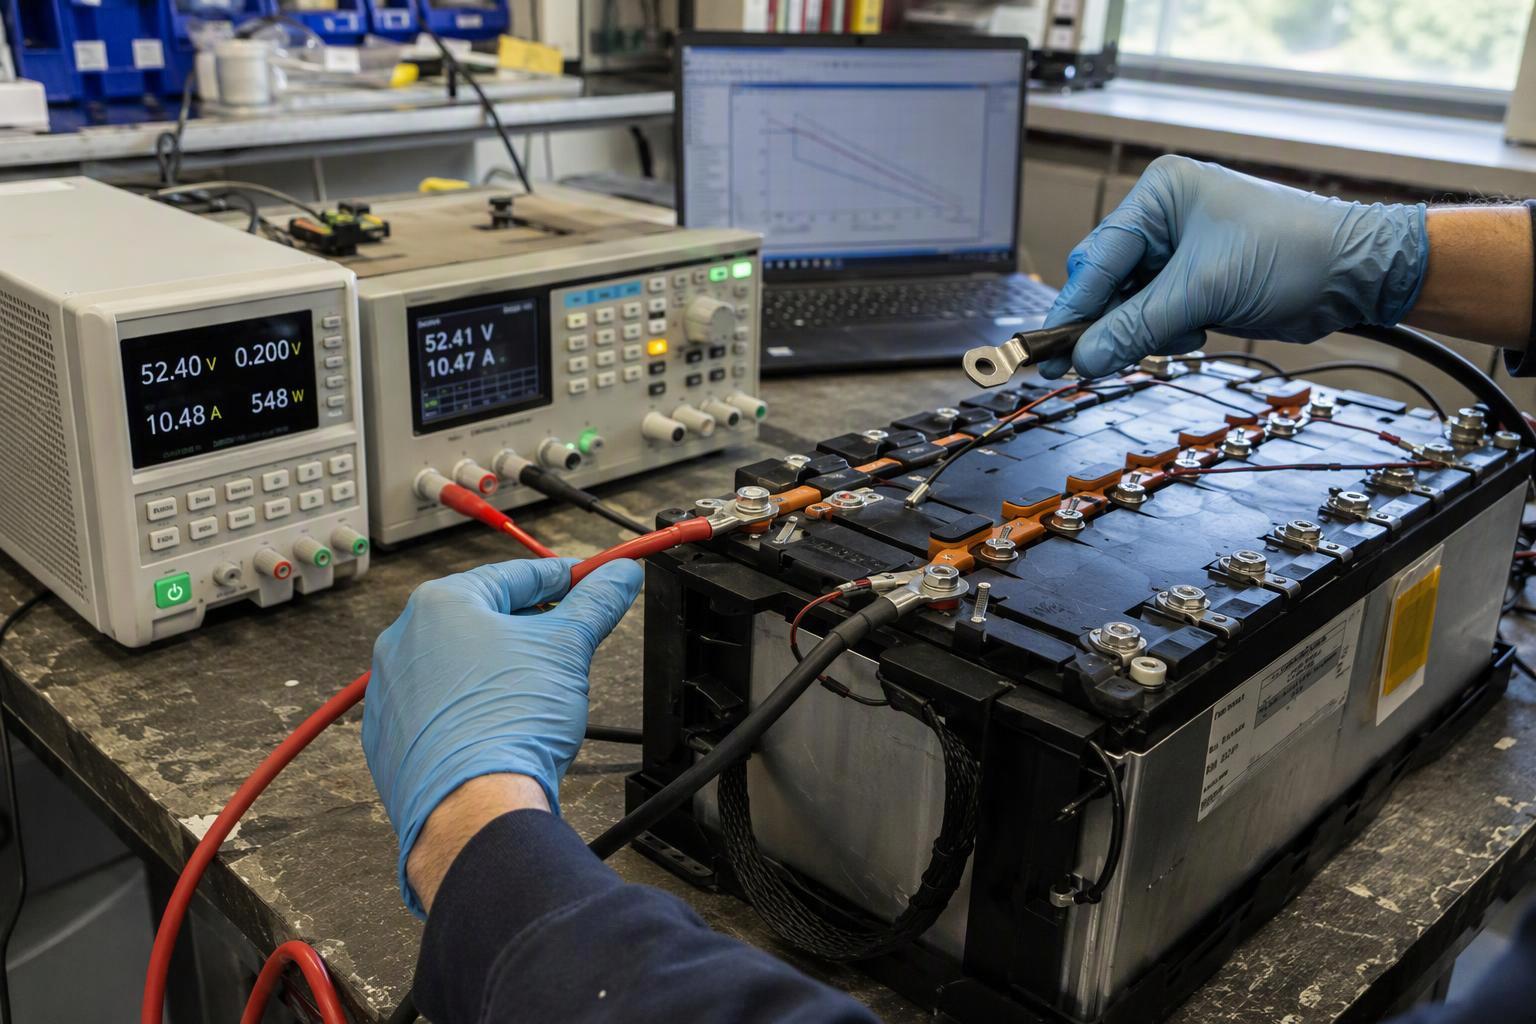
A battery pack can pass its rated capacity test and still fail the moment it powers real equipment. If you’ve ever commissioned a pack, the symptoms will look familiar. Voltage drops sharply under load. The system hits its low-voltage cutoff earlier than expected. The pack runs hot during high-current operation. In many of those cases the pack isn’t weak in the way the datasheet implies, because it delivered its ampere-hours on the bench.
So the problem usually isn’t a capacity shortfall. It’s power capability for the actual load profile. You can see the mismatch in the test conditions themselves: a capacity test measures how much charge a cell can release under near-equilibrium conditions, not how it behaves under high current.
This article looks at the problem at both the cell and the pack level. A pack’s load performance depends not only on cell characteristics but also on current paths, BMS limits, connectors, thermal design and series–parallel configuration. Keep that two-level view in mind as the discussion moves between electrode behavior and pack construction.
What Does a Battery Capacity Test Actually Measure?
A capacity test measures how much charge a cell can store and release under near-equilibrium conditions. It doesn’t characterize how the cell behaves under high current. The number on the datasheet comes from a slow, controlled discharge, not from the way the equipment actually draws current.
IEC 61960-3:2017 makes the definition explicit. It defines rated capacity as the quantity of electricity C₅ Ah a cell can deliver over a 5-hour period under specified charge, storage and discharge conditions, and its Clause 7.3.1 test discharges at a constant 0.2 It A at 20 °C ± 5 °C to a specified final voltage. In other words, rated capacity is defined under specified, relatively mild test conditions — which is exactly why it can’t be read as an on-load capability. Different standards and applications also use different test currents and cutoff voltages, so the same term “rated capacity” can carry a different time base from one document to the next, and a bare capacity figure is hard to compare across vendors.
Put simply, a capacity figure without its test current, temperature and cutoff voltage is not a specification you can compare.
Why Capacity Does Not Guarantee Power Capability
That measurement gap has a physical cause: the two quantities are not the same thing. Battery capacity is commonly expressed in ampere-hours (Ah), while battery energy is expressed in watt-hours (Wh). Power is the rate at which energy is delivered and is expressed in watts (W). The relationship between voltage, capacity and energy built into those units is covered in our guide to how battery voltage and capacity actually relate.
The practical point is narrow. A battery can have sufficient energy but insufficient power capability for a specific load. A cell can pass a 0.2C capacity test and still fail on the machine, because the test never asked it to deliver current quickly. The difference between the two shows up in how each is defined and tested.
|
Attribute |
Capacity |
Power capability |
|---|---|---|
|
What it describes |
How much charge the cell can store and release |
How fast it can deliver that charge to a load |
|
Typical unit |
Ampere-hours (Ah) |
Amperes (A) or C-rate |
|
Governing test |
Slow discharge near equilibrium (for example 0.2C over 5 hours) |
Pulse or sustained high-current discharge |
|
Fails to capture |
On-load voltage sag and heat |
Total stored energy and runtime |
|
Typical datasheet risk |
Quoted without test current, temperature or cutoff voltage |
Quoted as a peak C-rate without duration or starting conditions |
The two selection models diverge at the electrode. Research comparing cells built for different power-to-energy ratios finds a consistent trade-off: high-power cells use thinner electrodes, smaller active-material particles and lower coat weights, while high-energy cells pack in more active material per unit area. Thicker electrodes can improve energy density but increase transport limitations under high current. That is why Ah alone cannot distinguish a high-energy cell from a high-power cell: two cells of identical capacity can behave completely differently under load.
The penalty for ignoring this scales with current. Resistive heat generation follows P loss = I²R, so a 3× current increase produces roughly 9× resistive heating. A cell that runs warm at 5 A may run hot at 15 A, and the heat is generated inside the cell where it cannot be removed quickly.
An illustrative example makes this concrete. Take two 5 Ah cells with different DCIR, both asked to deliver 20 A:
|
|
Cell A |
Cell B |
|---|---|---|
|
Capacity |
5 Ah |
5 Ah |
|
DCIR |
10 mΩ |
30 mΩ |
|
Load |
20 A |
20 A |
|
Approx. I×R sag |
0.20 V |
0.60 V |
|
I²R loss |
4 W |
12 W |
This is an illustrative example only; actual voltage response also includes electrochemical polarization.
Capacity-first selection is genuinely adequate in some applications. A pack that runs at a steady low rate, well inside its continuous current rating, with generous thermal headroom and a cutoff voltage far below the equipment’s minimum input, will be governed by energy rather than power. The failure mode described here appears when the load profile includes transients, cold starts or sustained high current.
What Causes Battery Voltage to Drop Under Load?
Battery voltage drop under load separates into three components, each appearing on a different timescale and each with a different fix. Under load, terminal voltage approximates V term ≈ V OCV(SOC) − ΔV ohmic − ΔV ct − ΔV conc, with the three sag components separated by timescale (MDPI Batteries 9(11):529).
Internal resistance and DCIR
DCIR is a large-signal, time-dependent resistance measurement: apply a defined DC current step or pulse, measure the terminal-voltage response, and calculate R = ΔV / ΔI. A 10-second DCIR means the voltage is evaluated after a 10-second pulse, and the value is not a universal intrinsic resistance; voltage may be sampled at multiple times such as 100 ms, 1 s and 10 s. The practical takeaway is blunt: a DCIR result is meaningless without its pulse length, starting SOC and temperature.
The ohmic step is the instantaneous part of the voltage drop that appears the moment current begins. In the pack it is dominated by the electronic path: electrode foils, tabs, welds, busbars, fuses, cables, connectors and contactors. A pack’s total sag is the sum of those resistances times current, so a resistance negligible at 10 A can become a major loss at the hundreds of amps drawn by high-power equipment. At an illustrative 300 A, a single milliohm of pack resistance costs 0.30 V and 90 W of heat.
Pack construction matters here. Busbar resistance and series–parallel topology affect pack performance and current sharing, which means two packs built from the same cells can sag differently depending on how the current is routed between them.
Electrochemical polarization
Charge-transfer polarization develops over milliseconds to seconds as the electrochemical reaction at the electrode surface tries to keep up with the demanded current. It is a kinetic limit, not a wiring problem, and it worsens sharply at low temperature and low state of charge.
Studies of charge-transfer behaviour show that this resistance can become a dominant component of total resistance under low-temperature and low-voltage conditions. That pattern explains a common field observation: a pack that performs acceptably at 25 °C and mid-SOC collapses when the same mission is flown cold or run deep into the discharge. Aged cells can also show increased impedance even when their remaining capacity does not fully explain the loss of high-rate performance, so a capacity check alone may miss the cause.
Concentration polarization
Concentration polarization dominates over seconds to tens of seconds under sustained load, as lithium-ion concentration gradients build up in the electrolyte and the electrode particles. It is the slowest of the three components and the one that punishes a long high-current draw rather than a short pulse. It is what makes a sustained climb, a heavy payload hover or a long acceleration different from a brief transient: voltage keeps falling after the initial step and recovers slowly once the load is removed, because the gradient has to relax. Polarization does not scale linearly with current, either — doubling the current typically raises the polarization overpotential by more than a factor of two, which is why a low-rate test hides it almost completely while a high-current load amplifies it sharply.
Temperature and SOC effects
Temperature and state of charge change all three components at once, which is why a DCIR figure quoted at one condition tells you very little about another. The charge-transfer share of total resistance grows at low temperature and low voltage. The resistance contribution from metallic current paths is generally less temperature-sensitive than the electrochemical components, although total DCIR and the ohmic contribution from the electrolyte, electrodes and separator still change with temperature.
The standards reflect this by testing across a matrix rather than at a single point. IEC 62660-1:2018 runs its capacity tests at 0 °C, 25 °C and 45 °C, and its power test matrix covers SOC 20% at 25 °C, SOC 50% at −20 °C, 0 °C and 25 °C. A single DCIR number at 25 °C and 50% SOC does not describe the cold-start case.
Why loaded voltage is different from OCV
Open-circuit voltage primarily reflects the cell’s state of charge under a defined temperature and a sufficiently rested condition, since no current flows and no polarization builds up. Once current flows, terminal voltage drops below OCV by the sum of the three components, and the gap widens with current, cold and depth of discharge. That is why a pack can read a healthy 3.7 V per cell at rest and still trip the equipment’s low-voltage cutoff seconds after the load engages.
Why a Battery Can Still Have Energy Left but Stop the Equipment
The equipment stops when terminal voltage crosses its minimum input, not when stored energy runs out — and those two thresholds are usually far apart. Remove the load, and the pack recovers to a healthy resting voltage. That’s exactly why the failure looks like a fault rather than an empty battery.
The cutoff itself is a protection action. A BMS disconnects the load on over-current or low-voltage limits, protecting against unsafe voltage or current rather than measuring remaining energy. Depending on the pack architecture and protection strategy, low-voltage protection may be triggered by an individual cell, a parallel group or a pack-level threshold. In a pack with even modest cell-to-cell variation, the weakest group can reach the threshold while the rest of the pack still holds usable charge.
The end-of-discharge voltage that triggers this is a specified value, not a universal one, so the same cell can be declared empty at one cutoff and half-full at another. When the equipment’s minimum input voltage sits above the pack’s loaded voltage at end of mission, the machine stops early and the remaining ampere-hours are stranded.
What this looks like in a UAV
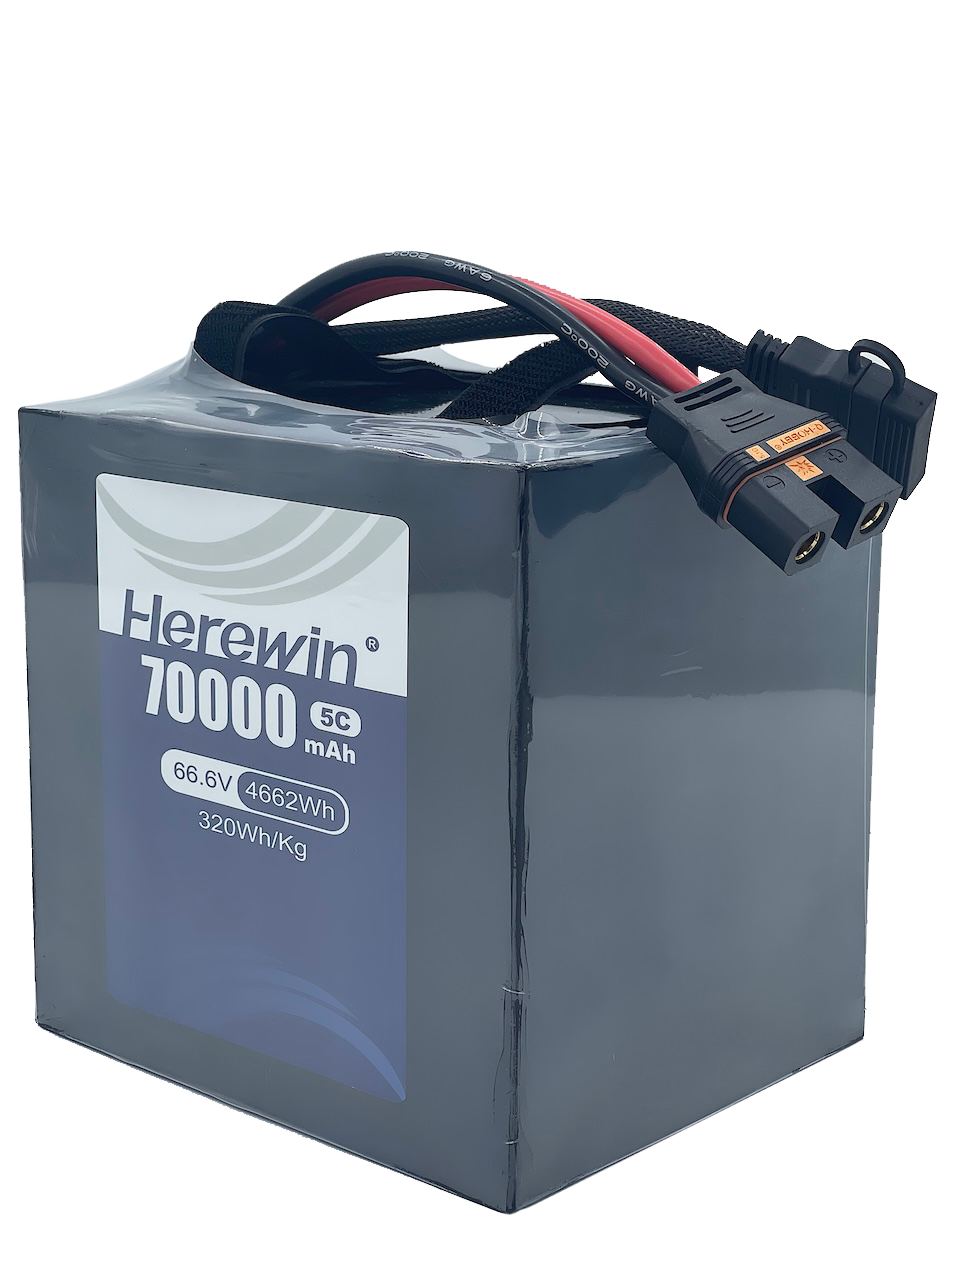
A multirotor draws a large, spiky current during takeoff, climb and aggressive maneuvering, a steadier but still high current during a loaded hover, and its worst sag at the end of the flight when the pack is both warm and partly discharged. Repeated flight cycles tighten that margin as the pack ages.
Take a typical agricultural or inspection mission. The current trace is not a flat line: a short takeoff burst, a sustained climb, a heavy spray or sensor pass, sharp maneuvering, then a return leg flown on a partly discharged pack. A bench capacity test never reproduces that profile, because it draws a steady low current from a full pack at room temperature. That is exactly why a pack can pass its capacity test and still fail the mission.
The relevant question is not simply whether the pack has enough Ah for the planned flight time, but whether it can maintain the required voltage during the highest-power portions of the flight. In practice the pack hits the low-voltage cutoff under load, the flight controller sees the voltage collapse and commands a landing or the BMS cuts the circuit, and the pack reads a comfortable voltage on the bench minutes later. The energy was there; the power capability at that SOC and temperature was not. Our industrial UAV battery selection guide walks through how voltage level and current demand interact across a full mission.
How to Test Battery Power Capability
Four test methods characterize power capability, and each answers a different question: DCIR measures resistance under a specified pulse, pulse discharge or HPPC maps peak power against SOC and temperature, continuous discharge reveals sustained power, usable capacity and thermal burden, and real load-profile testing reproduces the actual mission.
DCIR is the fastest screen. Apply a controlled current pulse at a known SOC and temperature, sample the voltage response, and calculate R = ΔV / ΔI. Because the result depends on pulse length and sampling time, record both alongside the number.
Pulse and continuous tests answer the two halves of the rating. IEC 62660-1:2018 defines its power density test as a 10-second discharge at the manufacturer-specified maximum discharge current, with the voltage measured at the end of the pulse (IEC 62660-1:2018). A continuous discharge test then shows what the cell can hold for minutes rather than seconds, and how much of its rated capacity remains usable above the equipment’s cutoff.
Real load-profile testing is the only method that closes the loop. It replays the actual current trace, including transients and rest periods, and reports whether terminal voltage stayed above the equipment’s minimum input for the whole mission. ISO 12405-4:2018 provides the pack-level framework, with preconditioning at 2 C for high-power packs and C/3 for high-energy packs, a standard discharge at 1 C or the supplier-specified rate, and room temperature defined as 25 ± 2 °C (ISO 12405-4:2018).
Continuous vs Peak Discharge Capability
Continuous and peak discharge capability are two separate constraints, not one C-rating, and treating them as interchangeable is how packs get specified into failure. Continuous discharge current is the current a cell or pack can supply for the required sustained period within temperature, voltage and life limits; peak or pulse current is permitted only for a specified short duration under specified starting conditions.
The two are easy to confuse because both are often printed as a single C-rate, but they describe different things:
|
|
Continuous discharge |
Peak / pulse discharge |
|---|---|---|
|
Time scale |
Minutes to the full mission |
Seconds |
|
Main limitation |
Heat accumulation, voltage and aging limits |
Voltage sag, electrochemical kinetics and short-term thermal limits |
|
Typical quoted unit |
C-rate or amps sustained |
C-rate or amps for a pulse |
|
What a buyer must ask |
Temperature limit and cutoff voltage |
Pulse duration, rest period, starting SOC and temperature |
|
Failure if misused |
Overheating and reduced cycle life |
Voltage collapse or a protection trip |
C-rate converts capacity into current: I = C rate × Q Ah, so a 5 Ah cell at 2C continuous is nominally a 10 A cell. The arithmetic is simple; the trap is that a peak rating quoted as a C-rate without a duration, a starting SOC or a temperature limit cannot be converted into a duty cycle.
A complete peak rating needs more than a number. The maximum discharge current should be specified together with the continuous discharge value, the pulse discharge value and its length, and the applied temperature and SOC range. Most datasheets fall short of that, which is why a bare peak C-rate is so hard to work with.
The thermal reason for the split is straightforward. Resistive heating rises with the square of current, so a peak pulse generates heat far faster than the continuous rating does, and the cell’s thermal mass decides how long it can absorb that heat before the temperature limit is reached. A peak rating is therefore a condition-specific statement about how much current the cell or pack can deliver for a defined duration without exceeding its electrical, thermal or safety limits, not a steady-state capability.
How to Select a Battery for a High-Power Application
Selection starts from the load profile, not from the capacity column. Write down the continuous current, the peak current and its duration, the minimum input voltage of the equipment, the ambient temperature range and the required runtime, then check each against the pack’s ratings at the relevant SOC and temperature.
The current numbers alone are not enough; what matters is when they are demanded, for how long, and how often they repeat. Record the load as a duty cycle, for example: 20 A continuous for 5 min → 40 A peak for 5 s → 15 A cruise → repeat. That sequence, not a single current figure, is what the pack has to survive, and it is what decides whether the continuous or the peak rating is the real constraint.
The first filter is the continuous rating at the worst-case temperature. For example, an illustrative pack rated for 26 A continuous with a defined 90 °C surface-temperature limit is not directly comparable with a pack advertised as 35 A maximum with no pulse rating stated — a rating only means something when its qualifying condition is stated alongside it.
The second is the loaded voltage at end of mission. Compare the pack’s terminal voltage at the lowest expected SOC and temperature against the equipment’s minimum input, and leave margin for cell-to-cell variation and aging: a pack that only just clears the threshold when new will not clear it after a few hundred cycles. The third is the thermal path. Because heat generation scales with I²R, a pack run at the edge of its continuous rating in a hot enclosure accumulates temperature over a shift, so check temperature rise over the pulse rather than the current number alone.
The last filter is honesty about the application. If the load is steady, low-rate and thermally comfortable, capacity-first selection is the right call and a high-power cell buys nothing extra. Power-first selection is for the case with transients, cold starts or sustained high current.
When the load profile is demanding, the answer is rarely a stock part. A pack that holds its voltage across the full duty cycle needs the right cell, the right series–parallel topology and the right thermal path chosen together — the process described in our guide to UAV battery design requirements and custom pack development.
What Battery Test Data Should You Ask a Supplier For?
Ask for the test conditions, not just the test results, because a power figure without its conditions cannot be checked against your mission. Most manufacturers omit exactly the parameters a buyer needs to compare products. If you are comparing two suppliers, ask both to report the same test conditions before comparing the numbers; a DCIR value measured at one SOC and temperature is not comparable with one measured at another.
|
What to request |
Minimum conditions to specify |
Why it matters |
|---|---|---|
|
DCIR |
Pulse duration, measurement point, starting SOC and temperature |
DCIR is time-dependent; a number without its pulse conditions is not comparable |
|
Continuous discharge |
Current, temperature limit and cutoff voltage |
Defines the sustained rating the equipment will actually see |
|
Peak / pulse discharge |
Current, pulse duration, rest period, starting SOC and temperature |
A peak rating without duration cannot be converted into a duty cycle |
|
Discharge curves |
Voltage-vs-capacity curves at your expected C-rates and temperatures |
Shows loaded voltage across the whole mission, not just at one point |
|
Temperature rise |
Cell or surface temperature over the pulse and over a full cycle |
Heat generation scales with I²R and drives derating |
|
BMS limits |
Over-current and low-voltage thresholds, and whether cutoff is per-cell or pack-level |
Determines when the equipment stops relative to stored energy |
|
Cell and pack configuration |
Series–parallel topology and busbar design |
Topology measurably affects current sharing between parallel cells |
The standard for a complete rating already exists. IEC 62660-1 reports power density across a defined SOC and temperature matrix, and ISO 12405-4 defines the pack-level procedures. A useful supplier specification should make the test conditions clear enough for the buyer to compare the result against the intended load profile.
Capacity tells you how much energy is available; power capability determines whether that energy can be delivered at the required rate and voltage. For high-power applications, evaluate the battery against the real load profile, not capacity alone. If you need to evaluate a cell or a custom pack, share the target voltage, current profile, temperature and runtime so the right test data can be matched to your mission.
คำถามที่พบบ่อย
Why does battery voltage drop under load?
Because terminal voltage falls below open-circuit voltage by the sum of ohmic, charge-transfer and concentration losses, and that gap widens with current, cold and depth of discharge. A pack can read a healthy resting voltage and still sag past the equipment’s minimum input seconds after the load engages.
Why does a battery shut down when it still has charge?
Because the equipment stops when terminal voltage crosses its minimum input, not when stored energy runs out. Low-voltage protection may be triggered by the weakest cell, a parallel group or a pack-level threshold, so one sagging group can shut the system down while the pack average still looks healthy.
Does higher Ah mean higher power capability?
No. Ah measures how much charge the cell can store, not how fast it can deliver it. Two cells of identical capacity can behave completely differently under load, because the design that stores more energy is not the design that moves ions faster. Check the cell’s continuous and peak ratings, not just its ampere-hours.
Can a peak C-rating be used as a continuous discharge rating?
No. Continuous current is a sustained-period rating, peak current is a short-duration one, and the second is only valid under the starting conditions the supplier specifies. Heat rises with the square of current, so a pulse that is fine for a few seconds becomes a thermal problem when you hold it.
What battery test data should I ask a supplier for?
Ask for the conditions behind every number: DCIR with its pulse duration, measurement point, SOC and temperature; continuous and peak ratings with their temperature limits and pulse durations; discharge curves at your expected C-rates; temperature rise over the cycle; and the BMS thresholds that decide when the equipment stops.




 ไทย
 English
 Español
 한국어
 Deutsch
 Français
 日本語
 Русский
 Bahasa Indonesia
 العربية
 Português do Brasil
 Italiano
 Nederlands