


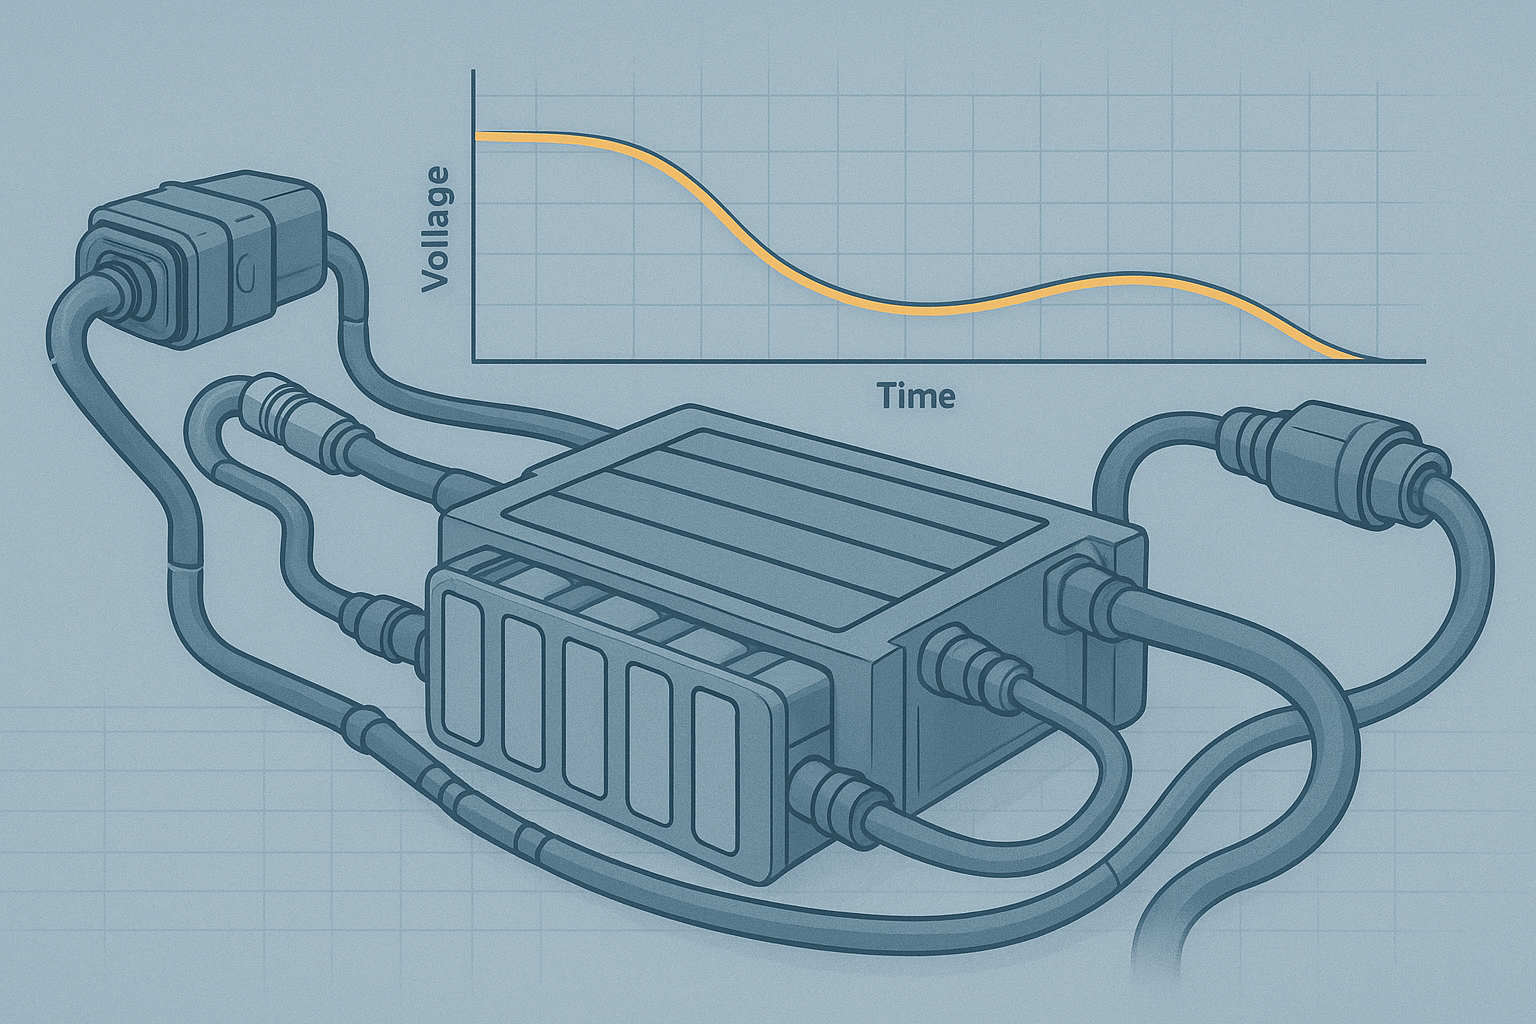
In industrial fleets, voltage sag is best treated as a measurable power-path behavior: a temporary voltage drop when the aircraft demands high current (payload takeoff, climb, gust response, sustained high thrust).
Sag will always exist. What matters is whether it stays predictable inside your worst-case envelope (temperature, state of charge, payload mass, and duty cycle) and whether your data is auditable enough to support pack rotation and procurement decisions.
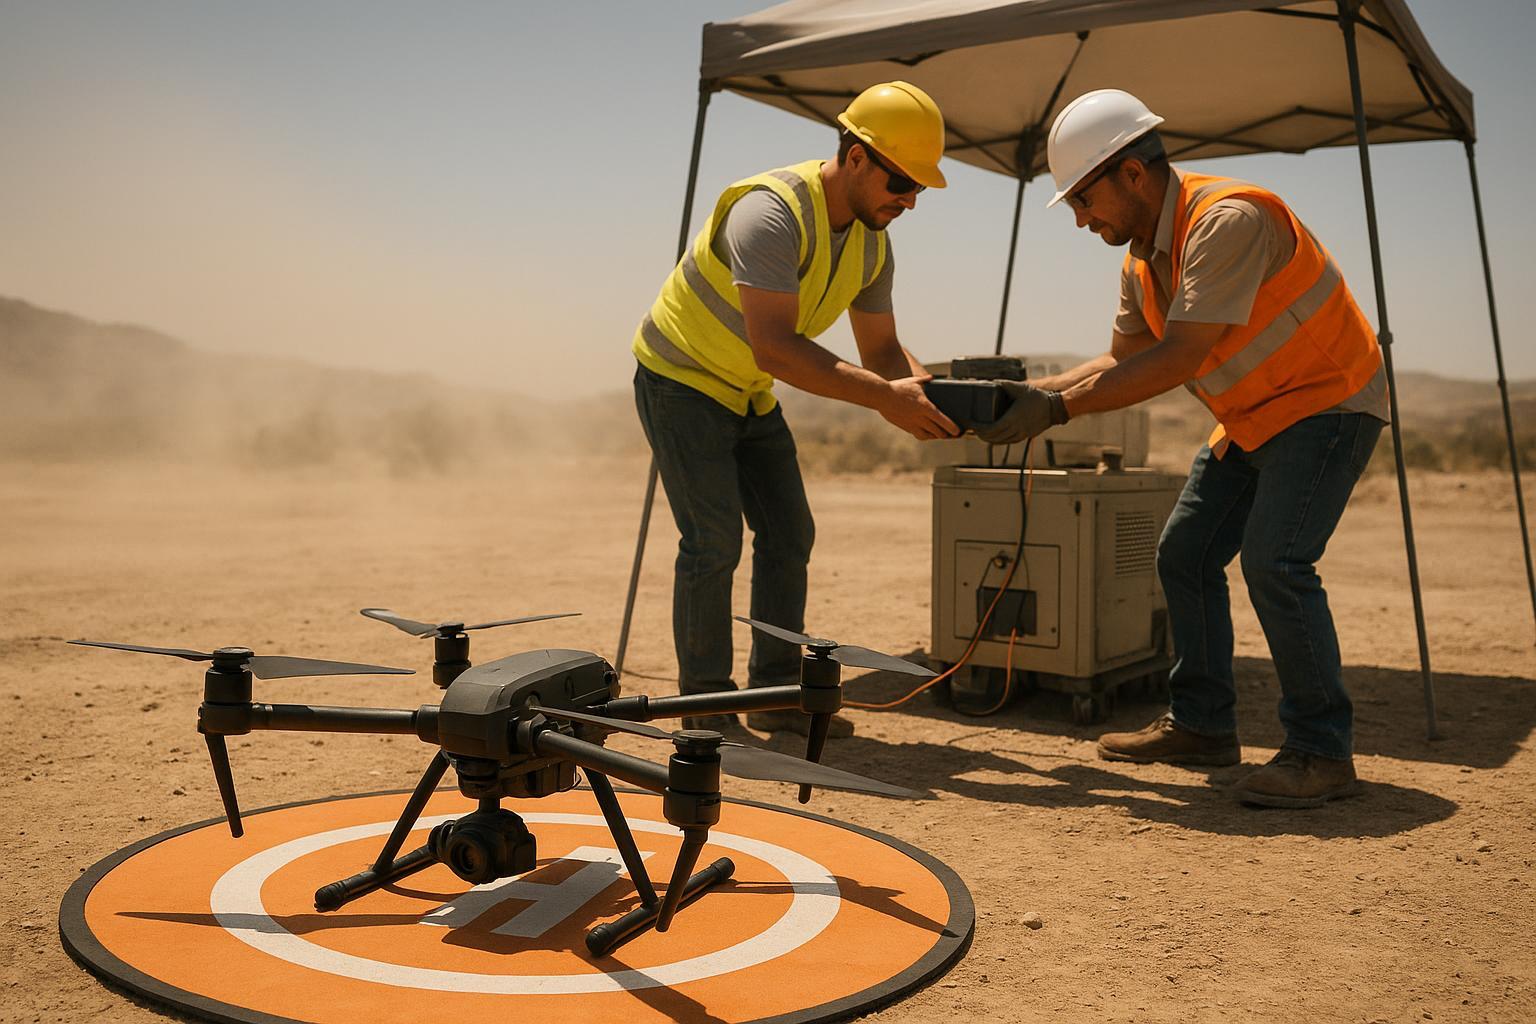
In field operations, sag shows up as more than a voltage number: faster-than-expected energy drain, reduced stability in hover, or performance drift in the same high-load segment. In mapping and inspection missions—where repeatability and image quality matter—operators may also see subtle route deviation, gimbal jitter, or footage vibration that lines up with voltage minima in logs. In extreme cases, insufficient voltage under load can reduce thrust margin and contribute to brownouts, forced landings, or loss-of-control events.
Treat voltage sag/voltage drop as a specification: define what you log, how you interpret it, and what evidence you require from a supplier.
Drone battery voltage sag: a measurement problem, not a “feel” problem
At a high level, voltage sag scales with current × total resistance in the power path. Same aircraft, same payload, same throttle request—but different packs can look very different if their “power path” has more resistance.
In practice, “total resistance” usually comes from a handful of places across the power path:
cell internal resistance (IR/ESR, the battery’s internal opposition to current flow)
pack interconnects and busbars
connector contact resistance
harness gauge/length
protection components and cutoff logic
This matters because voltage is load-dependent. Even hobby telemetry discussions highlight that voltage can fluctuate with throttle due to sag, making voltage-only monitoring noisy. Oscar Liang’s overview on monitoring drone battery voltage and alarms is a concise illustration of that limitation.
For fleets, the implication is straightforward: you want sag signals that are comparable across packs, missions, and climates.
Early warning signs you can detect in logs before missions abort
A lightweight log review process (even in a spreadsheet) often catches problems early: pick one repeatable high-load segment, then trend minimum voltage under load, recovery voltage after throttle reduction, cell-to-cell spread under load, and pack temperature rise across packs and across weeks. Packs that drift away from the baseline are the ones most likely to trigger RTH or brownouts first.
To make those trends actionable, log the environment and context alongside electrical data: ambient temperature (or pack start temperature), wind/payload notes, and the mission segment label (e.g., “takeoff+climb with payload”). This lets you separate a cold-start voltage drop from a connector-resistance problem, and it makes supplier comparisons fairer.
The goal is early detection—before sag presents as forced landing, early return-to-home (RTH), or payload brownouts. The most useful indicators combine electrical, flight, and thermal/physical signals.
From signal to action: a strict first-pass mapping
Use a consistent mapping so different engineers reach the same next step.
Signal: deeper minimum-voltage dips at the same SOC/temperature
Likely bucket: cells / aging
First check: IR trend vs. fleet baseline and vs. sister packs from the same lot
Next action: quarantine outliers and repeat the standardized load segment with temperature logged
Signal: slow recovery after load reduction
Likely bucket: temperature / estimation / limits
First check: pack start temperature and whether the segment was a cold start; confirm BMS/FC filtering and cutoff thresholds
Next action: repeat the segment at a controlled temperature band to separate cold impedance from configuration limits
Signal: cell-to-cell divergence under load increasing over time
Likely bucket: imbalance / weak groups
First check: balancing behavior and per-cell telemetry completeness (no missing channels)
Next action: identify weak groups and remove the pack from mission-critical dispatch until variance stabilizes
Signal: localized connector/harness hot spots
Likely bucket: integration resistance
First check: contamination/corrosion, looseness, strain relief, and mate/unmate wear
Next action: re-terminate/replace suspect joints and re-run the same load segment to confirm sag improvement
Signal: pack temperature rising faster than baseline on the same segment
Likely bucket: I²R losses or cooling deficit
First check: current draw for that segment, airflow/cooling intervals, and whether resistance is concentrated at a joint
Next action: adjust cooling/dispatch rules and verify the new baseline over a week of repeat runs
This doesn’t replace teardown-level diagnostics, but it creates a repeatable first-pass workflow.
Telemetry anomalies: voltage dips, SOC jumps, and slow recovery
When sag stops being predictable, it often shows up in a few repeatable telemetry patterns:
Repeated minimum-voltage dips during known high-load segments (takeoff with payload, climb, wind margin)
SOC step-changes (e.g., a sudden drop in percentage) during load events
Slow recovery after load reduction (voltage doesn’t rebound quickly when demand decreases)
Cell-to-cell divergence under load (weak groups dip harder, which can trip protection earlier than expected)
If you have current and energy accounting, interpret voltage alongside those signals rather than treating instantaneous voltage as a single truth value.
Flight performance instability: thrust-margin loss and payload symptoms
On the flight side, sag problems often correlate with performance drift you can spot in the same segments:
higher-than-normal throttle required to hold altitude at the same gross weight and conditions
speed loss, altitude instability, or sluggish control response during the same high-load segment
drift from expected climb rates or speed schedules during high-load segments
payload resets, gimbal instability, or sensor brownouts that align with voltage minima
These are correlated signals, not a root-cause diagnosis by themselves—but they tell you where to dig. If the same airframe starts “feeling heavy” on climbs and the logs show deeper voltage minima at the same SOC/temperature, treat it as a dispatchability signal—not pilot error.
Thermal and structural indicators: heat rise, swelling, connector hot spots
Sag frequently co-occurs with thermal signatures because losses scale with current:
pack temperatures rising faster than the fleet baseline for the same mission profile
localized hot spots near connectors or harness exits (often indicating resistance concentrated at a joint)
swelling or enclosure deformation found during inspections
Why sag worsens under real duty cycles: IR, temperature, and the total power path
For selection and troubleshooting, it helps to separate three buckets: cells, environment, and integration.
Internal resistance: I×R voltage drop and I²R heating
Internal resistance is often described as electrical “friction” inside the battery. When current increases, voltage drop increases, and energy is dissipated as heat. In practice, engineers often frame the relationship as Vdrop = I × R, with heating losses scaling as P = I² × R.
For fleet reliability, the key isn’t the equation—it’s trend management:
Aging increases IR (and often increases variance pack-to-pack), which deepens sag and can shorten useful flight time.
IR is temperature-dependent, so comparisons require a consistent measurement protocol.
A simple rule of thumb: if a pack’s IR trend is rising faster than the fleet baseline, expect earlier voltage-drop-driven warnings and earlier cutoff behavior under the same load.
Temperature envelope: cold-start impedance and hot-soak variability
In fleet work, “temperature envelope” means the pack has to deliver predictable minimum voltage under load at both ends of your operating range—not just at room temperature. Two recurring scenarios drive surprises.
Cold starts are where fleets often see the biggest sag surprises. As impedance and polarization rise, the same current demand produces a deeper instantaneous voltage drop, and recovery after you reduce throttle is often slower. Practically, that means the same takeoff/climb current causes a deeper voltage drop, recovery after you reduce throttle is often slower, and usable discharge capability can feel lower even when SOC looks acceptable.
If you trend sag, compare like-for-like conditions: similar state of charge, the same standardized high-load segment, and a recorded pack start temperature.
Hot-soak conditions can be misleading in the opposite direction. When a pack is already warm from prior flights or sitting in the sun, lower instantaneous resistance may look “better” at first, but the risk shifts to heat rise and protection thresholds. Under sustained high thrust, I²R losses can push temperature up quickly, and conservative BMS or flight-controller limits can trigger warnings or cutoffs even when the early voltage curve looks stable.
Operationally, you’re looking for one quantified answer: how much does minimum voltage under load shift at your cold-start conditions, and how repeatable is that behavior across packs?
The practical control is consistency: define a temperature logging method (start temp + peak temp), then evaluate minimum voltage under load and recovery behavior at a few fixed temperature bands that match your real operations.
With temperature effects bounded and repeatable in your data, you can then isolate the remaining variance that comes from environment exposure and process habits.
Other real-world contributors: humidity, altitude, and charging habits
Beyond temperature, three practical factors often show up in fleet investigations:
Humidity and moisture exposure: Water ingress or condensation can increase leakage paths, accelerate corrosion at connectors, and destabilize pack behavior over time—showing up as higher losses and more variable voltage drop under load.
High-altitude operations: Thin air reduces rotor efficiency, so aircraft may demand higher power (and current) to hold the same profile. Higher current increases both sag and heating, so minimum voltage under load can shift even when the pack looks “fine” on the bench.
Charging and cycling practices: Charging habits can quietly set the baseline for how predictable sag will be in the air. Field experience suggests that repeated over-discharge, overcharge, frequent high-rate fast charging, or using mismatched/low-quality chargers tends to accelerate aging. Over time, that often shows up as rising IR, faster voltage drop in the same mission segment, and earlier warnings or cutoffs.
Castle Creations’ engineering note on cold weather and LiPo batteries notes that cold conditions reduce effective discharge capability and increase voltage sag, and it recommends warming packs before use and avoiding charging while cold. A peer-reviewed review on lithium-ion batteries under low-temperature environments (2022) similarly describes increased impedance/polarization and reduced discharge voltage at low temperature.
Connectivity and protection logic: R_total and cutoff behavior
High-current industrial platforms can be sensitive to resistance outside the cells:
connector selection and vibration behavior
harness gauge/length and thermal margin
BMS and flight-controller cutoff thresholds (the voltage/temperature limits that trigger warnings or shutdown), filters, and fault definitions
This is also where drone BMS telemetry becomes a reliability input rather than a nice-to-have: without per-cell visibility, temperature channels, and readable fault flags, post-flight root cause often collapses into guesswork.
Buyer’s guide: selecting batteries and BMS for heavy-lift mission predictability
Before you evaluate vendors, it helps to align on the specs that actually map to flight reliability and dispatch decisions:
Voltage (S count): More series cells increases nominal voltage. Under high load, the key question is whether minimum voltage under load stays above your aircraft’s cutoff thresholds.
As a quick reference, a single lithium cell is often described as ~3.7V nominal, so a “3S” pack is ~11.1V nominal. (Exact values vary by chemistry and state of charge, but the series-count logic is the point.)
Capacity (mAh or Wh): Higher capacity usually extends endurance, but it can also add mass. The right choice depends on whether you’re limited by flight time, payload, or climb margin.
Discharge rating: This reflects how much current the pack can supply without excessive voltage drop. In practice, it affects takeoff/climb stability and how deep sag gets during peak-load segments.
A common rule-of-thumb framing is: max continuous current ≈ capacity (Ah) × C-rating. As a simple illustration, a 5,000mAh (5Ah) pack rated at 20C implies ~100A (5 × 20) of continuous current under that convention.
Internal resistance: Lower IR generally means less loss and less heat for the same current—so you get a more stable voltage profile and more predictable dispatch behavior.
If you’re choosing packs for different mission types, many operators use these as starting points and then validate against their own duty cycle:
Aerial photography / general inspection: moderate C-rating, higher capacity, and conservative sag margin
Racing / high-thrust transients: higher C-rating and lower internal resistance to limit voltage dips during punch-outs
Long-endurance mapping: higher energy (Wh) with careful weight trade-offs, and strong thermal management for sustained current
Must-have evidence and documentation to request
Request artifacts that make sag comparable and auditable:
Dynamic discharge characterization across SOC and temperature (not only a static discharge curve).
BMS telemetry coverage: per-cell voltage and temperature, plus log export.
Fault taxonomy: clear undervoltage and thermal flags so you can classify aborts.
Environmental and mechanical validation aligned to your duty cycle.
Our article on preventing drone battery voltage sag in mining operations shows how we translate that evidence-first approach into practical checklists.
If you’re building a shortlist, we can also provide traceable manufacturing control and exportable test artifacts—such as lot-level documentation and common compliance packages (e.g., CE/UL/UN38.3/ISO where applicable).
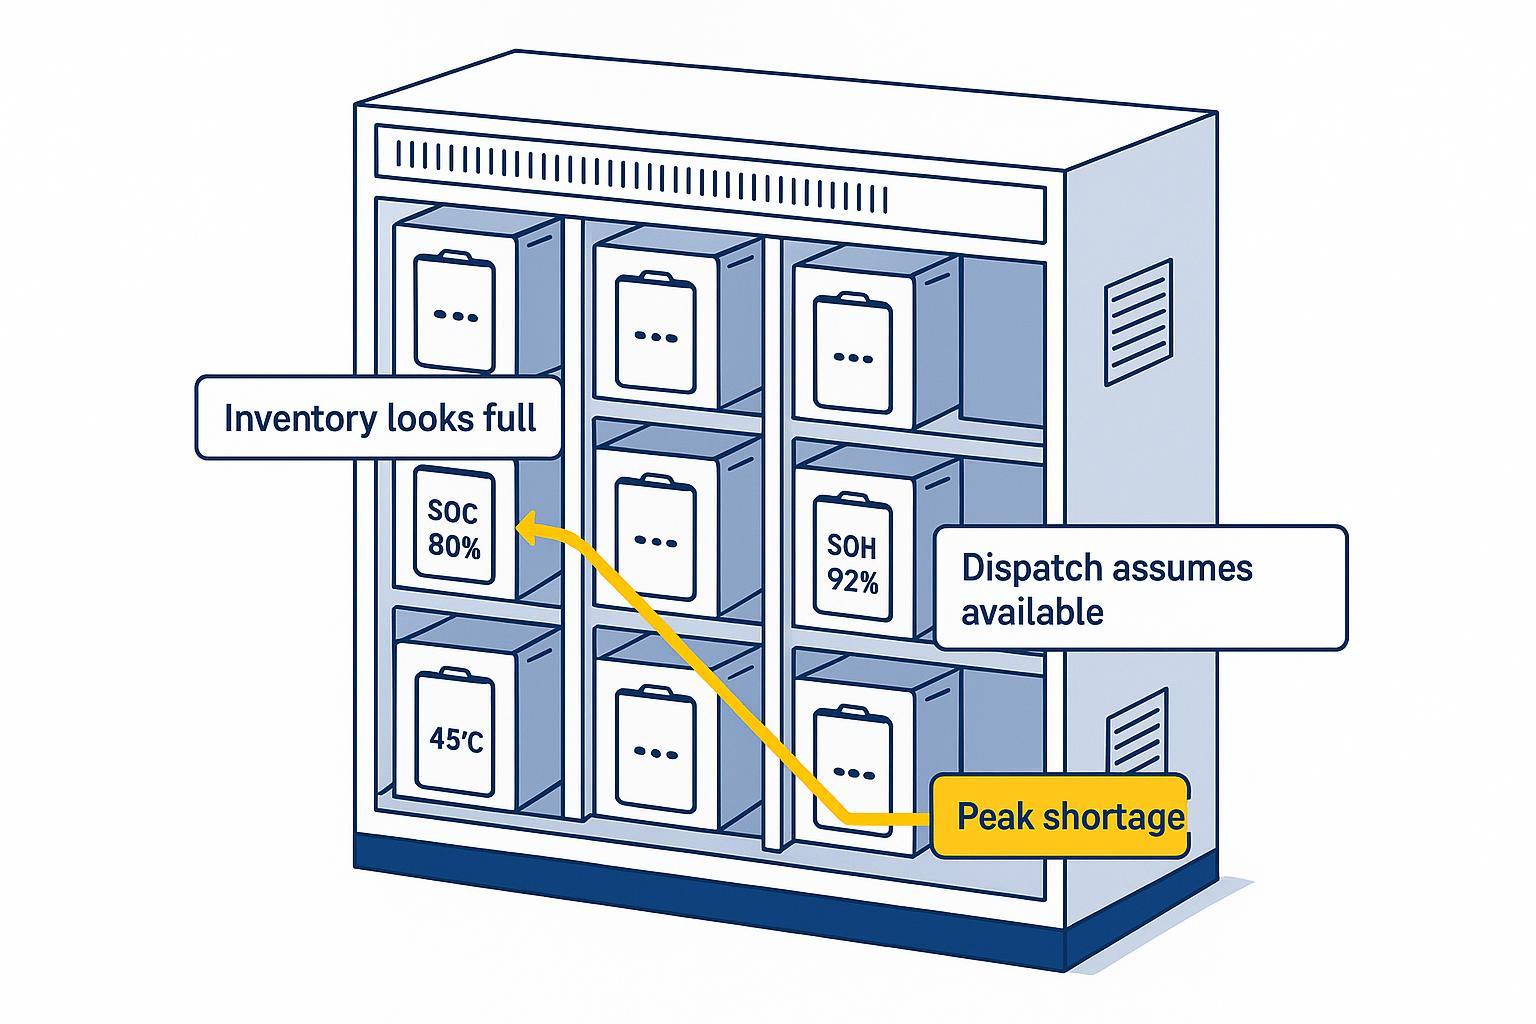
Red flags that correlate with “unpredictable dispatch”
Signals that often co-occur with week-to-week variability:
no consistent method to report IR/ESR trends (or measurement conditions are unspecified)
no evidence of behavior at worst-case temperature and SOC
pack-to-pack inconsistency in the same SKU, with no traceability
opaque cutoff behavior (“it just cuts out”) and inaccessible fault logs
When sag isn’t measurable (telemetry, artifacts, traceability), fleets typically compensate with conservative mission planning. That can protect safety, but it often shows up as lost payload margin, lost flight time, and uncertain TCO.
A repeatable pre-deployment validation protocol
You don’t need a full lab to reduce surprises. You need a repeatable protocol:
define your worst-case mission segment (payload, climb, wind margin, temperature)
run a short controlled load segment and log: minimum voltage under load, recovery, per-cell spread, connector/pack temperatures, and any fault flags
repeat across multiple packs from the same lot to quantify variance
The goal is to convert “surprise abort” into “measured variance under defined conditions,” which procurement and rotation can act on.
Engineering controls that improve sag margin without changing the airframe
Three control layers tend to produce the biggest reliability gains.
BMS capabilities: observability, balancing behavior, and logs
A practical “industrial minimum” is:
per-cell voltage and temperature observability
balancing behavior that remains stable over duty cycles
readable logs and fault flags for post-flight diagnosis
To support predictable dispatch in real fleets, teams often look for more than basic protection. BMS features like reliable cell balancing, clear over/under-voltage protection behavior, and thermal monitoring (and, where applicable, thermal management integration) reduce the gap between “bench OK” and “mission reliable.”
To align operations and procurement, add a simple maintenance/check routine:
Pre-shift (quick check): confirm BMS is reporting per-cell voltages/temps (no missing channels), and confirm undervoltage/overtemp alarms are active.
Weekly (trend check): review logs for repeated deep minima under the same mission segment, increasing cell-to-cell spread under load, and packs that recover slower.
Per-lot acceptance: verify you can export logs and interpret fault flags (so “it cut out” becomes a classified event).
Electrical integration: connectors, busbars, and strain relief
If you treat sag as I × R_total, then reducing R_total is system work. Beyond wire gauge and layout, connector decisions matter more than many teams expect.
Practical selection criteria often include:
connector families with known contact stability under vibration
adequate voltage/current rating margin for your peak load
low and stable contact resistance (especially after many mate/unmate cycles)
environmental robustness (moisture ingress, corrosion exposure, dust)
On the maintenance side, keep strain relief at harness exits, inspect for looseness/contamination, and avoid resistance concentration that turns into a localized thermal hot spot.
Operations: temperature conditioning and load-profile governance
This is where a heavy-lift drone battery program becomes predictable:
pre-conditioning procedures for cold environments
dispatch criteria that use logs and inspection results, not only “it worked last time”
mission profiles that avoid repeated peak-load transients when pack temperature is out of band
Many teams also use simple temperature rules-of-thumb to reduce surprises—such as pre-warming packs around freezing conditions and avoiding high-load launches when packs are heat-soaked. In hotter climates, operators often treat very high ambient temperatures (e.g., ~40°C and above) as a cue to shorten sorties, increase cooling intervals, or de-rate payload, then confirm the rule against their own logs.
For teams building supplier shortlists, a vendor’s technical capability page can be a useful checklist prompt: confirm what documentation and telemetry access exists, then validate it in your own duty cycle.
A practical checklist for fleet reliability
Voltage sag doesn’t go away—but it can become repeatable, explainable, and manageable when you treat it like an operational spec.
Three habits usually make the difference:
Standardize one repeatable high-load segment for trending (same payload and profile when possible)
Review logs on a cadence (weekly trend review + per-lot acceptance) and quarantine outliers early
Write supplier requirements in measurable terms (minimum voltage under load at defined SOC/temperature, recovery behavior, per-cell spread, and fault-log access)
A simple unifying rule: make sag management routine—quietly enforced by data—so it doesn’t turn into a debate every time conditions change.
Assign an owner: name a role responsible for maintaining the baseline and making the “quarantine / return-to-service” call.
Keep one benchmark segment: run the same standardized high-load segment for every pack and every lot.
Review on a clock: hold a weekly trend review and a per-lot acceptance check, even when flights feel normal.
Keep the evidence: retain logs, acceptance runs, and supplier test artifacts so decisions stay auditable.
Treat cold-start as part of your temperature envelope, not a special case.