


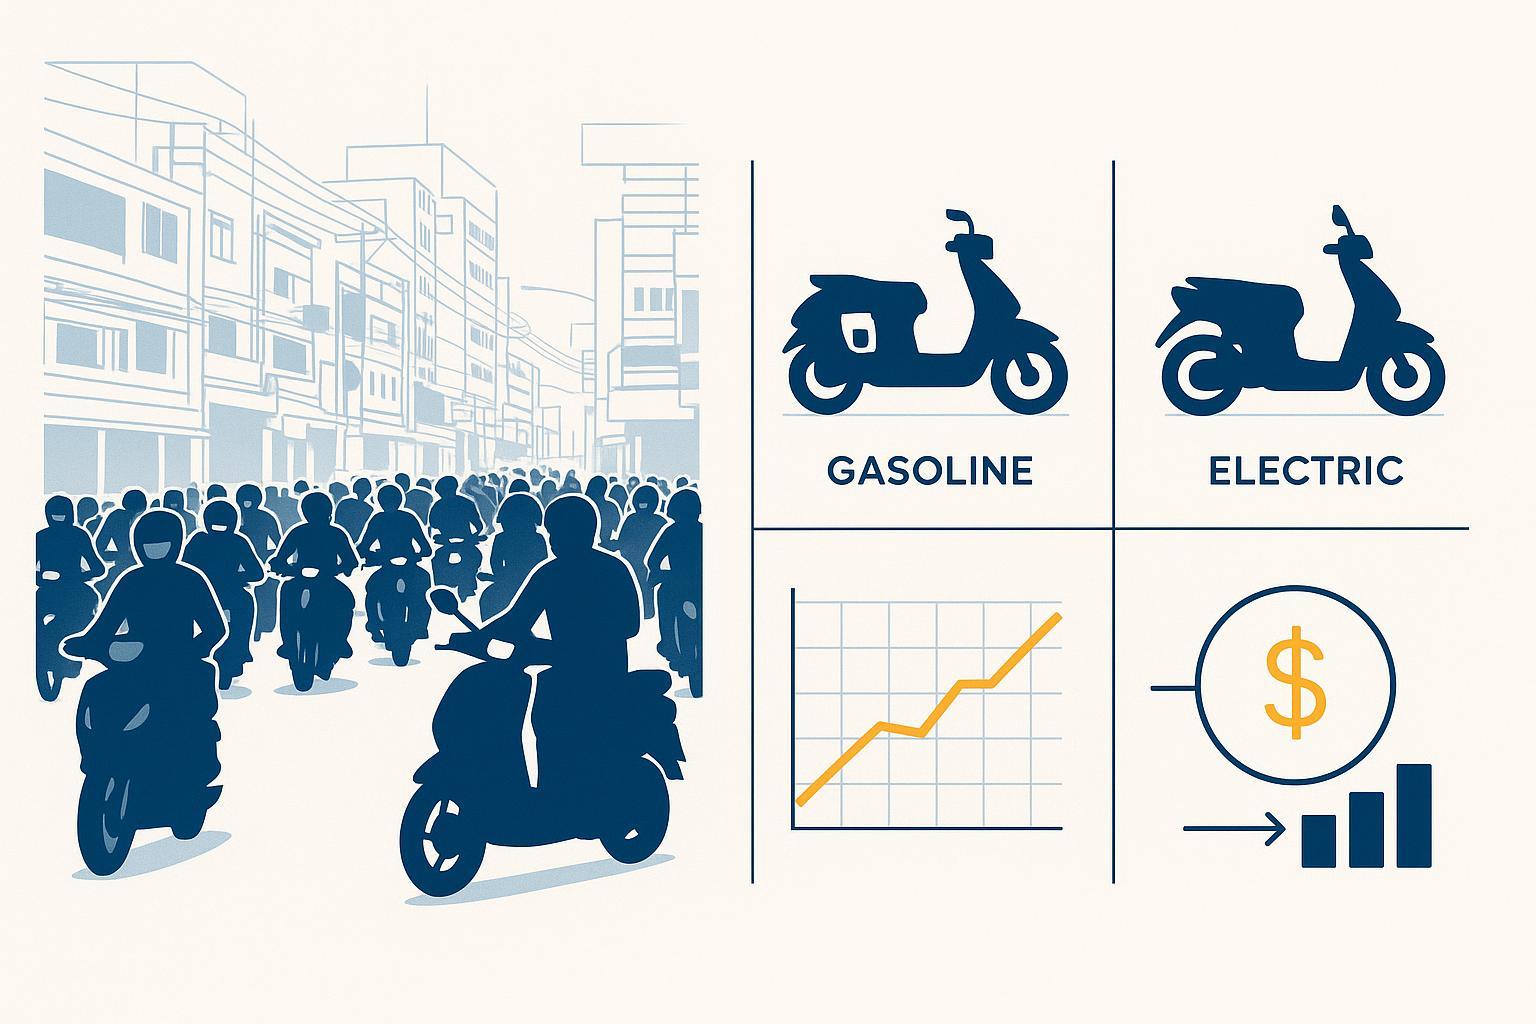
Fuel costs hit riders first—and in Southeast Asia’s high-frequency mobility economy, small price moves become big monthly deltas. For fleets running 80–150 km per day per bike, that volatility shows up directly in procurement budgets and operating margins.
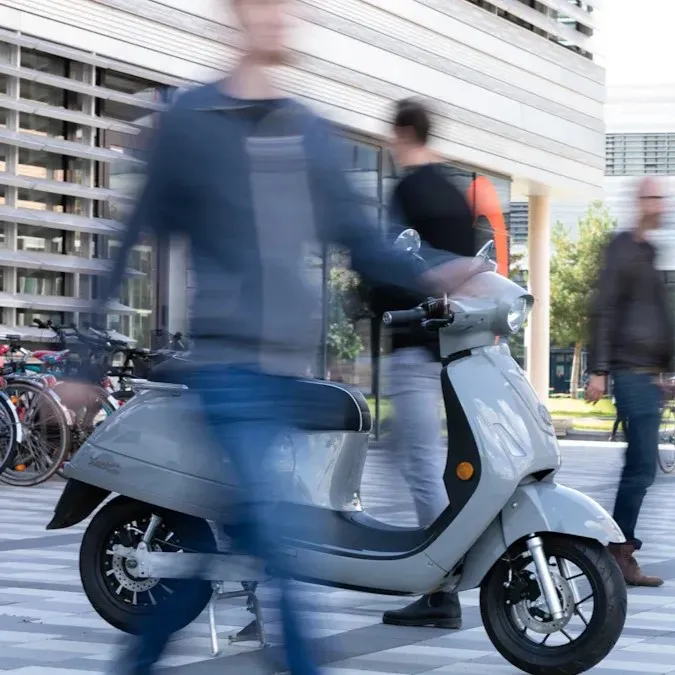
That’s why electric two-wheelers (E2Ws)—electric motorcycles and scooters—are increasingly evaluated as cost-control infrastructure, not a lifestyle product. The real question isn’t “Is EV better?” It’s: At what utilization rate does electrification reduce operating-cost volatility while keeping downtime and battery risk manageable?
Below is a decision-grade framework to compare gasoline vs electric for urban delivery and commercial mobility in Southeast Asia.
A quick comparison matrix for fleet decision-makers
Dimension | Gasoline motorcycles | Electric motorcycles | Fleet-level impact at high utilization (80–150 km/day) |
|---|---|---|---|
Energy cost exposure | Tied to fuel price swings | Tied to electricity price + charging model | Per-km savings compound quickly with mileage |
Refuel/charge downtime | Minutes per refuel | Hours to charge unless swapping | Downtime becomes the real constraint, not range |
Maintenance load | More moving parts, fluids, engine wear | Fewer drivetrain wear items | Lower routine maintenance; different failure modes |
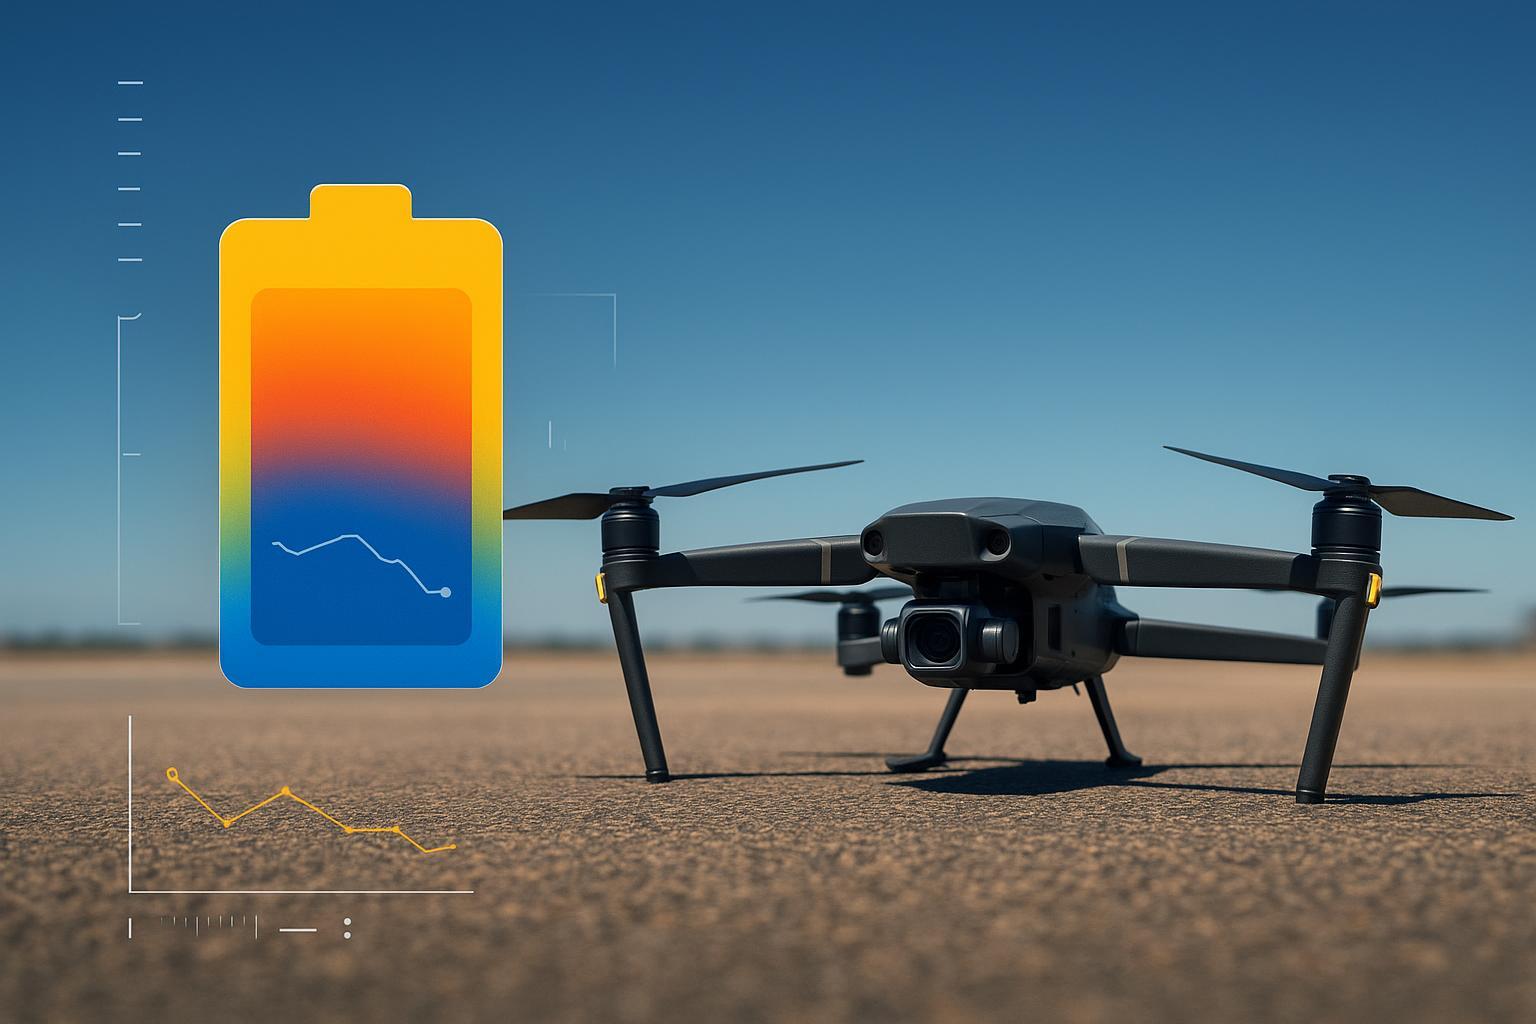
Asset risk | Engine wear + parts availability | Battery degradation + thermal/safety risk | Battery lifecycle becomes a financial variable |
Standardization | Mature, cross-brand compatible fuel | Competing charging/swapping standards | Interoperability can make or break scale rollouts |
TCO drivers | Fuel + routine maintenance | Battery model (own vs rent) + electricity + residual value | Ownership period and battery terms decide ROI |
Utilization intensity is the multiplier. If you run low mileage, electrification may stay a sustainability story. If you run high mileage, it becomes a controllable-cost story.
How rising fuel costs reshape daily mobility economics in Southeast Asia
While the EV conversation often starts with technology, fleet economics start with arithmetic.
The cost escalation mechanism for high-frequency fleets
Fuel pressure becomes structural when three pieces stack:
Fuel cost per km is the base input that flows straight into unit economics.
Usage intensity (km/day) is the multiplier that turns small price changes into large monthly deltas.
Fleet economics mismatch is the outcome: delivery fees and gig payouts rarely rise as fast as fuel, forcing compensating moves (route compression, incentive tweaks, deferred maintenance) that show up later as churn, missed windows, or incidents.
In Southeast Asia this effect is amplified because two-wheelers aren’t a niche mode—they’re the backbone of urban movement. ITDP’s Southeast Asia last-mile delivery background study notes that two-wheelers make up around 80% of vehicles in the region and are central to last-mile delivery because they’re fast and flexible in dense cities (ITDP’s 2025 SEA last-mile delivery study). This aligns with the Asian Development Bank’s SEADS analysis that “almost 250 million motorcycles and other light motorized vehicles” account for “around 80% of all vehicles in the region” (ADB SEADS: Paving the Way for ASEAN to Adopt Electric Motorcycles).
When two-wheelers are the default way people and goods move, energy cost per km shows up everywhere: route planning, rider payouts, and fleet margins. That’s the economic backdrop for electric motorcycle adoption.
Market structure matters, too. ICCT’s profile of the ASEAN Seven 2&3W market (2019–2020) finds the “ASEAN Four” (Indonesia, Thailand, the Philippines, and Vietnam) account for 91.4% of total 2&3W sales—meaning cost shocks and policy shifts in a few countries can move the entire region (ICCT: Market analysis of two- and three-wheeler vehicles in key ASEAN countries).
Electric motorcycles as a structural cost-control lever for high-usage scenarios
As fuel-driven pressure accumulates, electric motorcycles are increasingly evaluated as tools to control energy and maintenance expenditure in continuous-use environments.
Energy cost per kilometer advantage in real-world urban operation
The energy-cost argument isn’t theoretical. Electric drivetrains convert more input energy into motion than internal combustion engines, particularly in stop-start city patterns.
Here’s the simplest way to frame it:
Electricity cost per km = (kWh per km) × (electricity price per kWh)
Gasoline cost per km = (liters per km) × (fuel price per liter)
Unit check: Keep everything in km (not miles) so your utilization (km/day) and energy-use assumptions stay consistent.
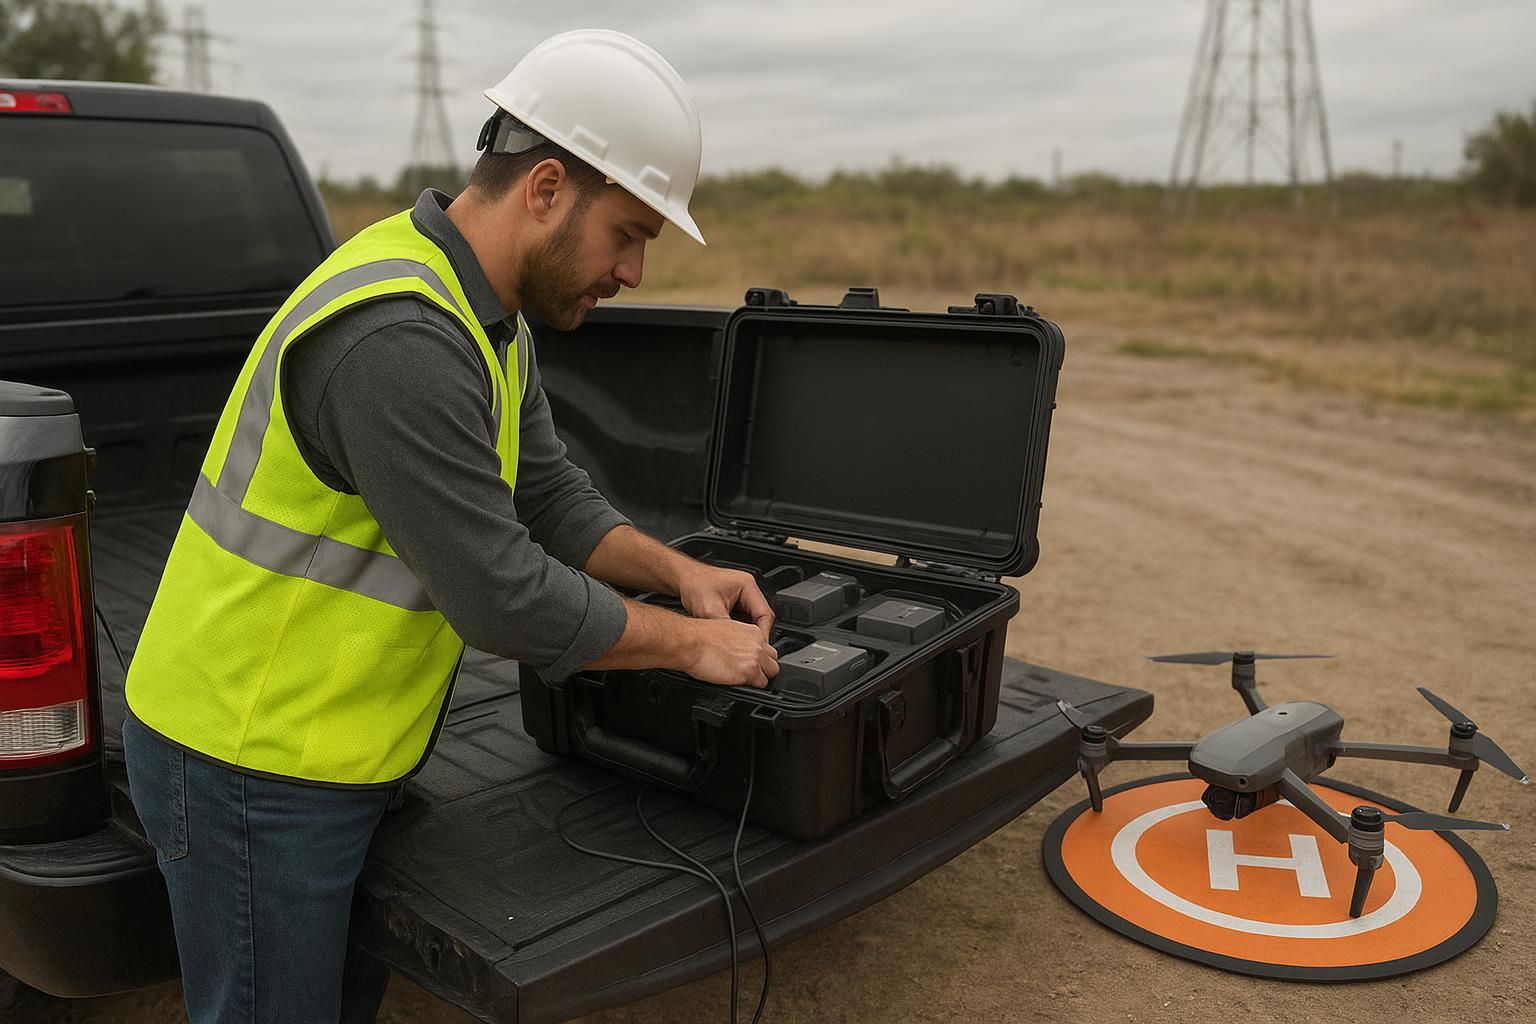
Maintenance reduction and downtime risk in fleet deployment
Electric motorcycles tend to reduce routine mechanical maintenance categories (oil changes, engine-related wear). But in fleet operations, the bigger question is usually uptime: how quickly can a bike get back on the road?
Ask:
What failures take the bike out of service for half a day vs five minutes?
Do you have service coverage for controllers, wiring harnesses, and battery connectors?
Is diagnosis faster or slower than ICE troubleshooting in your operating cities?
The operational win happens when the maintenance profile becomes more predictable and the service network is designed for fleet turnaround, not individual riders.
Battery performance stability is a determinant of operating cost
In high-mileage fleets, the battery is not just “a component.” It is a depreciation curve.
The most important procurement question is not the advertised range. It’s performance stability over time under real duty cycles: heat, high discharge rates (acceleration + loads), frequent charging, and harsh operating conditions (vibration, water exposure).
Battery aging is not one number; it’s a function of operating conditions. NREL’s battery lifetime work emphasizes modeling degradation against variables like temperature, state-of-charge history, and current/usage patterns rather than assuming a single “life” value (NREL: BLAST battery lifetime modeling suite).
When battery performance decays, you don’t only lose range. You lose schedule integrity (more mid-day charging), rider throughput, and SLA confidence.
Electric two-wheeler TCO Southeast Asia: operating cost structure vs gasoline
Small per-trip differences compound across high-frequency cycles. That’s why cost-structure comparison has to be done as a model, not as a vibe.
A worksheet-style TCO/ROI model you can plug into your fleet
Use this as a quick worksheet-style model to compare scenarios without overcomplicating the math.
Core inputs (4–6 variables):
Input | Symbol | What to use |
|---|---|---|
Fleet size (bikes) | N | Your fleet count |
Avg km per bike per day | km_day | 80–150 (or your measured) |
Operating days per month | days_m | 26–30 |
Fuel price | P_fuel | Local 3-month average |
Electricity price | P_kwh | Depot/commercial tariff |
EV energy use | kwh_km | OEM + field test |
Three core formulas:
Convert every cost term into the same basis (monthly, in this case) before comparing scenarios.
Monthly fuel cost (ICE) = N × km_day × days_m × (fuel cost per km)
Monthly energy cost (EV) = N × km_day × days_m × kwh_km × P_kwh
Monthly savings ≈ (ICE energy + ICE maintenance) − (EV energy + EV maintenance)
Treat downtime, battery replacement, and warranty terms as scenario adjustments—otherwise payback will look better on paper than it performs in the field.
Per-day and per-month cost differentials across usage profiles
The cost gap behaves differently across three common profiles:
Urban high-cycle delivery (highest utilization)
EV economics tend to strengthen because savings compound and maintenance predictability matters.
The constraint is charging/swapping uptime.
Mixed-route commercial (moderate utilization)
ROI depends on whether charging can be operationalized without schedule loss.
Low-frequency commuting (low utilization)
Savings compound slowly; upfront price sensitivity dominates.
This is one reason electrification shows up first in fleets and gig delivery. Utilization is already high, and the operator has leverage to standardize operations.
Annualized cost savings and margin expansion potential
Electrification affects not just direct costs but operating margins through:
fewer unplanned maintenance events
reduced exposure to fuel volatility
more predictable cost per kilometer, which stabilizes pricing decisions
That said, the upside only becomes real when the fleet has a defined plan for:
charging windows (overnight depot, midday top-ups, or swapping)
service response time
battery lifecycle governance (warranty enforcement, audit logs, retirement criteria)
Break-even analysis and payback period for electrification
Instead of a single headline payback number, run a scenario band:
Conservative: higher downtime cost, earlier battery replacement, lower utilization
Moderado: expected downtime, expected battery life, expected utilization
Optimistic: strong uptime + longer battery life
Example assumption (for illustration only):
Incremental capex per EV vs ICE = ΔCapex
Monthly operating savings = ΔOpex
Then:
Payback (months) ≈ ΔCapex / ΔOpex
If your conservative scenario doesn’t pay back inside your acceptable horizon, the rollout is not ready. Pilot first, then scale.
Why Southeast Asia’s mobility structure accelerates electric motorcycle adoption
Adoption is driven less by tech preference and more by mobility structure.
Short-distance, high-cycle urban mobility patterns
Dense cities with short trip cycles create conditions where:
stop-start efficiency matters
refueling logistics matter
downtime management becomes an ops discipline
Electric motorcycles fit well when you can convert that structure into predictable charging behavior.
Delivery fleet electrification Southeast Asia: why gig delivery is a high-mileage use case
Fleet electrification doesn’t start with “green.” It starts with the line items that grow with mileage:
fuel
routine maintenance
unplanned breakdowns
rider churn due to earnings volatility
When utilization is already high, the operator gets a faster learning loop on ROI.
Energy accessibility: charging infrastructure vs fuel dependence
Fuel is ubiquitous, which is an advantage for ICE. EV fleets need a different type of ubiquity: predictable access to energy without destroying uptime.
This is where models diverge (and where battery swapping vs charging TCO needs to be modeled instead of assumed):
Depot charging: best for controlled schedules, lowest complexity.
Distributed charging: depends on city infrastructure and parking availability.
Battery swapping: can protect utilization but introduces vendor dependence and standardization risk.
ICCT’s Vietnam TCO comparison notes that battery renting via swapping can increase total cost of ownership versus owning the battery, even if it improves convenience (ICCT’s 2023 Vietnam E2W TCO comparison). This is the trade-off fleets need to model explicitly.
Electric two-wheeler fleet ROI: when electrification becomes economically rational
At the decision layer, cost savings translate into ROI only when the operating design is ready.
High-utilization operators vs low-frequency commuters
A practical threshold question:
If your bikes run one shift with overnight parking, charging is easier.
If your bikes run two shifts with minimal idle time, you either need swapping, fast charging, or a rotation plan that keeps bikes on the street.
The more you push utilization, the more your ROI depends on downtime control and battery governance.
Fleet-scale deployment and aggregated cost efficiency
Fleet scale changes the economics because you can:
negotiate electricity procurement
standardize packs, connectors, and diagnostics
train technicians and hold parts inventory
enforce maintenance and charging SOPs
This is also where procurement should push for an audit-friendly evidence pack: certifications, test reports, warranty terms, and traceability.
Key ROI variables: a 3-driver model
For SEA delivery fleets, ROI in electrification is driven by three variables:
Utilization intensity (km/day) — the compounding factor.
Energy cost spread (fuel vs electricity) — the volatility hedge.
Battery lifecycle economics — replacement timing, degradation, and residual value.
Everything else is best treated as secondary modifiers that shift the scenarios rather than redefine the model: downtime/charging uptime, maintenance execution, service response time, and SLA penalties.
If you want a single “control panel” for decision-making, it’s this: mileage × spread × lifecycle.
From daily cost burden to system efficiency
The shift to electric motorcycles in Southeast Asia is not simply a response to rising fuel costs. It reflects a broader transition toward mobility economics that are more predictable, more controllable, and easier to optimize at fleet scale.
The key is not the technology itself, but whether your operating model can support high-utilization scenarios with controlled downtime and stable cost per kilometer.
Start with your own data. Run three scenarios. Include downtime cost in your model. Then evaluate which setup—depot charging, distributed charging, or battery swapping—fits your real operating conditions.