








Cold reduces usable energy, increases internal resistance and limits how much current a battery can deliver. For a low temperature UAV battery, the more useful specification is therefore not a minimum ambient temperature, but what the pack can still deliver at a defined cell temperature and load. Ambient tells you what the air is doing; cell temperature tells you what the pack can do. The sections that follow work through what to measure, at what condition, and how to write it into a specification.
How Cold Changes UAV Battery Capacity, Resistance and Discharge Capability
UAV battery cold weather performance starts with a mechanism, not a percentage. As temperature falls, the electrolyte becomes more viscous, which lowers its ionic conductivity and slows lithium-ion movement. Charge-transfer resistance rises and lithium diffusion in the electrode slows, so the cell develops more overpotential and reaches its voltage limit sooner. The result is less usable capacity at that temperature, even though much of the lithium remains available once the cell warms.
Much of the capacity lost during cold discharge can return as the pack warms, provided the cells have not been damaged by conditions such as low-temperature charging.
The recovery is only half the story, because resistance and voltage move together. The relation ΔV ≈ I × R effective means a cold-induced resistance rise produces a proportional terminal-voltage drop at fixed current, and under high-rate discharge the real drop exceeds the pure ohmic IR term because polarization losses add to it. The higher the C-rate, the more of that resistance rise shows up as voltage drop rather than as delivered energy, so the same pack can look usable at a gentle, long-endurance current and unusable at a short, high-current burst. This is why a single capacity percentage at low temperature, without a stated C-rate, tells you very little.
Field data suggests the scale of the shift. Operator reports for LiPo packs, which are pack-level observations rather than cell ratings, put remaining capacity at around 50-60% of warm-weather capacity at -20 °C, with internal resistance roughly doubled against baseline. At -30 °C the same sources report that only about a third of warm-weather capacity remains, and that the pack may not deliver enough current for takeoff without pre-warming. At -40 °C they describe flight times falling to a few minutes.
These bands come from an operator wiki, not a peer-reviewed test programme, so treat them as directional rather than as a standard, and confirm against your own cell-level data before they influence a decision.
Why Operating Limits Need Cell Temperature, State of Charge and Current Demand
UAV battery operating limits are often expressed as an ambient-temperature range, but ambient temperature alone does not describe the battery’s actual operating condition. A low-temperature operating limit is better treated as a coupled electrothermal condition: cell temperature, state of charge and current demand together determine how much power the pack can deliver within its voltage and protection limits. Cold-weather BMS design practice sets separate limits for wake/boot, arming/preflight and full-power flight, and treats cell temperature rather than ambient temperature as the variable that governs permission.
Current demand is the other half of the condition, because the same resistance turns current into heat and into voltage loss at once. For illustration, 30 A through 20 mΩ of effective resistance produces 18 W of I²R heating. That heating is useful in a cold pack, but the same resistance is also subtracting from the bus at the same moment.
The voltage picture changes once the pack’s effective under-load resistance is higher. Under a different, much higher effective resistance of 80 mΩ, the same 30 A would imply a theoretical 2.4 V drop:
ΔV = 30 A × 0.080 Ω = 2.40 V
In a real cell, polarization and electrochemical effects add to that simple ohmic drop, so the observed sag is larger. In our own cold-weather pack testing, effective pack resistance rose from around 25 mΩ at rest toward 80 mΩ under a 30 A step load, which is a difference of roughly 1.65 V of instantaneous drop across the series string. The exact values depend on the cell and pack, so treat them as illustrative rather than as a fixed rating.
A cold pack can read healthy at rest and still sag under takeoff current. A pack that can supply 30 A under warm conditions may no longer sustain that current at -20 °C without the terminal voltage falling below the system’s protection threshold. The limit that matters, then, is the current the pack can actually deliver while staying inside its voltage and protection limits at its present cell temperature.
How Voltage Sag Turns Into Premature Cutoff and Lost Flight Time
A cold pack can still show an acceptable state of charge while its voltage collapses under throttle demand. That is why an aircraft can cut off with charge still showing on the display: it hits low-voltage warnings or cutoff earlier than the percentage suggests, and it is pulled back to the ground with usable energy still inside the pack. Our own cold-weather operating experience sees the same pattern again and again.
The sequence is predictable. Rest voltage looks healthy on the pad, takeoff produces a sharp dip, cruise recovers part of it, and a hard climb or headwind leg pushes the pack back down until protection trips. The dip is larger than the cell’s internal resistance alone would predict, because polarization losses stack on top of the ohmic term at low temperature.
Protection thresholds widen the gap further. Cold-weather operators often raise the alarm to around 3.5 V/cell against a normal 3.3 V cutoff, because under load at low temperature the higher number sits closer to the real minimum than 3.3 V does at room temperature.
The lost time is real and worth planning around. Operators report that a pack rated for 20 minutes at room temperature can deliver far less than that before sag triggers low-voltage motor cutoff in the cold (Niyotek UAV cold-weather protocols). Rather than adopt a fixed percentage, use the supplier’s tested derate curve for your pack, and treat any quoted planning margin as a starting assumption to be verified in your own cold-chamber data.
What Cold Weather Means for Inspection, Survey and Industrial UAV Missions
The same low-temperature mechanism lands differently depending on the mission, which is why a single derate figure rarely fits two different aircraft.
Long-endurance inspection flights draw a low, steady current for a long time. The resistance rise is still there, but because the current is modest, the voltage drop is smaller and the dominant loss is usable capacity rather than a hard sag. These missions feel the cold as shorter endurance and a pack that reaches its cut-off earlier than the percentage suggests, and they benefit most from insulation and a warm staging point.
Survey and mapping flights run closer to a repeated, stabilised current over a fixed grid, so the pack works in a narrower band and small changes in resistance show up as consistent altitude or duration drift between sorties. Preheating to a defined cell temperature before launch, and holding it in flight, keeps successive sorties comparable rather than making the first one faster than the last.
Industrial and heavy-lift operations are the most sensitive to cold. High-current takeoff, a heavy payload and repeated sorties stack the same problem three times: the pack must supply a large burst while cold, then recover between flights it never fully warms up from. Here the current the pack can actually deliver at its present cell temperature, not its nominal rating, is the number that decides whether the mission is flyable.
Whichever category a mission falls into, the selection question is the same: how much usable energy and continuous current does the pack deliver at the cell temperature and load the aircraft will really see. A pack chosen for warm-weather endurance will not automatically meet the cold-weather version of the same mission.
Preheating, Insulation and Thermal Management That Actually Hold Temperature
Low temperature battery preheating helps for a reason worth stating plainly: warming the cells lowers internal resistance, which reduces both the voltage sag under load and the overpotential that pulls the pack toward its cutoff. It is less a matter of adding energy and more a matter of making the energy already inside the pack easier to deliver.
Preheating matters most in a predictable set of situations: a pack that has cold-soaked on the pad, a high-current takeoff, or successive sorties flown before the pack recovers. In mild conditions with light loads, the benefit is smaller and the trade-off against added ground time is real.
What you need to specify is therefore not a temperature to hit but a set of design decisions: the target cell temperature at which the pack is ready to fly, the heater power available to reach it, and the resulting warm-up time. Equally important is where temperature is measured — cell core or surface — and whether heating continues in flight or stops at takeoff. Those choices decide whether the temperature you warmed the pack to is still there when the mission demands current.
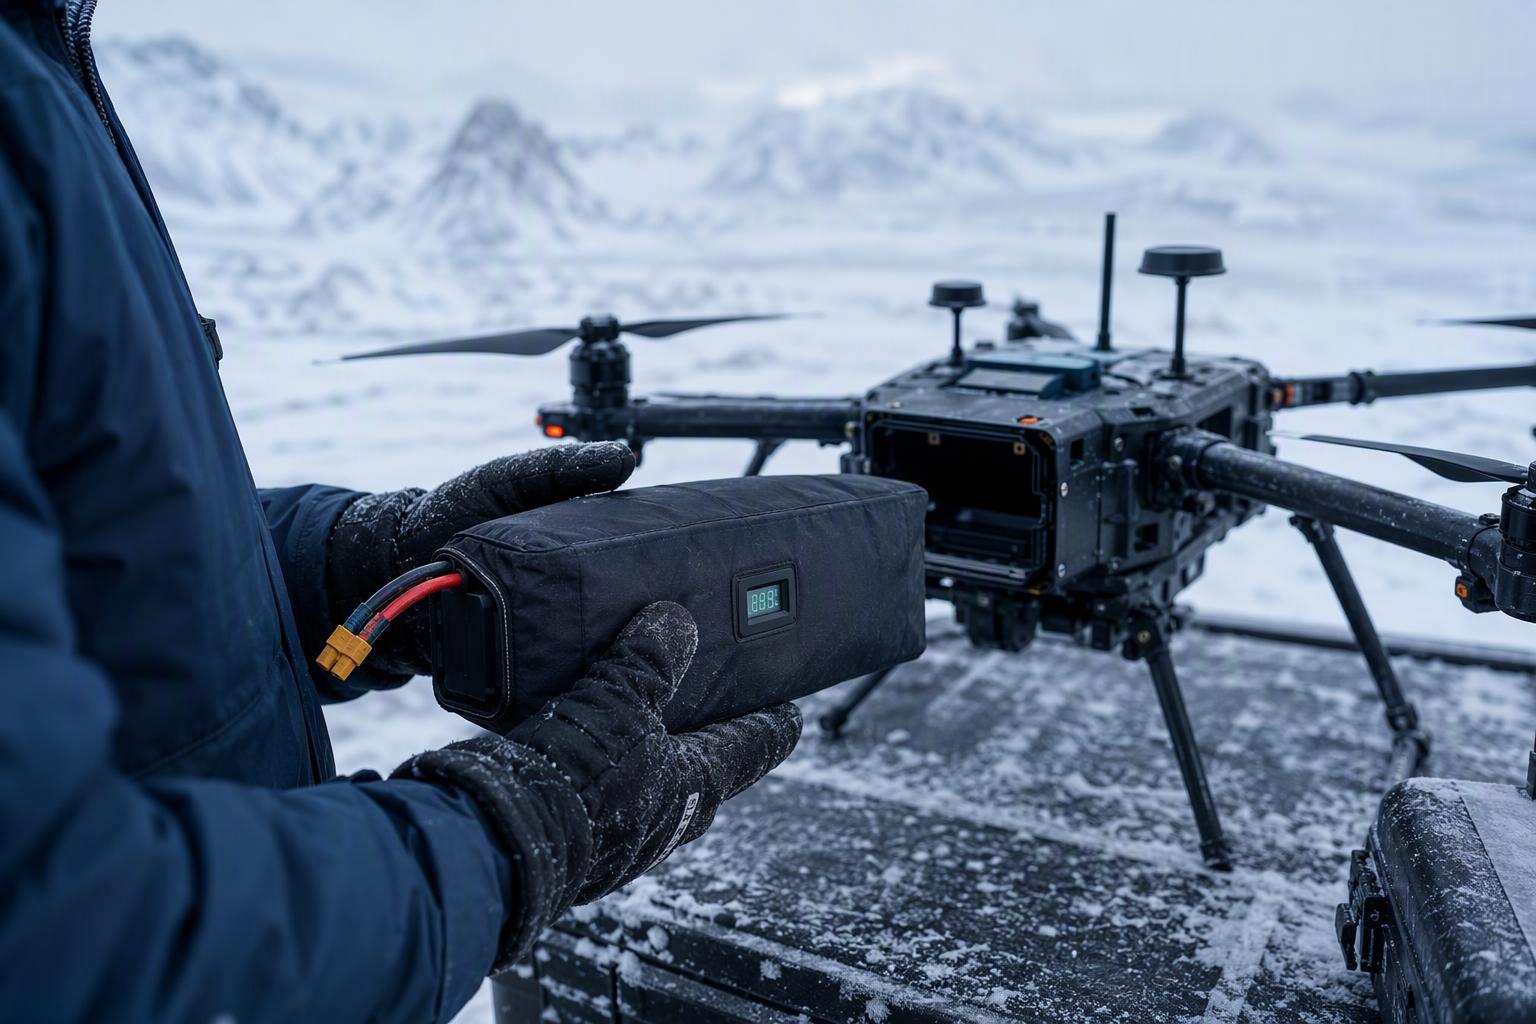
Insulation matters because a warm pack can lose its temperature advantage surprisingly quickly in cold air and wind. A warm pack that sits in wind can cool quickly, so spares belong in an insulated case in the cabin, packs fly in insulation sleeves, and any delay means re-insulating and re-checking temperature before takeoff.
Three approaches cover most designs, and each trades mass, hardware or usable range against the others. The table compares them by design logic rather than by fixed figures, because the actual numbers depend on the cell, the pack and the BMS.
Approach | Added complexity | Thermal effect | Current capability | Main trade-off | Typical use |
|---|---|---|---|---|---|
Self-heating | Adds pack mass and energy use | Active warming before and during flight | Better suited to higher-load operation | Extra mass and power draw | High-current, repeat-cycle missions |
BMS compensation | No added thermal hardware | No thermal recovery | Limited by cold-cell resistance | Does not warm the cells | Lower-load applications |
Passive insulation | Minimal | Retains heat only | Does not improve cold-cell performance | Benefit fades over time | Short missions from a warm staging point |
Self-heating switches on below a defined core temperature and can restore much of the pack’s usable performance once the cells reach their validated temperature range. BMS compensation adds no thermal hardware, but it does lower the cutoff voltage, and that cutoff belongs to the specific cell and pack design — it should not be generalised to another manufacturer’s pack. Passive insulation slows heat loss without adding energy, so its benefit shrinks with time on the pad.
Which approach fits depends on the cell’s validated cold performance and the mission profile. A high-current, repeat-cycle mission and a short hop from a warm staging point will not land on the same choice, and neither is settled by a chemistry label.
Choosing Chemistry and Verifying the Low-Temperature Claim
A low temperature UAV battery is not a chemistry you can order by name. “Low-temperature” is a performance claim, and the only thing that settles it is cell- and pack-level test data measured at the temperature and current you actually fly at. The chemistry label tells you where to look; it does not tell you what you will get.
Cell format can affect thermal management and heater integration — for example, a pouch construction gives a larger, flatter surface for heater layers and insulation to act on. Format alone, however, does not establish low-temperature performance. A polymer cell with a conventional electrolyte can still show substantial voltage sag at -20 °C.
This is why cold-weather BMS design requirements treat temperature as a measured input rather than a chemistry attribute. The pack’s real behaviour depends on electrolyte formulation, heater placement, insulation thickness and current demand together, so the BMS needs cell-level temperature sensing and charge-inhibit logic to react to what the cells are actually doing. Two packs built from the same cell can diverge sharply once those differ.
A worked example makes the point. Our own low-temperature LiPo packs pair a dedicated electrolyte formulation with pack heating to support operation in the -20 °C range, and we publish a capacity-retention figure for the specific temperature and load tested. That number is a capacity-retention result at those conditions, not a permanent degradation rate, and it does not transfer to other temperatures or currents. It is one example of how the claim is built, not proof that any pack carrying a similar label will match it — so confirm the exact figure and its test conditions with the supplier before relying on it.
When you evaluate a supplier, ask for the test report behind the label: cell temperature at test, ambient temperature, discharge C-rate, cut-off voltage and the resulting capacity figure. A chemistry name alone answers none of those.
Cold Charging, Lithium Plating and the BMS Inhibit Rule
Charging is a different problem from discharging. A cold discharge costs flight time, and most of that time comes back once the pack warms. Charging at an unsuitable cell temperature is not reversible in the same way.
The mechanism is lithium plating. When the cell is cold, the graphite anode cannot accept lithium ions fast enough. Some of the lithium therefore deposits as metallic lithium on the anode surface instead of intercalating normally. That deposit can contribute to irreversible capacity loss and rising resistance, and more severe cases add safety concerns. Unlike the capacity loss from cold discharge, this damage does not reverse when the pack warms.
The risk depends on cell chemistry, state of charge and charging current, but it rises as cell temperature falls, particularly when charging approaches or enters the sub-zero range. The charge-inhibit threshold should come from the cell datasheet and pack validation, not from a generic temperature setting.
A pack that recovers its usual runtime after warming may simply have been cold. Persistent capacity loss, rising resistance or swelling requires further investigation and may indicate damage, including damage caused by charging at unsuitable temperatures.
The inhibit itself is a BMS rule, not a battery property. A cold-weather BMS blocks charge current below its defined charging window and heats first where heating is supported, but the limit still has to be validated against the cell rather than assumed from the BMS. Ask a supplier for the datasheet and the pack validation record before you accept a charging window.
A Repeatable Cold-Chamber Test Protocol Two Suppliers Can Be Held To
A low temperature UAV battery claim is only comparable when both suppliers test it the same way. The protocol below fixes the variables that most often differ between two data sheets. Reference methods for lithium cells include IEC 62620 and the GB/T 31486 low-temperature discharge test method (2024), with GB/T 44257.2 covering UAV battery test methods. These are useful starting points, but they do not replace a matrix matched to your own mission.
Three settings carry most of the weight.
Soak. The pack is soaked long enough for the cell core to reach and stabilise at the target temperature. The soak duration is defined and recorded rather than left unspecified, and the same duration is used across samples so the comparison holds.
Current. The discharge current is fixed as a named C-rate, or as an absolute current tied to your application. It is never left as “nominal”.
Cut-off. The cut-off voltage is declared by the manufacturer, because a low cut-off flatters capacity figures at the expense of usable flight time.
A practical starting matrix can use temperature points such as +10, 0, -10 and -20 °C, with the exact range extended according to the aircraft’s operating environment. Acceptance should be stated explicitly at cell level or pack level. If the aircraft is expected to operate below -20 °C, extend the matrix to the actual minimum cell temperature expected in service. The go/no-go still comes from cell-core telemetry and cold-chamber curves measured on the exact pack.
Test temperature | Soak condition | Load | Cut-off | Acceptance criterion |
|---|---|---|---|---|
+10 °C | Defined in RFQ and recorded | Application current or C-rate | Defined in RFQ | Baseline against room-temperature reference |
0 °C | Defined in RFQ and recorded | Same as above | Same | Onset of resistance rise |
-10 °C | Defined in RFQ and recorded | Same as above | Same | Usable energy retained |
-20 °C | Defined in RFQ and recorded | Same as above | Same | Claimed low-temperature grade |
The load, cut-off and acceptance columns should be written into the RFQ rather than left for the supplier to choose, so that two suppliers can be compared on the same basis. Treat the temperature points above as a starting matrix and extend them to the minimum cell temperature your aircraft will actually see in service.
What this protocol does not cover: it does not validate cycle life at temperature unless you add a cycle block, repeating the soak and discharge sequence for a defined number of cycles and logging capacity fade across them.
Defining Operating Limits and Writing the RFQ Clause List
UAV battery operating limits should be tied to cell temperature, while the aircraft’s load profile determines whether the battery can operate within those limits. Each flight stage sits at its own cell temperature, and the most restrictive of them governs the mission, so a single ambient minimum does not describe the limit that applies in flight.
The go/no-go decision comes from cell-core telemetry, the load profile of the actual flight, and cold-chamber curves measured on the exact pack, as our polar operations guidance sets out. Whether the BMS inhibits charge below a set cell temperature is a datasheet and pack-validation question, not an assumption. Ask for the cell-temperature limit and test data that sit behind any published ambient rating.
RFQ clause
What to require
Evidence to demand
Validated output at temperature
Usable Wh and continuous C-rate at stated cell temperatures
Cold-chamber discharge curves, not a datasheet headline
Declared test conditions
Temperature, C-rate, cut-off and sample size
Test report naming the chamber and instrumentation
BMS cold-charge inhibit
The cell temperature at which charge is blocked and released
Datasheet plus pack-level validation record
Heater and insulation
Heater power, control setpoint, insulation specification
Thermal model or measured warm-up time
Cell-temperature telemetry
Sensor placement and reporting rate to the flight controller
Interface documentation and a live log
Standards evidence
Applicable safety, transport and quality documentation
UN38.3 for transport, relevant IEC/UL/GB cell and pack standards, conformity documentation for the target market, and ISO certifications where required
Cold-weather warranty
Whether operation below 0 °C is covered, and on what terms
Written warranty text, not a sales statement
FAQ
What is the coldest safe operating temperature for a low temperature UAV battery?
The limit is a cell temperature, not an ambient one, so the pack’s own cell temperature decides. A pack may sit in -30 °C ambient while its cells stay above the minimum operating temperature thanks to insulation or preheating, so a cold ambient reading alone does not place it outside its window. The limit should therefore state whether it applies to ambient temperature, cell temperature, or both.
Do all UAV batteries behave the same in cold weather?
No. Chemistry, electrolyte formulation, cell format and pack construction all shift the curve, so a “low temperature” label is a claim to test rather than a specification to trust. Two packs with the same nominal capacity can retain very different usable energy at the same temperature and C-rate.
Can a cold-soaked pack be recovered?
Usually yes. Capacity lost to cold is largely reversible once the pack warms, because the loss comes from slowed kinetics rather than destroyed material. The exception is a pack that was charged while cold and plated lithium; that damage does not come back on warming.
Is preheating always required?
It depends on the cell’s validated low-temperature discharge capability, the aircraft’s current demand and the margin you want to hold. Where preheating is used, bringing the pack to a defined cell temperature before launch and holding that temperature in flight — through insulation or active heating — keeps it inside its window. Skip it, and the pack may run with lower usable capacity and deeper voltage sag, depending on its validated cold-weather performance.
How should cold charging be handled?
Charge warm. Many BMS designs use a low-temperature charge-inhibit threshold to reduce lithium-plating risk, so a pack that refuses to charge in the cold is usually protecting itself. Bring it into its specified charge window first, then charge normally.
A low temperature UAV battery should be specified by measured performance at the cell temperature and load the aircraft will actually meet — not by the minimum temperature printed on the label. For procurement, that means pinning down the test temperature, soak condition, discharge load, cut-off voltage and how cell temperature is measured, then writing down the usable energy, voltage behaviour and current capability that come out of it.
None of it needs exotic hardware — just test conditions that stay the same across suppliers. Get those right, and “low-temperature capable” becomes a figure you can hold a supplier to.
Our battery team can help match the test matrix to your mission — send over your aircraft, temperature range and current demand before the pack configuration is locked in.

 Nederlands
  English
  Español
  한국어
한국어  Deutsch
  Français
  日本語
日本語  Русский
  Bahasa Indonesia
  ไทย
ไทย  العربية
  Português do Brasil
  Italiano