












As fleets scale, aircraft performance is no longer the limiting factor. Energy turnaround is.
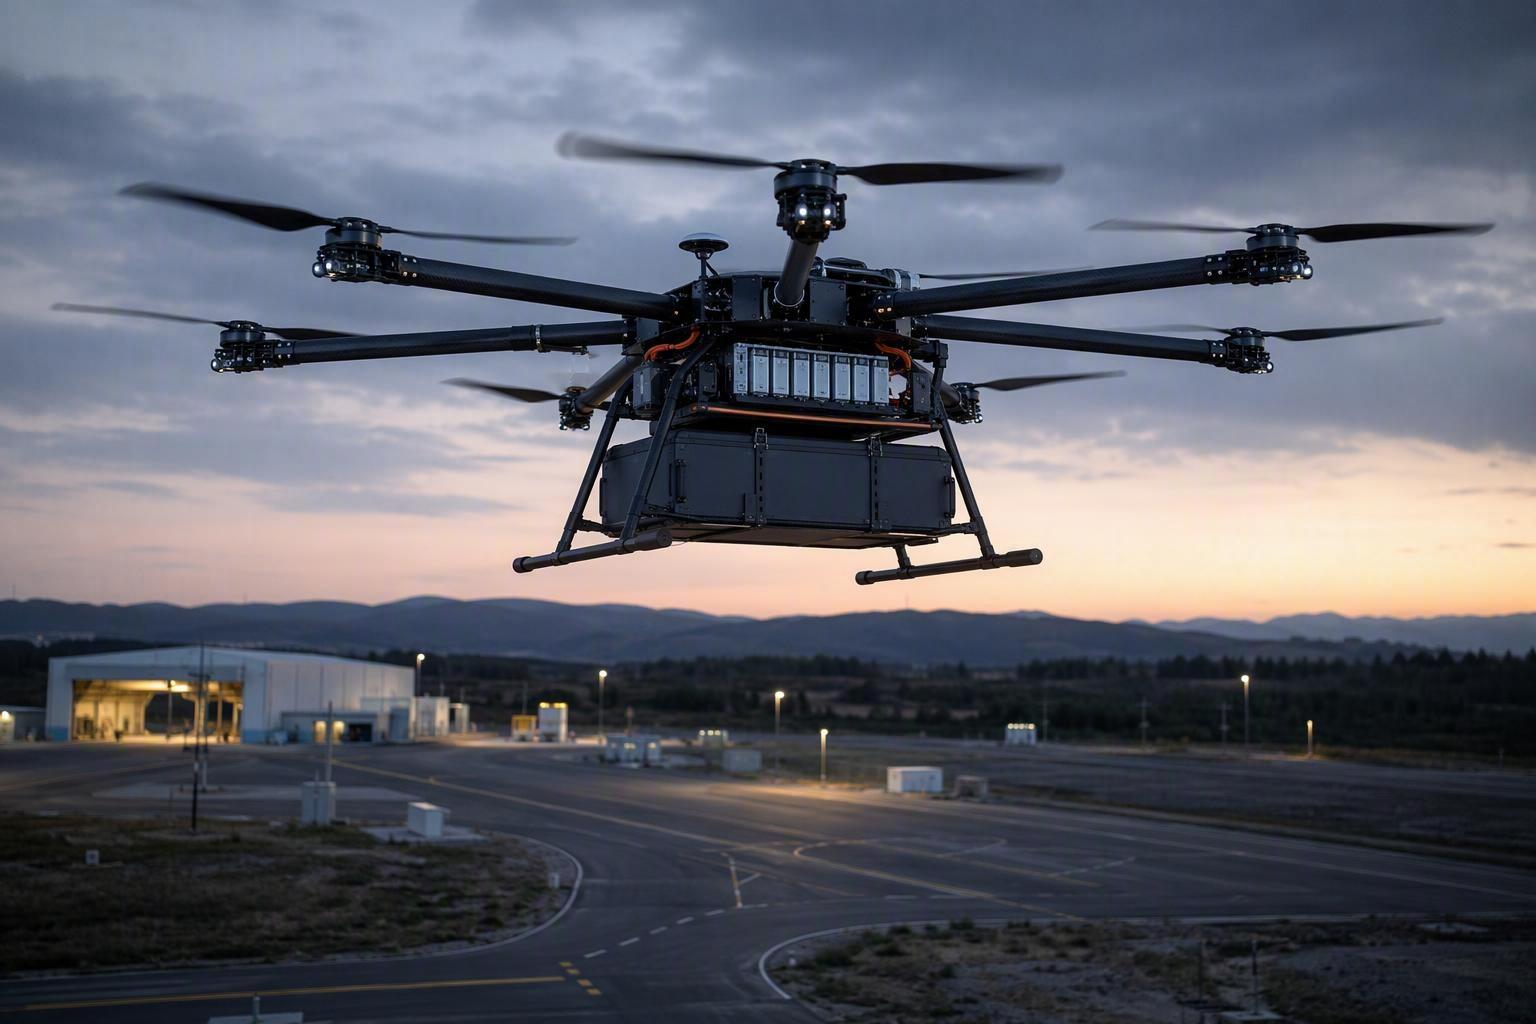
When you run a heavy-lift operation, it’s tempting to believe the next productivity gain will come from the aircraft: more payload, more endurance, more thrust margin.
That was true for years.But the moment a fleet scales past “a few aircraft,” something changes. The limiting factor stops being what the drone can do in the air—and becomes how predictably you can get energy back into the aircraft on the ground.
This isn’t a battery-chemistry story. It’s a throughput story—about fleet productivity, queues, and how fast energy can get back to the line.
Heavy-Lift Drone Fleets Have Solved the Flight Problem
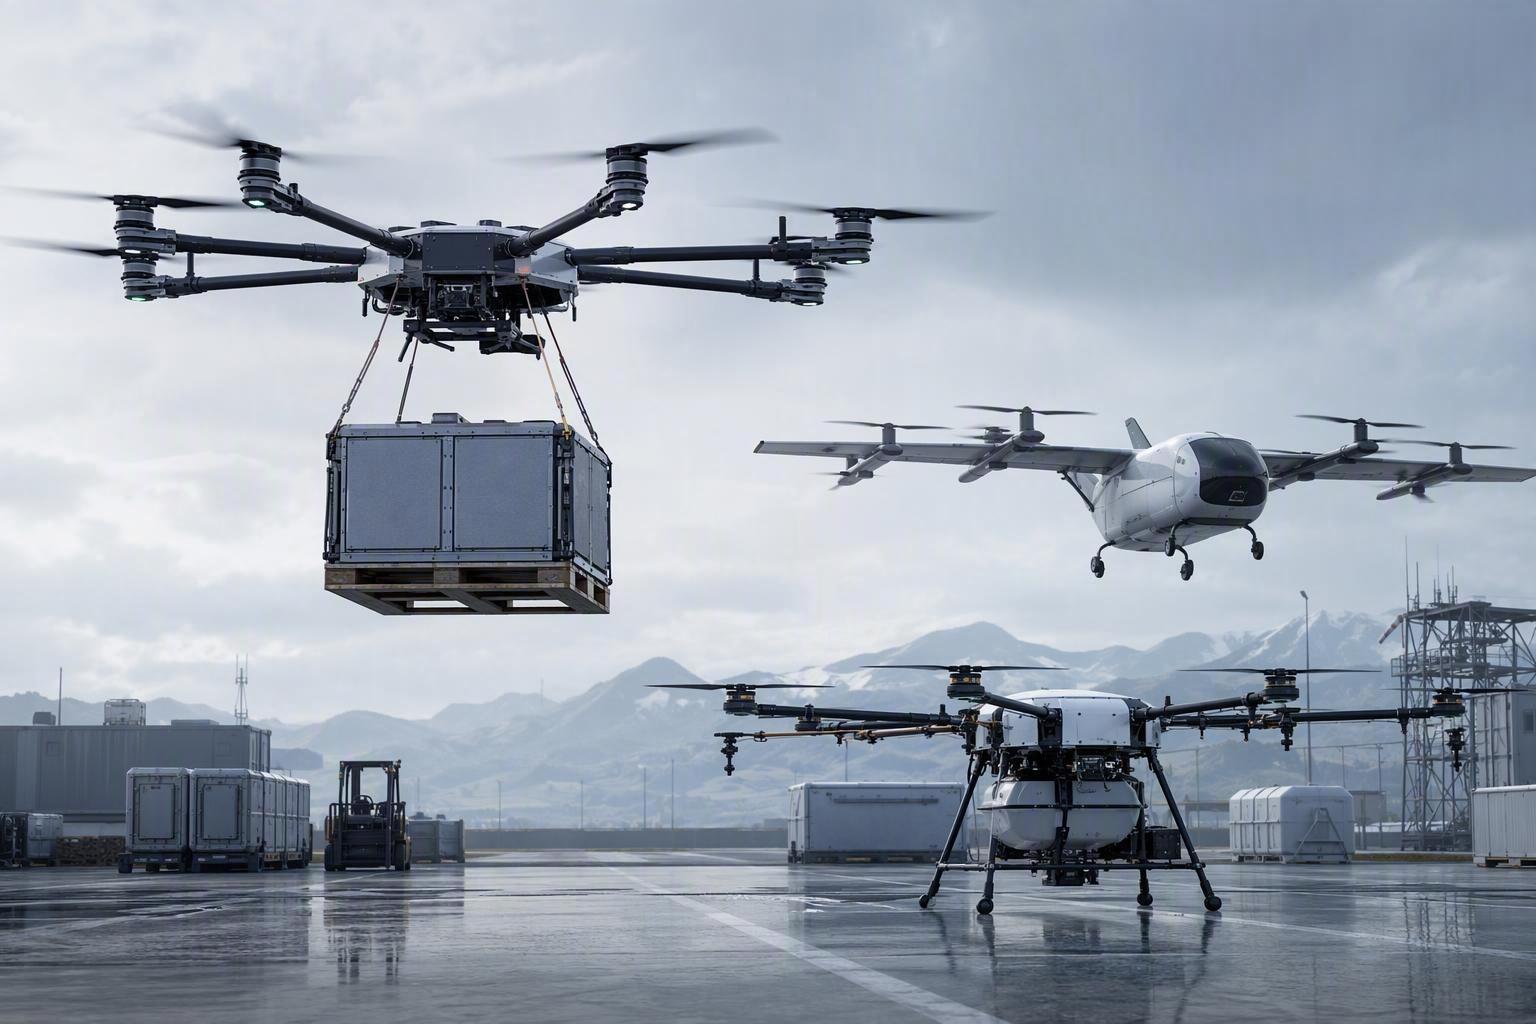
The heavy-lift segment has been in a capability race: lift heavier, fly longer, maintain stability with demanding payloads, and survive rougher environments. In many markets, that race has largely been won—at least enough that aircraft performance is no longer the first question ops leaders ask every morning.
The industry’s baseline assumptions have shifted:
Payload classes that were “special projects” are now routine jobs.
Reliability expectations look less like hobby drones and more like industrial equipment.
Fleet thinking is replacing single-aircraft thinking: uptime, repeatability, auditability.
In that context, “better aircraft” doesn’t automatically become “more daily output.”
From Aircraft Capability to Fleet Productivity
The first phase of growth in heavy-lift drones rewarded engineering breakthroughs.
The second phase rewards operators who can run the operation like a system.
Because your customers don’t buy peak performance. They buy outcomes:
sorties delivered on schedule
predictable coverage per day
fewer cancellations due to avoidable ground-side issues
a workflow that can be repeated across sites without reinventing the process
If your fleet can’t turn jobs into repeatable daily throughput, aircraft capability becomes an expensive ceiling instead of a competitive advantage.
Why 32S Platforms Are Becoming More Common
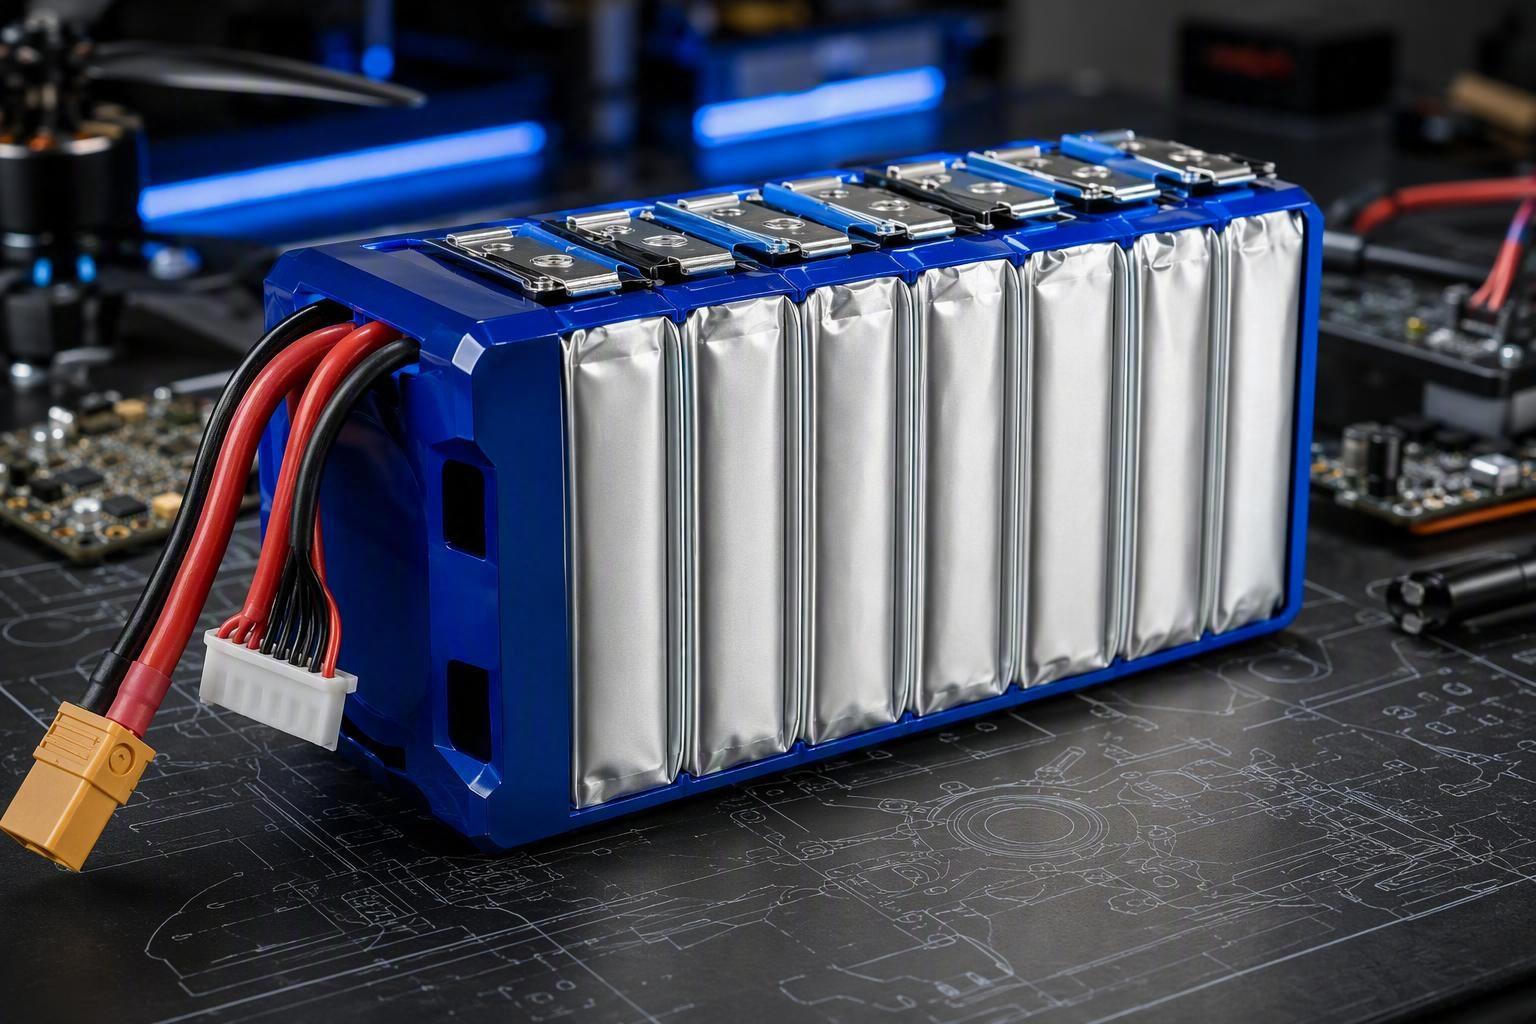
Heavier payloads and more demanding mission profiles naturally push platforms toward higher-voltage architectures. In practice, many heavy-lift fleets have moved through a familiar progression—24S, then 28S, now increasingly 32S—as operators chase more usable power and more stable performance under load.
That evolution makes sense. But it creates a subtle trap:
More flight power does not automatically create more daily output.
The step-change is real—but it doesn’t live only in the air. It also shows up on the ground, in the energy loop you must run all day.
Why Fleet Growth Doesn’t Always Increase Daily Sorties
This is where fleet ops leaders feel the disconnect most sharply.
You add aircraft. You add crews. You add routes.
And yet daily sorties flatten.
Not because the aircraft aren’t capable.
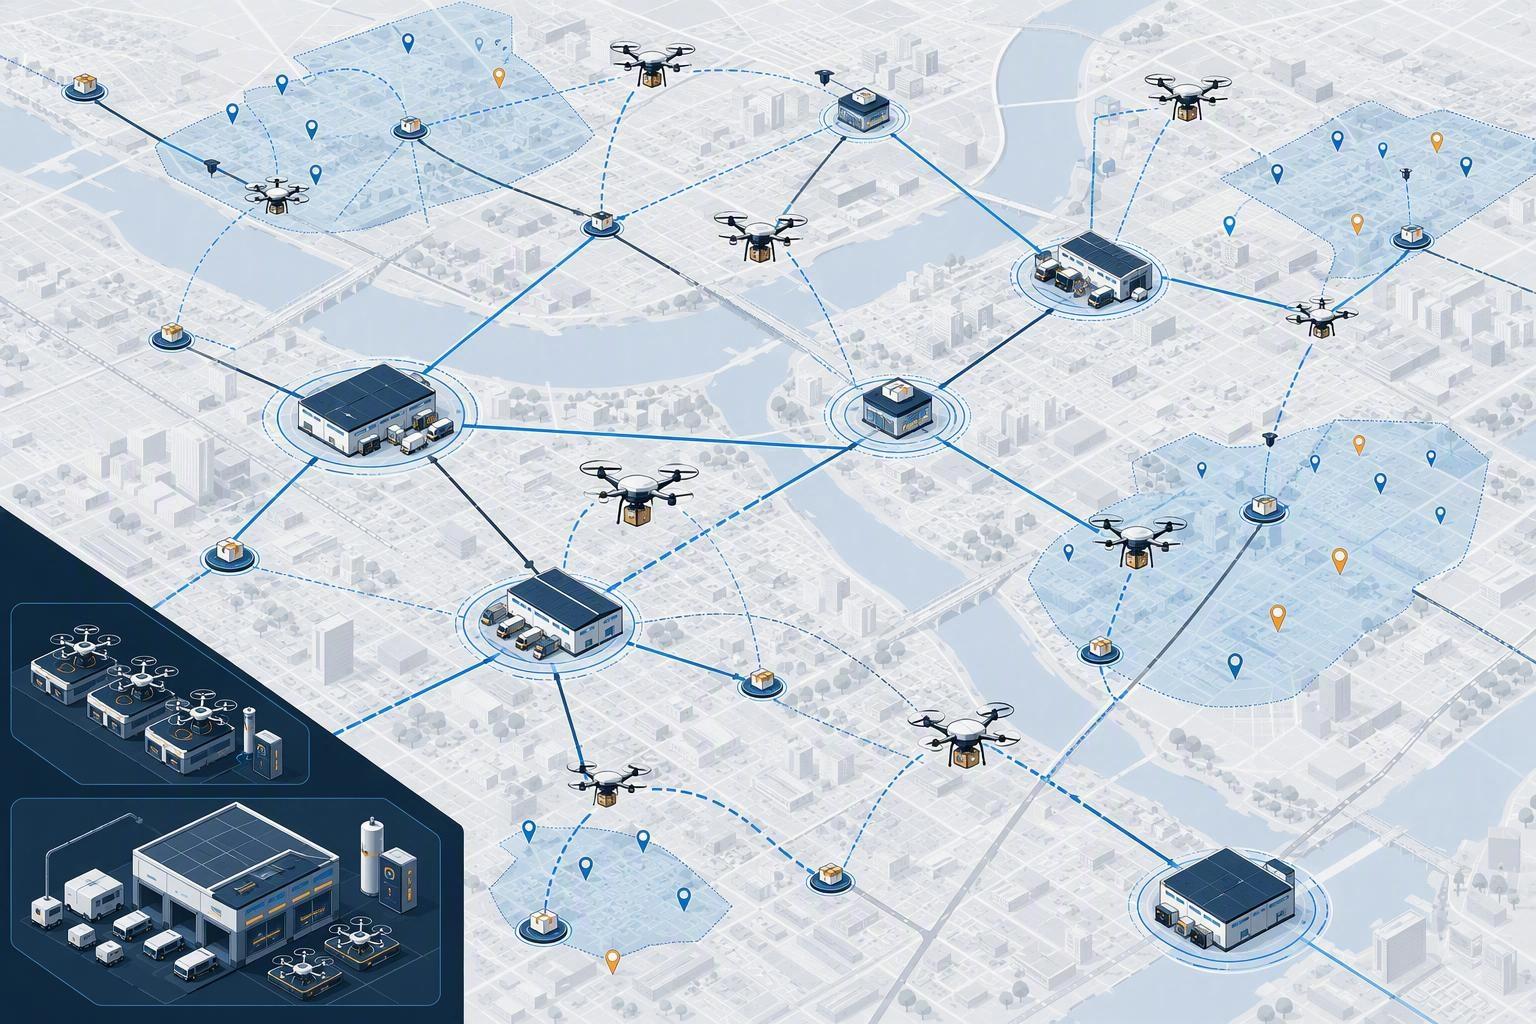
Because the operation has a hidden queue.
The Hidden Queue Behind Every Mission
Every mission creates an energy debt. You repay it on the ground.
At small scale, that repayment looks like a simple task: plug in, wait, swap, repeat.
At fleet scale, it becomes a system with multiple waiting lines—and it’s often your battery turnaround time (not flight time) that starts setting the rhythm:
the aircraft waits for a battery
the battery waits for a charging slot
the operation waits for the turnaround to complete
That queue is often invisible in the KPI dashboard. You won’t see it in “number of aircraft owned.” You’ll see it in:
aircraft sitting ready but grounded
crews idle at the wrong times (and overloaded at the right times)
sorties pushed into later windows, compressing the schedule
end-of-day decisions that feel like triage instead of planning
Operations management has a blunt rule: the bottleneck sets the pace. If one step in your cycle can’t keep up, the whole system slows—and your sortie rate follows.
When energy turnaround becomes that constraint, adding more aircraft can actually increase waiting time—because you’re feeding more demand into the same narrow point. That’s the hidden reason fleet growth doesn’t translate into higher fleet productivity.
A practical queue framing helps here. In plain terms, more work-in-process creates longer waits unless throughput rises too. That’s the intuition behind Little’s Law, commonly used to reason about flow systems with queues and cycle time (see practical explanations from Project Production’s Little’s Law overview and Interlake Mecalux).
You don’t need the math to feel it. You live it.
When Battery Turnaround Becomes the Constraint
Here’s the core scaling problem:
Fleet size scales faster than charging capacity.
Aircraft scale with procurement.
Charging capacity scales with constraints.
Not just “buy more chargers.” Real constraints:
power availability (especially in remote or temporary sites)
physical layout (space, cable routing, safe handling zones)
labor and supervision (who runs the charging lane, who signs off, who audits)
process reliability (how consistently you can reproduce the same turnaround across shifts)
failure impact (one charger fault can cascade into missed sorties)
Even when you can add charging hardware, you may not be able to add charging throughput at the same rate. The constraint is rarely the spec sheet—it’s the operations lane.
And throughput is what matters.
This is why fleet operators increasingly treat energy strategy as an operational decision—not a technical preference. As Commercial UAV News notes in its discussion of battery swapping vs. fast charging for commercial fleet operators, the real question is how quickly aircraft return to service, and what operational burdens each approach creates (inventory, tracking, health management, deployment model).
A counterargument you’ll hear is: “Just buy more batteries.”
That can work—briefly.
But it often shifts the problem from waiting to charge to managing a larger inventory of high-value assets under time pressure. More batteries can reduce one queue while creating another: tracking, rotation discipline, quarantine decisions, site-to-site rebalancing.
At scale, you need something stronger than “more.” You need repeatability.
32S Exposes Turnaround Inefficiency at Scale
A critical clarification: 32S isn’t the problem itself.
What 32S does is remove the last bit of slack in your energy loop. At that point, small delays in charging, verification, handoff, or pack availability stop being “annoyances” and start showing up as aircraft idle time.
In other words: 32S makes the fleet’s throughput ceiling visible.
This section stays operational on purpose. The failure mode isn’t a technical misunderstanding—it’s lost sorties caused by turnaround variance.
Longer Energy Loops
As energy per mission increases, the energy cycle becomes harder to compress.
That doesn’t just mean “charging takes longer.” It means the entire operation becomes more tightly coupled:
one delayed turnaround doesn’t stay local—it pushes into later missions
later missions compress into narrower windows
narrower windows increase handling pressure and decision fatigue
When energy loops get longer, the operation becomes less forgiving. Your buffers shrink.
In practice, ops leaders experience this as a loss of determinism: more days where the plan looks fine at 9 a.m. and breaks by noon.
Here’s the decision-level way to think about it: a modest increase in turnaround variance can erase a surprising amount of daily output. Even if average charge time looks acceptable, variability creates gaps that you can’t schedule around.
For example , if packs return 10–15% less predictably during peak windows, many fleets feel it as 1–2 fewer sorties per aircraft per day on the days that matter most—because aircraft, crews, and payloads end up waiting on the same constrained lane.
More Batteries, Same Bottleneck
When daily output flattens, the first instinct is often: “Buy more packs.”
Extra inventory can reduce one kind of waiting—but it doesn’t remove the constraint. If the charging lane, verification step, or release process can’t keep up, you’ve simply moved the queue.
At scale, unmanaged inventory creates a second problem: you lose readiness visibility. Teams start asking:
Which packs are actually mission-ready right now?
Which are charged but cooling, waiting for verification, or missing paperwork?
Which are cycling too hard because they’re always the “easy-to-grab” ones?
When you can’t answer those questions quickly, you get the worst outcome: more batteries on paper, but the same aircraft idle time in practice.
That’s why throughput-focused fleets treat pack governance as a sortie-rate lever, not an admin task. Spreadsheets can work for a handful of aircraft; they break when you’re trying to run a predictable multi-aircraft schedule.
More Risk Across Multi-Site Operations
Ops leaders typically aren’t most afraid that a battery fails.
They’re afraid the operation becomes unpredictable.
Multi-site scaling increases that unpredictability:
each site develops its own “local way” of doing turnaround
staff training drifts
charging lanes get rearranged and undocumented
inventory doesn’t match scheduling assumptions
the system becomes fragile to one missing person or one faulty charger
This is also where audit and compliance pressure increases. A process that is “fine in practice” becomes harder to defend when incidents happen or when customers ask for proof of control.
Unmanned Systems Technology makes the operational point bluntly in its charger overview: an under-specified or poorly matched charger can become the primary bottleneck in field operations, grounding platforms due to sluggish recharge, faults, or avoidable degradation. Even if you don’t adopt their framing wholesale, the operational logic is hard to dispute: a fragile charging lane is a fragile operation.
The Most Efficient Fleets Are Standardizing Energy Operations
High-performing fleets don’t win by “charging faster.”
They win by turning energy turnaround into a repeatable system.
From Batteries to Energy Systems
A mature fleet stops managing batteries as standalone items.
It manages an energy system:
batteries
chargers
charging SOP
scheduling and dispatch rules
asset tracking and readiness definitions
multi-site governance
This is one reason an ODM/OEM partner model matters. A supplier that can support system-level integration—battery plus operational constraints, plus documentation discipline—reduces the gap between “lab performance” and “fleet determinism.”
Building a Repeatable Charging Workflow
If you want a practical starting point, treat charging like a production lane. Define the lane, define the gates, define the outputs.
A minimal repeatable workflow usually includes:
Clear entry criteria
what happens immediately after landing
who decides whether a pack is eligible for turnaround
A defined queue and capacity model
where packs wait
how charging slots are assigned
what happens when demand exceeds capacity
A verification step before release
a simple, consistent check that the pack is “ready for mission,” not just “charged”
A quarantine path
where suspect packs go
who reviews and when
how you prevent “temporary exceptions” from becoming silent process drift
Traceability
pack ID, cycle logs, incident history
The key is not perfection. It’s repeatability.
If you need an operational reference point for standardization discipline, Colony Core’s scaling guidance is clear: standardize SOPs and equipment management before scaling headcount, including battery rotation schedules and tracking procedures.
For teams that want to formalize battery handling and readiness categories, Herewin’s industrial drone lithium battery maintenance guide provides a practical operations-oriented framing you can adapt to your own governance model.
Don’t treat “more chargers” as the only lever. Throughput often improves faster when you reduce variance—standardize steps, reduce exceptions, and make readiness visible.
Preparing for the Next Stage of Fleet Scale
If your fleet is moving from “dozens” toward “multi-site,” the question isn’t whether energy turnaround matters.
It’s whether you can scale it without scaling unpredictability.
The shift looks like this:
Single-aircraft era: experience and heroics can cover gaps.
Fleet era: the gaps become queues.
Scaled fleet era: the queues become customer-facing delays and compliance exposure.
At that stage, the competitive advantage is not the aircraft alone. It’s the energy operation.
The next bottleneck in heavy-lift drone operations may not be in the air. It may be sitting on the charging table—right in the middle of your turnaround lane.
If you’re scaling 32S operations and want to tighten energy turnaround without adding chaos, Herewin can help you map a practical system across packs, chargers, SOP, and readiness definitions.

 Nederlands
  English
  Español
  한국어
한국어  Deutsch
  Français
  日本語
日本語  Русский
  Bahasa Indonesia
  ไทย
ไทย  العربية
  Português do Brasil
  Italiano