



A pack’s charging time is not a single number you can read off a label. It is the output of a chain: the cell’s permitted charge rate, the pack’s series/parallel configuration, the BMS current ceiling, the charger’s CC-CV behavior, and the temperature the pack actually sits at while charging. Capacity divided by charger current gives you the first link only.
This article walks through that chain in order: the estimate engineers already use, where it breaks, how cell ratings become pack-level charging current, how to match a charger, and what thermal and cycle-life trade-offs decide whether a fast charge is a usable charge. It’s written for the engineer or procurement lead who has to sign off on a charger and defend the number.
How to Estimate Lithium Battery Charging Time
The Basic Charging Time Formula
The starting estimate for charging time is charge divided by current:
t charge = C pack / I charge
where C pack is the pack capacity in ampere-hours and I charge is the charging current in amperes. In C-rate terms, a 0.5C charge implies roughly 2 hours, 1C roughly 1 hour, and 2C roughly 30 minutes. The C-rate here is a charge C-rate: current divided by the pack’s rated capacity. It is a different quantity from the discharge C-rate printed on a datasheet, and the two are not interchangeable.
That formula is a bookkeeping identity, not a prediction of a session. It assumes no losses and no tapering, so it only describes the constant-current portion of a charge.
How Capacity and Charging Current Affect Charging Time
Two levers move the estimate, and they do not move it symmetrically.
Capacity is set by the cells and the parallel count. A larger pack takes proportionally longer at the same current, and proportionally more current to hit the same time. That part is linear and reliable.
Charging current is where the linearity fails. Doubling the current does not halve the session, because the last portion of charge is delivered under a voltage hold rather than a current limit. Battery University’s BU-409: Charging Lithium-ion describes the effect directly: increasing charge current does not hasten the full-charge state by much, because the battery reaches the voltage peak sooner but the saturation stage then takes correspondingly longer. A high-current charge will, however, quickly fill the battery to roughly 70 percent.
That 70 percent figure is the practical reason the formula is useful but insufficient. It tells you how fast you can get to a working state of charge; it does not tell you when the charger will terminate.
A Practical Example of Charging Time Calculation
The cleanest published illustration of the gap between the formula and the session comes from a Keysight application note on battery test and validation that instruments a full charge of a 20 Ah cell.
Example assumption (from the cited test): a fully discharged cell is charged at 1C = 20 A in constant current from 2.4 V to 3.8 V, then held in constant voltage with a 0.05C = 1 A termination limit.
Formula estimate: t = 20 Ah / 20 A = 1.0 hour.
Actual measured session: approximately 2 hours 20 minutes, storing 19.9 Ah.
Constant-current phase: about 53 minutes, storing 17.65 Ah.
Constant-voltage phase: about 1 hour 27 minutes, storing only 2.25 Ah.
The constant-current phase delivered 89 percent of the stored charge in 38 percent of the session time. The remaining 11 percent consumed the other 62 percent of the clock. Any estimate built on capacity divided by current describes the first phase and silently omits the second.
For pack-level planning, treat the formula as a lower bound on the constant-current phase and add a taper allowance. A defensible first-pass estimate is:
t session ≈ t CC + t CV
where t CC is the capacity-to-be-delivered-in-CC divided by the CC current, and t CV is read from the cell or pack charge curve at the intended termination current, not calculated. If no curve is available, the estimate is not yet an estimate — it is a hope.
Why Actual Charging Time Is Longer Than the Estimate
CC-CV Charging and the Current Tapering Stage
Lithium-ion battery packs commonly use a two-stage CC-CV charging process. During the constant-current phase, the charger supplies a controlled current while pack voltage rises. Once the pack reaches its configured voltage limit, the charger enters constant-voltage mode and gradually reduces current. The BMS monitors individual cell voltages and temperatures throughout the process; depending on the system architecture, it may communicate charging limits to the charger or disconnect the charging path if a protection threshold is reached.
The taper exists for an electrochemical reason: as the cell approaches full charge, lithium-ion concentration in the electrolyte has to equilibrate, and holding voltage constant lets current decay as that happens. Charging is normally considered complete when current falls below a threshold — commonly C/20 or C/50 — not when voltage is reached.
Think of it like filling a bucket through a sponge. Most of the water goes in fast, but the last bit has to soak through slowly — and it takes far longer than its volume suggests.
The consequences for planning are concrete:
The CV phase adds the remaining charge after the cell reaches its voltage limit, but its contribution to total capacity and charging time varies with cell chemistry, charge rate, temperature, and termination current. In the Keysight test above, the CV phase added about 11 percent of the stored capacity while accounting for roughly 62 percent of the total charging time.
Manufacturer “10–80 percent” charge-time claims don’t scale linearly to 100 percent, because the taper shape depends on chemistry and temperature.
A charger that terminates on voltage alone, without a current or time cutoff, will either stop early or hold the pack at full voltage longer than intended.
Datasheets encode this. The Samsung INR21700-50E specification lists CC-CV as the charging method, a standard charge current of 2,450 mA (0.5C), a standard charge time of 4 hours, and a maximum charge current of 4,900 mA explicitly marked “not for cycle life.” That standard time is not 5,000 mAh divided by 2,450 mA, which works out to about 2 hours. It is the vendor’s figure for a complete CC-CV session at the specified current, voltage, and termination condition. Standard charge time is a measured outcome, not something you back out of capacity and current.
Temperature and BMS Charging Limits
The pack does not charge at whatever the charger can deliver. The BMS sits between them and enforces limits the charger cannot see.
Temperature gating is the most common. The Samsung 50E and Molicel INR-21700-P42A datasheet both allow charging between 0°C and 45°C, but the permitted window is cell- and pack-specific rather than a general lithium rule. Victron’s lithium manual is stricter at the low end: it warns against charging below 5°C, and its Lithium Smart Battery defaults the minimum charge temperature accordingly. A pack that arrives cold from a vehicle bed or a winter field site will either refuse charge or accept a heavily reduced current until it warms up.
Current gating is the second limit. The BMS reads each cell individually and can restrict or interrupt charging when one approaches its voltage or temperature limit — through charger communication where the architecture supports it, or through a straight protection cutoff in simpler systems. Pack-average voltage can’t detect a single high cell, which is why per-cell sampling matters. A related third gate is the charging protocol itself: a smart pack only hands out its real current and voltage limits if the charger can read them.
The practical rule pulls those limits together: achievable charging current is whichever is lowest of the charger’s output, the BMS limit, the thermal limit at the current temperature, the cell rate scaled to the pack, and the interconnect and connector rating. It can change mid-session — a pack that accepts its full rated current at 25°C may take only a fraction of it at 0°C.
Cell Consistency and Pack-Level Constraints
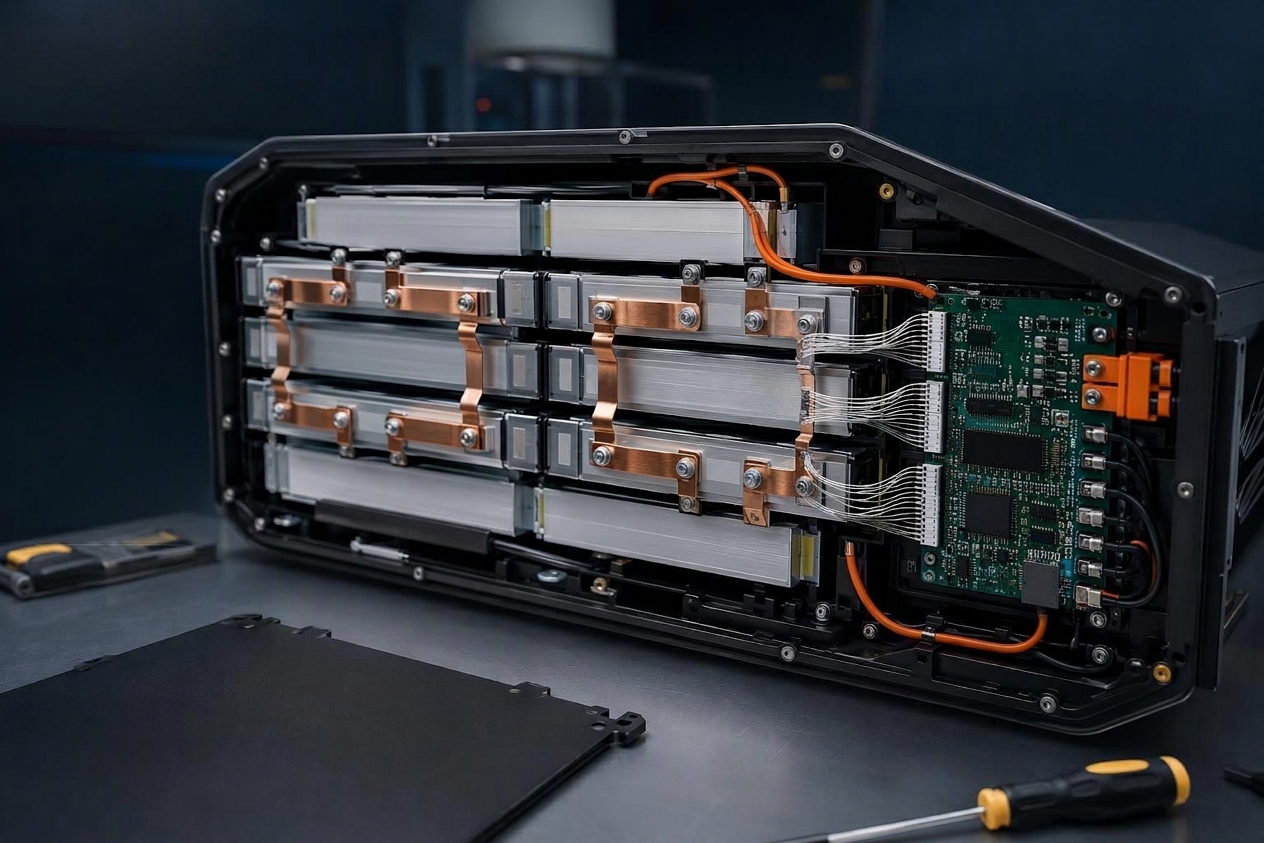
A pack is a short-board system, not a sum of cell capabilities. When cells are mismatched, the weakest one sets the endpoint. During charge, the cell with the lowest capacity or the highest voltage hits the cutoff first, the BMS ends the session, and the stronger cells are left partly charged. Cell mismatch can reduce usable pack capacity because the first cell to reach a limit decides when charging or discharging has to stop. How much you lose depends on cell variation, pack topology, operating conditions, and BMS strategy. High-resistance cells run hotter too, which widens the spread further.
Two pack-level constraints compound this:
Interconnect resistance. Busbars, welds, and connector contacts add resistance to the current path. At high charging currents these joints generate extra heat and voltage drop, and uneven current paths can create localized hot spots — so busbar layout and voltage-sensing placement matter as much as cell choice.
Balancing headroom. Passive balancing typically runs only during the constant-voltage stage. A pack repeatedly charged to less than full never gets that balancing time, and imbalance builds up over cycles.
The engineering implication: a pack’s real charging current is a property of the assembled pack, its sorting quality, and its BMS — not of the cell datasheet alone.
How to Choose the Right Charging Current
This is where the chain comes back to the cell. Everything above explains why a pack charges the way it does; the next step is turning a cell’s ratings into a number you can actually charge a pack at.
Worked example using stated assumptions, not a measured pack: 4.2 Ah cells with a 1C standard charge current, arranged 6S4P. Series count sets voltage (4.2 V × 6 = 25.2 V); parallel count sets capacity and current (4.2 Ah × 4 = 16.8 Ah; 4.2 A × 4 = 16.8 A). A BMS rated for 12 A continuous charge then becomes the governing limit, below the cell-derived figure.
Check the Cell’s Recommended Charging Rate
Start with the cell specification, and read it precisely. Datasheets typically give several distinct numbers that are easy to conflate:
Standard charge current — the rate at which the published capacity and cycle-life figures were measured. For the Samsung INR21700-50E this is 2,450 mA (0.5C); for the Molicel INR-21700-P42A it is 4.2 A (1C).
Maximum charge current — an absolute ceiling, often with a caveat. The 50E lists 4,900 mA as maximum charge current, explicitly “not for cycle life.”
Discharge current — a separate rating entirely. The Molicel P42A lists a 45 A continuous discharge current alongside its 4.2 A standard charge current. The 45 A figure says nothing about charging.
That last point is the most common error in pack specifications. A cell marketed at 5C, 10C, or 20C discharge is being described as a power cell, not a fast-charge cell. Discharge rate reflects the cathode’s ability to deliver current; charge rate is limited by anode acceptance and lithium plating risk, which are different constraints. Never carry a discharge C-rate into the charging calculation.
Calculate the Pack-Level Charging Current
Cell ratings convert to pack ratings through the series/parallel topology, and the two dimensions behave differently.
Series count (S) multiplies voltage. Charging voltage for the pack is the per-cell charge voltage times the series count. Current is unchanged by series connections.
Parallel count (P) multiplies capacity and current. Pack capacity is cell capacity times P; permitted pack charge current is cell charge current times P. Voltage is unchanged by parallel connections.
For a closer look at how those two dimensions interact in real designs, see our guide to series and parallel battery pack configuration.
Worked example. Take a pack built from 4.2 Ah cells with a 1C standard charge current (4.2 A per cell), arranged 6S4P.
Pack nominal capacity: 4.2 Ah × 4 = 16.8 Ah.
Pack charge voltage: 4.2 V × 6 = 25.2 V (using a 4.2 V/cell charge limit).
Cell-level permitted charge current: 4.2 A per cell.
Naive pack-level current: 4.2 A × 4 = 16.8 A, i.e. 1C at the pack level.
Now apply the constraints the multiplication ignores. The cell-level rating gives a theoretical pack current of 16.8 A at 1C. But the BMS is rated for only 12 A continuous charging, so the pack-level limit is 12 A — assuming the charger, thermal design, and interconnects can support that current. If the interconnects add enough resistance that 12 A drives one parallel string to the cutoff early, the BMS will cut the CC phase short and the session stretches out.
If your design target is deliberately more conservative — say 0.5C at pack level, or 8.4 A — that’s a design choice, not a cell specification, and it should be labeled as such. The cell’s standard charge rate in this example is 1C.
So the pack-level charging current is:
I allowed = min(I cell × P, I BMS, I charger, I thermal(T), I interconnect)
Every term has to be an allowed current limit under the same charging condition. If one is quoted at a different temperature, duty cycle, or termination point, convert it first — otherwise you’re comparing unlike quantities. Your charging time estimate then uses I allowed, not I cell × P.
From here, charge current becomes a three-way trade: speed against heat against life. Resistive losses scale with the square of current, so a pack with no thermal path beyond its own surface hits its temperature ceiling before its current ceiling. On the life side, the datasheet’s cycle-life figure was almost certainly measured at the standard charge current, not the maximum.
A simple rule covers most cases: use the standard rate for daily cycling and warranty-sensitive work, go between standard and maximum only where the thermal design has been validated and the life penalty priced in, and treat the maximum rate as a peak capability rather than a design point unless the vendor explicitly supports cycling at it.
How to Match a Charger with a Lithium Battery Pack
Match the Charging Voltage to the Pack Configuration
The charger’s output voltage must equal the pack’s required full-charge voltage, which is the per-cell charge voltage times the series count. This is a hard constraint, not a preference.
Per-cell charge voltage is chemistry-specific. The Samsung 50E and Molicel P42A both specify 4.2 V per cell. Battery University notes that prolonged charging above 4.30 V on a cell designed for 4.20 V plates metallic lithium on the anode, destabilizes the cathode, and raises cell pressure until the current interrupt device operates. There’s no useful margin above the specified voltage.
Two consequences for matching:
A charger whose output voltage is below the pack’s required full-charge voltage will undercharge it, and the pack will never reach the balancing stage.
A charger whose output voltage is above it — including a “12 V” charger applied to a 4S pack expecting 16.8 V, or a 6S charger applied to a 4S pack — is a safety issue, not a performance one.
Victron’s published settings show the pattern at pack level: a 12.8 V nominal battery uses a 14.2 V absorption voltage and a 13.5 V float, while a 25.6 V nominal unit uses 28.4 V and 27.0 V. The ratio is consistent because the series count doubled.
Check Current Output and CC-CV Requirements
The charger’s rated output should be selected according to the target charging current. A charger with a lower current rating can still be compatible, provided its voltage and charging profile are correct; it will simply extend the charging time. A charger with a higher maximum current rating can also be used if its configured output is limited to the pack’s permitted charging current.
Three numbers get confused here, and they need keeping apart: the charger’s maximum rated output, the CC current it is actually configured to deliver, and the current the pack permits under its present conditions. Only the third is a limit the design must respect; the first two are a matching and configuration exercise.
The charger should also implement CC-CV rather than acting as a fixed-voltage supply. That requirement has three parts to verify:
Constant-current value. Confirm the charger’s CC setpoint is at or below the pack’s permitted charge current, not merely at or below its own maximum rating.
Constant-voltage value and tolerance. Confirm the CV setpoint matches the pack’s required full-charge voltage within the tolerance the BMS expects.
Termination. Confirm the charger terminates on current falling below a threshold, or on a time limit, or both. The Samsung specification requires the charger to stop by detecting either charging time or current, and requires charging to stop if it is not completed within the specified time. A charger that holds voltage indefinitely after the current has bottomed out is applying continuous stress at the high-voltage threshold.
Verify BMS, Connector, and Communication Compatibility
The BMS is the authority in the charging path, and the charger must be compatible with how that authority is expressed.
Protection logic. The BMS protects cells against overcharge, undercharge, and charging at low or high temperature. It monitors each individual cell, balances cell voltages, and on a high or low cell voltage or temperature condition generates an alarm that causes the BMS to turn off loads and/or chargers. A charger that does not accept a charge-disconnect signal, or that restarts automatically after the BMS disconnects, defeats the protection.
Communication. Many industrial packs expose charge limits over a bus — CAN and RS485 are common on industrial and vehicle packs — and the charger is expected to read the pack’s current and voltage limits rather than apply fixed settings. Where communication is absent, the charger must be configured conservatively for the least capable pack it will see.
Connector and wiring. Verify connector type, pinout, current rating, and polarity. Check cable cross-section against the charge current, and confirm the connector’s temperature rating under continuous charge — a connector rated for discharge current isn’t automatically rated for a sustained charge, because the duty cycle differs. Our overview of UAV and industrial pack connectors covers the common families and their limits.
Pre-charge and recovery behavior. Cell specifications commonly define a pre-charge mode for deeply discharged cells — the 50E specifies 1.0–3.0 V with a 0.1–0.5C current, and requires that a cell below 1.0 V not be charged. Confirm the charger or BMS implements this rather than applying full current to a depleted pack.
This is the section where a supplier’s technical documentation should be requested rather than inferred. Ask for the pack’s charge voltage, permitted charge current versus temperature, BMS current limit, communication protocol and register map, and the charger’s CC-CV profile — as documents, not as verbal assurances.
What to Consider Beyond Charging Time
Temperature and Thermal Management
Temperature limits charging in two ways: it caps the current the BMS will allow, and it wears the pack out while that current flows. The permissible window is product-specific, so follow the manufacturer’s numbers rather than a universal range. On the wear side, elevated charging temperatures generally accelerate degradation, but how much depends on chemistry, voltage limits, charge rate, and cooling. That’s why a pack can hit its charge-time target and miss its cycle-life target — it charged fast and hot.
Practical thermal measures, in order of effectiveness:
Charge within the window, and precondition when outside it. Warming a cold pack before charging reduces plating risk and allows a higher initial current; it also adds time to the session, which must be counted.
Provide a thermal path. Cells buried in a sealed enclosure with no conduction path to a heat sink will derate themselves. Airflow, conduction pads, or liquid cooling change the achievable current materially.
Monitor per-cell, not per-pack. A single hot cell is invisible to a pack-average temperature reading and is exactly the cell most likely to fail.
Fast Charging and Cycle Life
Fast charging usually gets framed as a capability question — can the pack take 2C, 3C, 4C? The more useful question is what that rate costs you. Cycle life is the obvious bill: the datasheet’s “not for cycle life” note says the fast rate and the published cycle count aren’t available at the same time. Cooling is the less obvious one, and it has to be sized for the charge rate rather than the average duty cycle — a system-level mass and cost item, not a battery-only one.
A fast-charge claim is only verifiable alongside the charge rate, ambient temperature, cooling provided, termination current, and the cycle-life figure measured under those conditions. Without those, treat it as marketing.
Charging Requirements for Repeated-Use Applications
For equipment that cycles several times a day — agricultural drones, inspection aircraft, electric industrial vehicles, swap-station fleets — charging time is a throughput variable, not a convenience.
The relevant calculation is not single-pack charge time but the ratio of charge time to work time:
packs_required ≈ ⌈1 + (t charge / t work)⌉
where t work is the usable work duration per charge and t charge is the realistic session time including taper, cool-down, and any preconditioning. This is a simplified estimate for continuous operation with battery swapping: it assumes each pack goes straight to the charger after a job, that charge and work alternate across multiple packs, that t charge already includes the CV tail and cool-down, and that charging-station capacity and downtime are handled separately. Round the result up to the next whole pack, then add operational reserve for charging-station limits, unexpected downtime, and battery aging.
The arithmetic still bites. If a pack delivers 20 minutes of work and needs 90 minutes to charge, a single-pack operation is not viable regardless of how fast the CC phase is; the answer is more packs, a swap scheme, or a shorter charge — and each of those has its own cost.
Two further considerations for repeated use:
Charge tapering compounds across a shift. If the last 20 percent of charge takes as long as the first 80, and the operation only needs 80 percent, charging to 80 percent may be the correct policy — provided the pack still gets periodic full charges for balancing.
Cool-down time is part of the cycle. A pack that finishes a high-rate discharge hot cannot immediately accept a high-rate charge. The interval between landing and charging is a real constraint on fleet sizing and should be measured, not assumed.
A Practical Checklist for Battery Charging Requirements
The table below consolidates the inputs that determine whether a charging setup is viable. Each row is a question to answer with a document, not an assumption.
Check item | Information to confirm |
|---|---|
Battery configuration | Cell chemistry, series/parallel configuration, nominal and full-charge voltage |
Capacity | Rated capacity and usable capacity, and the capacity at the intended charge temperature |
Charging current | Cell standard and maximum charge current; pack-level permitted current after parallel scaling |
Charging voltage | Required full-charge voltage (per-cell limit × series count) and charger tolerance |
Temperature | Permitted charging temperature range, BMS derating curve, and preconditioning requirement |
BMS | Current limits, per-cell protection thresholds, balancing behavior, and communication protocol |
Charger | CC-CV profile, voltage and current setpoints, termination method, and connector rating |
Work the rows in order. Configuration and capacity set the voltage and the current scale; the cell rating sets the ceiling; the BMS and temperature set the achievable value; the charger must sit inside all of them. A charger that matches the first two rows but not the last three is the most common mismatch in the field. If the pack is meant for a duty cycle rather than a single charge, run the throughput calculation above before you commit to a charger specification.
Next Step on Pack and Charger Sizing
A pack’s charging time is a system property, not a datasheet number: the cell’s rate, the pack topology, the BMS limit, the charger profile, and the temperature in front of you all decide it. Work through the chain in that order and you’ll have an estimate you can defend.
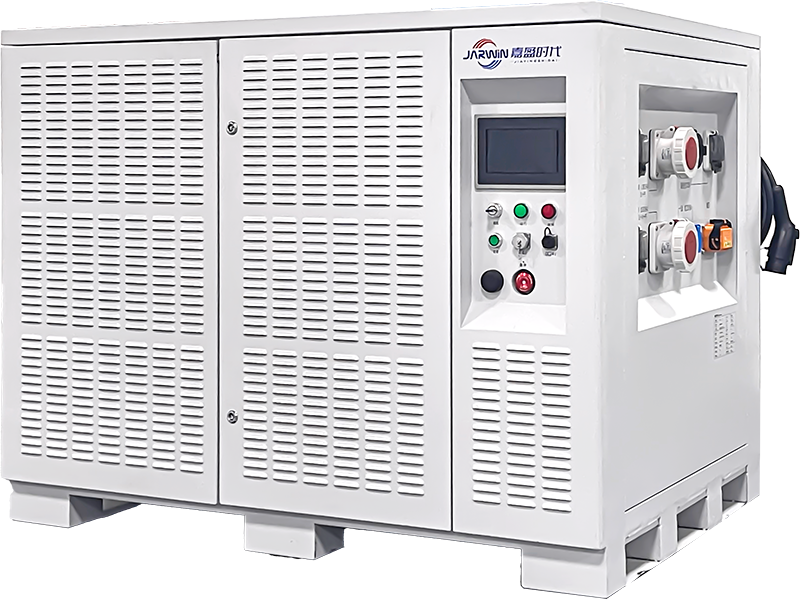
If you’re sizing a pack and charger for a specific duty cycle, send us your work and charge times together with your temperature range. Herewin builds cells and packs in-house and supports selected pack lines with matching UAV battery chargers, so voltage, BMS limits, and charge profile can be fixed at the design stage — and we’ll help you arrive at a charging current your operation can actually sustain.




 한국어
 English
 Español
 Deutsch
 Français
 日本語
 Русский
 Bahasa Indonesia
 ไทย
 العربية
 Português do Brasil
 Italiano
 Nederlands