


Victory in elite racing isn’t a matter of a single burst; it is defined by sustained throttle authority. For professional teams, the performance frontier has moved toward maintaining stability under extreme loads—specifically, targeting a sub-5% voltage droop during high-C pulls on a 5″/6S baseline.
While a ~100C burst represents the absolute ceiling of competitive power, reaching this benchmark is a systemic challenge. It is not a static rating, but a goal sensitive to pack temperature, connector integrity, and telemetry calibration. This article explores why semi-solid architectures are emerging as the solution for these peak demands, offering a protocol to audit these gains via Blackbox telemetry and refine race-day engineering.
Why Racing Drones Need a New Battery Architecture
Voltage sag at 80–120C isn’t just inconvenient,it reshapes throttle feel, PID authority, and prop loading in the final straight. Add weight constraints, batch‑to‑batch IR spread, and the pressure of back‑to‑back heats, and the limits of conventional LiPo show up exactly when lap times are on the line.
Common High‑C Battery Challenges in FPV
Sag during long straights: high instantaneous I·R drop lowers VBAT, forcing ESCs and motors to operate off the sweet spot.
Weight vs. capacity: heavier packs blunt agility and raise rotational inertia; lighter packs can brown out earlier under load.
IR variability: cell‑to‑cell mismatch within a pack widens voltage divergence, stressing the weakest cell first.
Turnaround stress: fast top‑offs between heats amplify thermal and plating risks, compounding resistance growth.
Why Traditional LiPo Falls Short for Pro Racing
Conventional liquid‑electrolyte LiPo relies on an SEI that can thicken and fracture under extreme pulses, raising interfacial resistance and accelerating sag. High‑voltage operation pushes cathode surfaces toward reconstruction and higher impedance, especially as temperature swings during race cycles.
How Semi‑Solid Batteries Reduce Voltage Sag
Semi‑solid architectures blend polymer/gel matrices with optimized electrolytes to retain near‑liquid ionic conductivity while gaining mechanical stability. In practice, that stability helps the interphase and interfaces resist pulse‑induced damage, keeping impedance low when you need it most.
Optimizing the SEI for Ultra‑Low Interfacial Resistance
Research shows that LiF‑containing, mechanically robust SEI layers formed via fluorinated electrolyte strategies can improve high‑rate stability by slowing interfacial resistance growth during bursts. For example, studies report that dispersed‑LiF interphases enable better Li‑ion transport and durable cycling under high stress—findings that are broadly consistent with how many engineers think about stabilizing interfaces in racing‑grade packs. See the 2025 analysis of dispersed‑LiF interphases summarized by the U.S. DOE’s OSTI overview of LiF‑rich SEI architectures and complementary findings in PNAS on LiF‑enabled interphases (2025). Earlier additive work on FEC also documents thinner, inorganic‑rich SEI and enhanced rate capability in various chemistries; refer to ACS Applied Materials & Interfaces (2021) and mechanistic notes from PSI’s SEI formation highlight (2021).
The takeaway for semi-solid drone batteries: a thin, LiF-rich, and mechanically adaptive SEI reduces the energy barrier for Li+ transport. By aligning engineering practices with these fluorinated electrolyte strategies, semi-solid cells can effectively suppress the “impedance cliff” typically seen after the first 3 seconds of a full-throttle pull.
High‑Voltage LCO Stability at Extreme C‑Rates
Pushing >4.5 V on LCO stresses layered structures through H1–H3 transitions, which can trigger impedance spikes. Literature indicates that interfacial engineering—conformal coatings, oxyfluoride surface layers, and minor cation doping—helps curb reconstruction and oxygen loss, stabilizing high‑voltage output. Methodologies tracking impedance growth and structural changes are detailed in Chemistry of Materials (2022) on LCO impedance evolution and high‑voltage pairings such as ACS Energy Letters (2024) on LCO to 5.2 V, with analogous mitigation patterns reported for high‑Ni layered oxides in Chemistry of Materials (2024).
Power‑to‑Weight and Handling Gains on 5″/6S
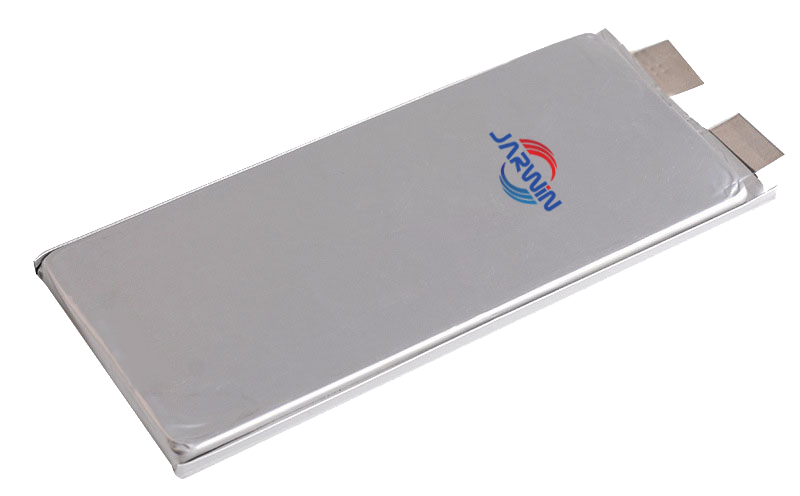
Semi‑solid packs typically use lightweight aluminum‑laminate pouch films and can reduce free electrolyte content. Less metal and solvent mass means higher TWR and lower rotational inertia—small differences you feel in snap rolls and gate corrections.
Lightweight Pouch Film and Compact Stack Design
Aluminum‑plastic film enclosures cut grams versus rigid cans, and compact stackups keep conductors short. Every milliohm you strip from tabs, bus bars, and leads is one less source of I·R sag and heat.
Lower Rotational Inertia for Crisper Cornering
Tighter pack geometries allow mounting closer to the frame’s roll/pitch axes. Think of it like sliding a dumbbell weight toward the center: inertia shrinks, and the quad “snaps” into line faster.
Fast Charging and Thermal Stability for Race Days
Race days demand quick turnarounds without plating or runaway risk. The rule of thumb: temperature, profile, and materials must work together.
5C+ Charging Within Safe Guardrails
Fast‑charge reviews highlight three levers for plating suppression: keep cells warm enough to avoid sluggish kinetics, enforce SOC‑dependent current taper, and use interphases/electrolytes that sustain charge‑transfer rates. For perspective on the mechanisms and controls, see Energy Materials Advances’ 2024 fast‑charge review and an ACS Chemical Reviews perspective on extreme‑fast charging (2025). Operationally,avoid charging near or below 0 °C, pre‑warm to ≥10 °C, and cap peak pack temps in the ~55–65 °C range depending on the chemistry and BMS policy; see airline and industry guidance compilations such as IATA’s lithium battery guidance document (2026).
Dynamic Thermal Monitoring for Back‑to‑Back Heats
Use ESC/flight‑controller telemetry to watch pack temp proxies and connector ΔT. Command‑queue your chargers with minimum‑temperature gates and taper logic; log each turn so plating‑risk segments can be audited later.
Field Telemetry: Redefining the Discharge Curve in Elite Racing
The performance bar is simple to state but mechanically demanding: maintaining a plateaued VBAT during a sustained ~100C burst. On a 5″/6S baseline, targeting a voltage droop within the 5% threshold represents the current engineering ceiling.
Note: Achieving this requires minimizing parasitic resistance. At 200A+, even a 2mΩ deviation in XT60 connectors or lead-wire solder joints can double the observed sag, regardless of cell chemistry.
Real‑Time OSD/Blackbox Analysis on the Baseline Platform
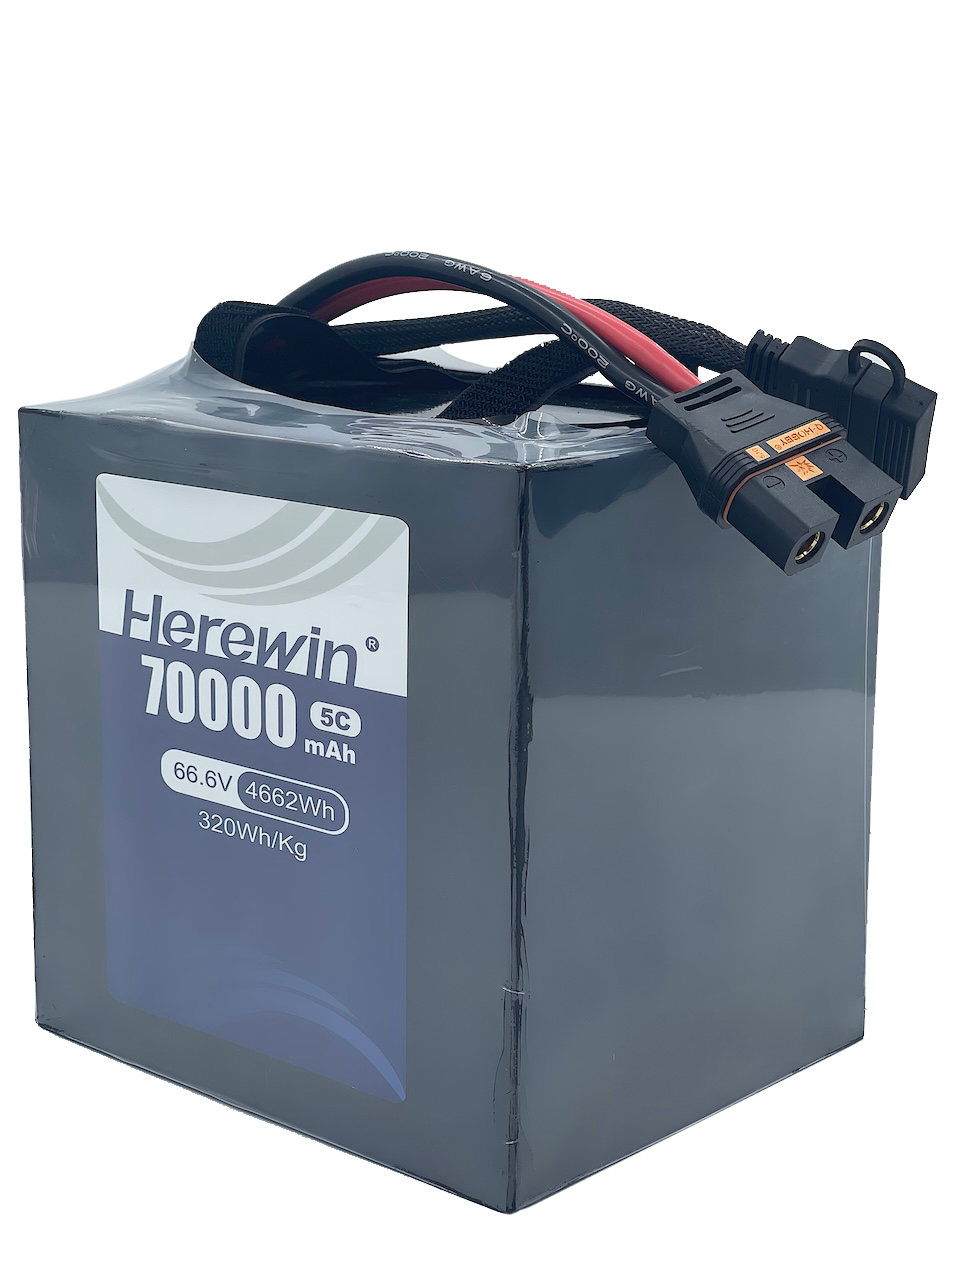
Here’s a reproducible protocol on a 5″ / 6S / 2207 1950KV quad (AUW 650–750 g; 5146–51466 prop; target peaks 180–220 A):
Betaflight Blackbox at ≥1 kHz, logging VBAT (raw), current, motor commands, eRPM via DShot, and ESC temperature. See Betaflight Blackbox documentation そして battery monitoring guide.
Fly matched packs back‑to‑back on a layout with a 6–10 s straight. Keep PIDs/filters/props identical.
Metric: % VBAT drop over the longest full‑throttle interval. Goal: ≤5% over 8–10 s near ~100C. Corroborate on a motor dyno reproducing the current/time profile.
Energy Density, Cycle Life, and Season TCO
Semi‑solid packs aim to combine higher energy density with better high‑rate durability, which can lower the cost per competitive lap. A simple way to model Total Cost of Ownership (TCO).
Cost per cycle = Pack price / Useful high‑rate cycles (to your performance cutoff)
Cost per race day = (Laps per day ÷ laps per cycle) × cost per cycle × packs in rotation
Below is a compact sensitivity snapshot for a 6S racing pack budget (illustrative math for planning):
Variable | Case A | Case B |
|---|---|---|
Pack price (USD) | 65 | 95 |
Useful high‑rate cycles to cutoff | 60 | 110 |
Cost per high‑rate cycle (USD) | 1.08 | 0.86 |
Laps per cycle (to cutoff) | 10 | 10 |
Cost per lap (USD) | 0.11 | 0.09 |
Label your own performance cutoff (e.g., when voltage droop exceeds 7% at 100C). If semi-solid technology maintains its interface integrity longer, your cost-per-competitive-lap decreases—even at a higher initial unit price.
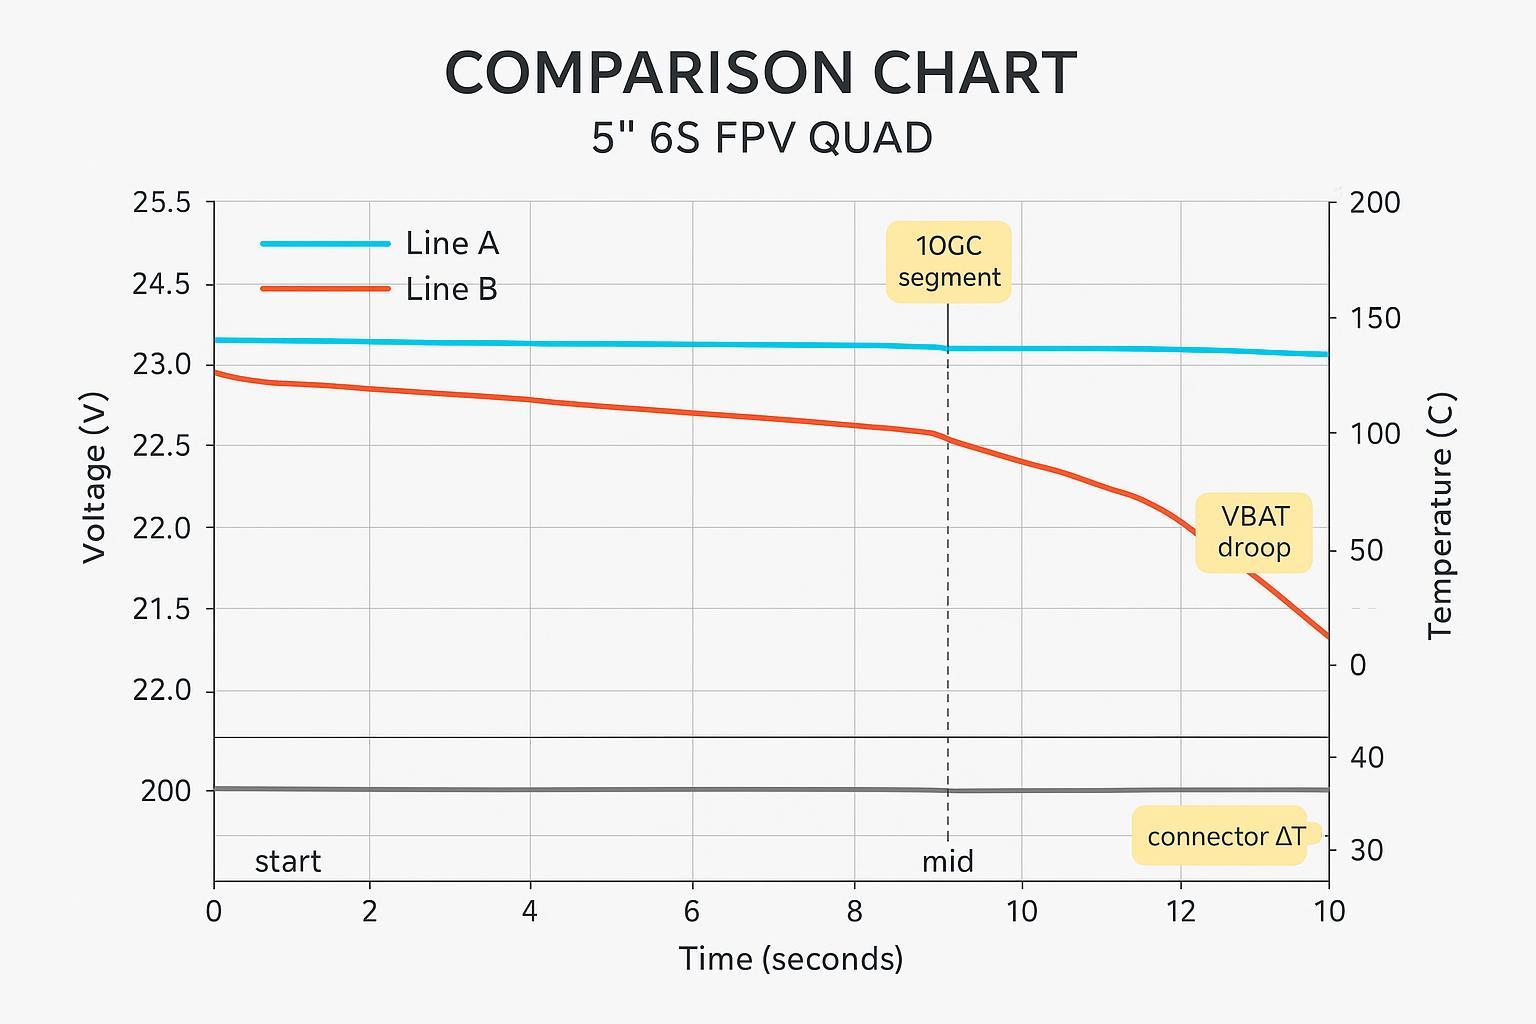
Quantitative Visual Comparison
In controlled tests, you should see two distinct signatures on the final straight:
Semi‑solid: flatter VBAT trace with ≤5% droop across 8–10 s near ~100C; lower connector ΔT.
Reference LiPo: progressive droop and widening cell divergence under identical load.
Publish raw logs (CSV/BBL) and bench scripts when possible so your sponsors and engineers can audit results.
Semi‑Solid vs. Traditional LiPo: Side‑by‑Side
Voltage Sag at High C and Under G‑Loads
Expect semi‑solid to delay droop onset and reduce the slope of VBAT decline in sustained pulls. The benefit is most visible after the first 3–4 seconds of full throttle when conventional packs’ interfacial resistance spikes.
Thermal Stability and Fast‑Charge Capability
Semi‑solid matrices resist solvent pumping and mechanical breathing, contributing to steadier impedance vs. temperature swings. With proper pre‑warm and taper control, 5C top‑offs can be executed inside plating‑safe windows, subject to your chemistry and BMS limits.
Custom Battery Engineering for Competitive Teams
Bespoke Pack Design and Micro‑Ohm Matching
Demand micro‑ohm‑level internal resistance matching at cell and tab level. Specify bus bar cross‑sections, connector types, and lead lengths with milliohm budgets so you can predict sag and heat before race day.
Multi‑Axis Dynamic Response Optimization
Mount packs to minimize lever arms and protect airflow to ESCs. Re‑balance after every pack change; battery geometry subtly shifts roll/pitch authority.
Technical Protocol: High-Rate Semi-Solid Cell Performance Audit (5″/6S)
To quantify the performance delta of semi-solid architectures, we recommend a controlled stress test. To ensure reproducible results, maintain a standardized environment: Ambient 20–25 °C, AUW 700 g, and 51466 tri-blade props.
The core benchmark focuses on VBAT stability during a sustained 8–10s burst (~100C). While traditional liquid electrolytes often suffer from non-linear impedance growth, semi-solid cells utilizing LiF-rich SEI optimization demonstrate the potential to minimize voltage droop toward the 5% threshold. We recommend treating 1 kHz telemetry as primary audit evidence to validate power redundancy before scaling inventory.
Safety Systems and Race‑Day SOPs
Proactive Alerts and Failure Prediction
Set BMS/OSD alerts on absolute voltage, dV/dt under throttle, and temperature rates of change. Flag packs whose IR spread widens beyond your acceptance gate.
Post‑Race Recovery and Standardized Maintenance
After hard heats, rest packs to thermal equilibrium before charging. Balance charge, log IR at a consistent SOC, and retire packs whose droop exceeds your cutoff. Keep a traceable maintenance record.
Preventing Thermal Runaway: Five Mitigations
Use fire‑resistant storage and transport containers; comply with UN38.3 shipping and IATA limits. See UN 38.3 test requirements (UNECE) そして IATA lithium battery guidance.
Inspect and replace abraded leads; high‑resistance joints are heat points.
Pre‑warm in cold weather; avoid charging below ~10 °C unless chemistry is validated for it.
Define charger profiles with temperature and SOC gates; enforce taper.
Limit pack clamping force; avoid mechanical damage to pouch edges and tabs.
Next Steps for Engineering Teams
For engineering teams seeking to evaluate these semi-solid benchmarks against a specific 5″/6S baseline, Herewin’s technical team is available for deep-dive consultations. We invite technical leads to coordinate with our engineering department to discuss testing methodologies, align telemetry protocols, and exchange insights on maintaining data integrity under extreme high-rate conditions.