








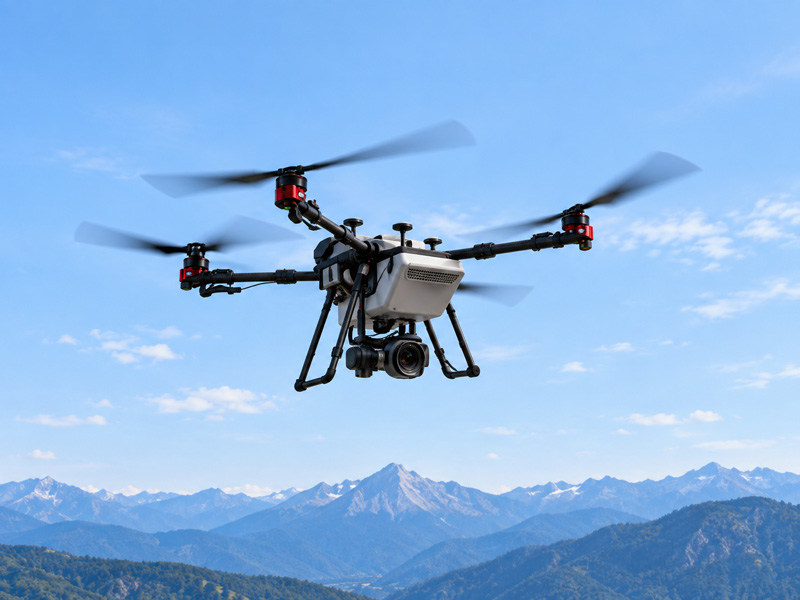


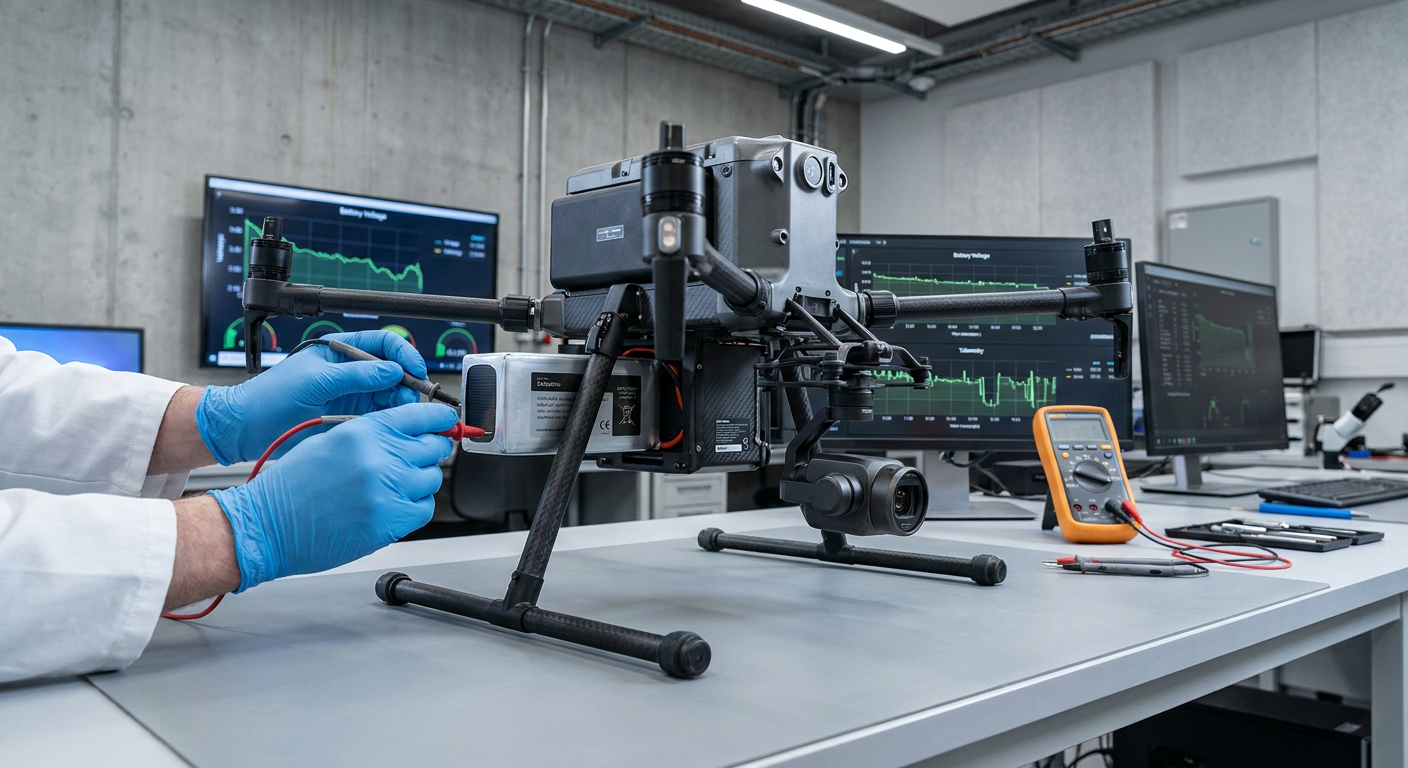
The prototype passed. The production aircraft did not.
The aircraft architecture, motor selection, and nominal battery specifications were identical. Both builds targeted the same payload and endurance window. Yet in field testing, production units consistently triggered low-voltage alerts and returned several minutes early.
The first place engineers usually look during root-cause analysis is the cell datasheet: nominal capacity, nominal voltage, continuous C-rate, and cycle life. When those numbers match the prototype specification, cell-level compliance can mistakenly lead teams to rule out the battery system altogether.
Not every production endurance drop originates in the battery pack. Propulsion efficiency, ESC switching losses, motor thermal accumulation, and flight controller limits all play a role. However, battery-pack-level variation is often one of the first areas to investigate when prototype and production power performance diverge.
A prototype proves that a design can achieve the target. Mass production must prove that every production unit can meet that target consistently.
That is why the real engineering challenge is not simply choosing a better cell. It is controlling variation across the cell group, battery pack, electrical path, thermal environment, mission load profile, and manufacturing process.
The Prototype Was Never the Production System
R&D prototypes naturally benefit from optimal conditions. Validation builds often use tightly matched cells, carefully routed power wiring, and minimal contact interfaces on open-air test stands with direct cooling and predictable test cycles.
Commercial mass production, however, introduces statistical variation across every element of the power system. Batch cell shipments, standardized cable harnesses, enclosed battery bays, and variable outdoor weather create cumulative differences.
Prototype optimization removes variation manually. Production engineering has to control variation systematically.
The prototype validates what the system can achieve. Production validation must establish what the system can repeatedly deliver. The question at production scale is therefore no longer “Can this battery achieve the target?” but “How consistently can the complete power system achieve it?“
A UAV Does Not Fly on a Battery Cell
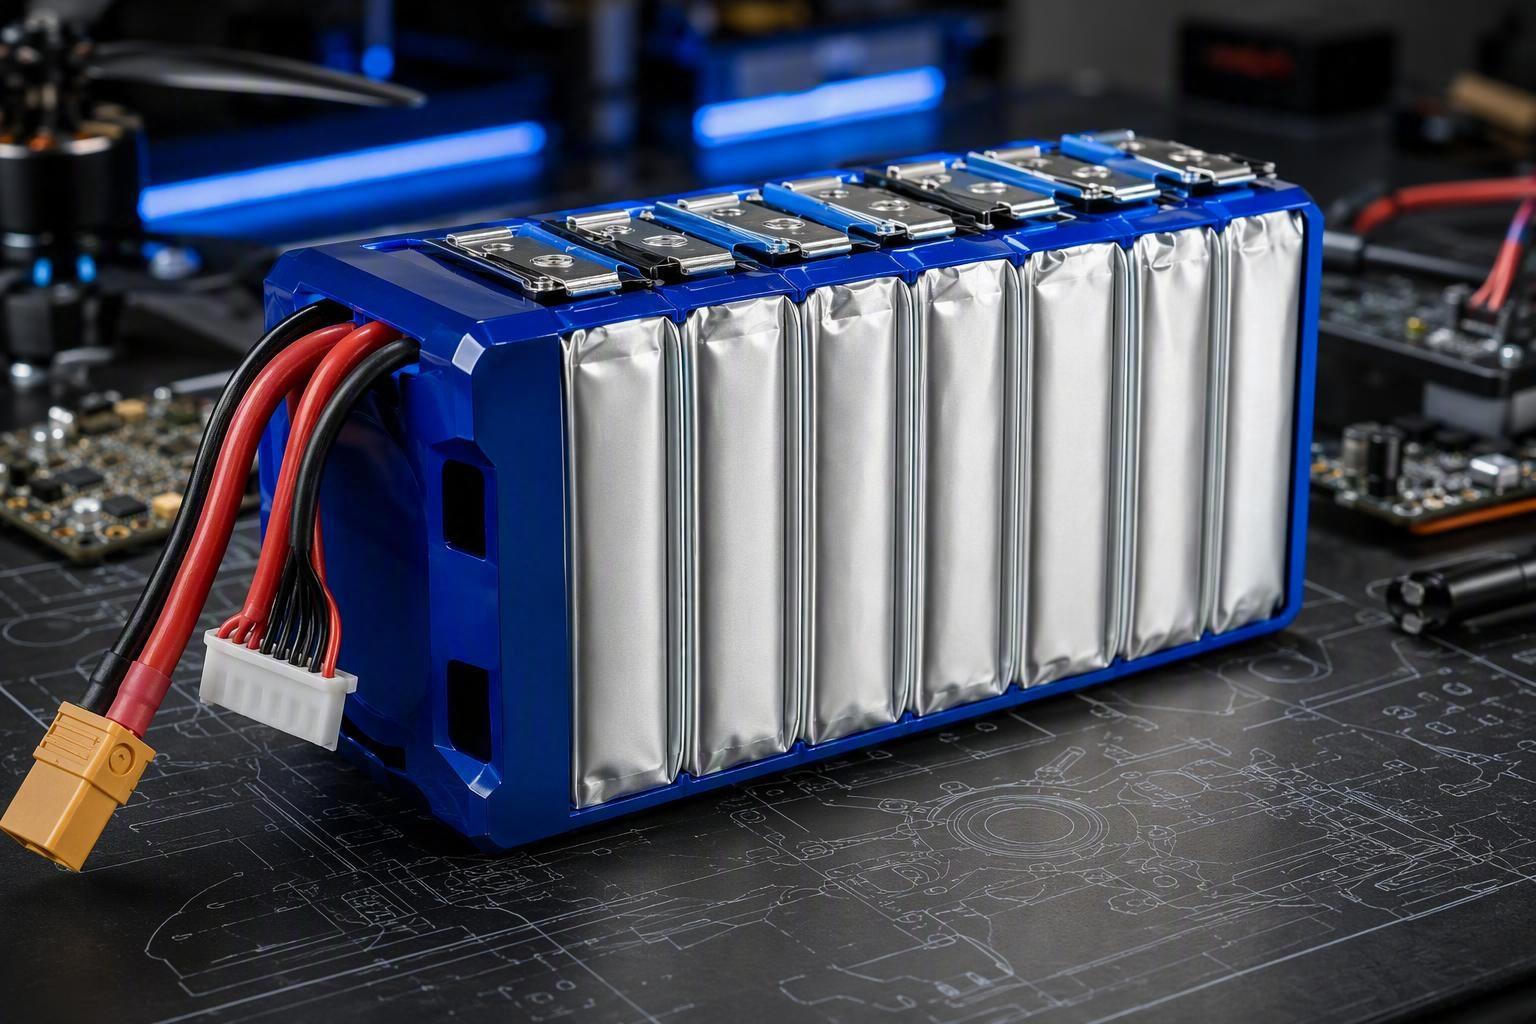
A commercial drone does not draw power directly from a single cell. Current flows through the entire battery pack and power path—from the cell tabs and welds to busbars, connectors, wiring harnesses, and finally the Electronic Speed Controller (ESC).
Cell → Welds → Busbars → Connectors → Harness → ESC
Every connection along this path adds some resistance. Under high current demand, those small resistances can add up and create a noticeable voltage drop at the battery terminals.
This is why a cell’s published internal resistance does not necessarily represent the actual resistance of the complete battery pack during flight. Cell datasheets are typically based on controlled test conditions and a defined measurement method. They describe the performance of the individual cell—not the voltage behavior of the entire production power path.
The higher the current demand, the greater the voltage drop caused by resistance.
In simple terms: Voltage drop = Current × Resistance
For a high-power commercial drone, even a relatively small increase in total pack resistance can therefore produce a significant voltage drop during acceleration, climbing, or other high-load conditions.
This matters because the aircraft does not respond to the battery’s remaining chemical energy alone. Its BMS, ESC, power-management system, or flight controller may respond to the voltage actually available under load.
As a result, a temporary voltage drop can trigger power derating or a low-voltage protection response—even when the cells still contain usable energy.
This is one reason why a production battery pack can behave differently from what the cell datasheet alone appears to predict.
Where Production Flight Time Actually Gets Lost
To prevent unexpected flight-time losses during commercial scaling, propulsion engineers must address four interconnected areas of system-level performance risk.
1. Cell-to-Cell Variation
Commercial UAV battery packs rely on multi-cell series-parallel configurations to reach target operating voltages. In practice, usable pack energy can be limited by the cell that reaches its voltage limit first, particularly under high-load conditions.
While prototype packs utilize tightly matched cells, mass-produced cell lots naturally exhibit statistical dispersion in capacity, DC internal resistance, and self-discharge rates.
Under high-current discharge, cells with higher internal resistance undergo steeper transient voltage drops under load. When the weakest cell hits the low-voltage cutoff threshold first, discharge terminates prematurely to protect that individual cell, leaving usable chemical energy in healthier adjacent cells stranded. The same mismatch creates a cumulative penalty during charging: a cell with slightly higher DC resistance or lower effective capacity reaches the upper voltage limit earlier, causing the BMS to terminate the charge cycle before the rest of the pack is fully replenished. Cell matching must therefore be evaluated as a dynamic, multi-parameter production system variable rather than a static incoming component specification.
2. Total Electrical Path Impedance and Conduction Losses
Conduction losses along the power path are another frequently overlooked reason why production drones can perform differently from prototypes.
A prototype may use short, direct connections between the battery and ESCs. A mass-produced drone, however, needs standardized cable routing, strain relief, vibration protection, and modular connectors to support reliable assembly and field operation.
These changes can increase the total electrical resistance of the power path. For example, longer cables generally add more resistance, while smaller conductor cross-sections can increase resistance further.
Connectors can also introduce additional variation. Contact resistance may change because of plating tolerances, insertion and removal cycles, mechanical wear, or vibration during operation. A small difference at each connection may not appear significant on its own, but several such differences can accumulate across the complete power path.
The effect becomes more noticeable when the aircraft is drawing high current. More current flowing through the same resistance means more electrical power is converted into heat instead of reaching the ESCs and motors.
In practical terms, the battery may still contain sufficient energy, but less of that energy is being delivered where the aircraft needs it most.
This is why production validation should look beyond the battery cells themselves and evaluate the complete battery-to-motor power path.
3. Dynamic Mission Load and Thermal Interaction
Laboratory battery validation often relies on controlled constant-current or simplified load profiles. Actual industrial UAV missions, however, involve highly dynamic power demand:
High-current takeoff and acceleration pulses
Hover power variations caused by wind gusts
High-frequency current pulses during aggressive maneuvers and payload deployment
Tapering current draw during controlled descent
Evaluating battery performance solely through a nominal continuous C-rating can overlook dynamic pulse capability. If the battery pack cannot sustain the required peak current, the propulsion system may derate output, while transient voltage sag can trigger low-voltage protection before the cells are actually depleted. Real-world commercial drones enclose battery packs inside protective bays exposed to ambient heat, solar radiation, and dynamic flight profiles.
Higher internal resistance increases electrical losses and localized heating. Sustained elevated temperatures can further accelerate degradation and resistance growth, creating a feedback loop that progressively reduces performance. Thermal validation must be performed in the actual aircraft environment under realistic mission current profiles, not only on an open-air battery bench. Thermal validation should also evaluate temperature gradients across the battery pack, because localized hot spots can accelerate cell-to-cell divergence over repeated missions.
4. Manufacturing Process Variation
Variations in cell manufacturing parameters can contribute to differences in capacity, DC resistance, and self-discharge behavior across production lots. In addition, the shift from manual prototype assembly to mass manufacturing introduces process tolerances across every assembly stage: material lot fluctuations, busbar welding tolerances, terminal assembly torque variations, and warehouse storage conditions.
R&D prototype optimization can easily hide underlying process variations. Mass production exposes them. In early development, custom assembly and controlled test conditions can mask small differences in cell matching, interconnect resistance, thermal behavior, and load response. Once production volume increases, those previously uncharacterized tolerances become measurable differences in fleet-level flight endurance. Without strict quality control and process traceability, manufacturing variation can produce batch-to-batch performance differences, where one delivery batch performs adequately while another experiences premature low-voltage cutoffs.
How OEMs Close the Prototype-to-Production Gap
To transition successfully from prototype validation to commercial production, industrial UAV OEMs should validate the power architecture against full system tolerances before locking in production lines:
Upgrade Cell Screening for Dynamic Consistency: Production cell matching should consider capacity, DC internal resistance at target state-of-charge levels, voltage behavior under load, and self-discharge stability—not capacity alone.
Standardize Low-Resistance Manufacturing Processes: Standardize welding, crimping, and fastening processes, and establish measurable limits for pack resistance and contact resistance across the complete conductive path.
Optimize Harness and Connector Systems: Size and route main power leads and select high-current quick-release connectors engineered to minimize conductor resistance and variable contact impedance.
Validate Thermal Behavior Under Real Mission Loads: Test the battery pack under the actual load duration, ambient temperature, enclosure conditions, and expected temperature distribution inside the aircraft.
Calibrate Protection Behavior to Actual Mission Current Profiles: Align BMS and flight-control protection thresholds with dynamic loaded-voltage behavior under actual mission current profiles rather than relying only on static open-circuit voltage curves.
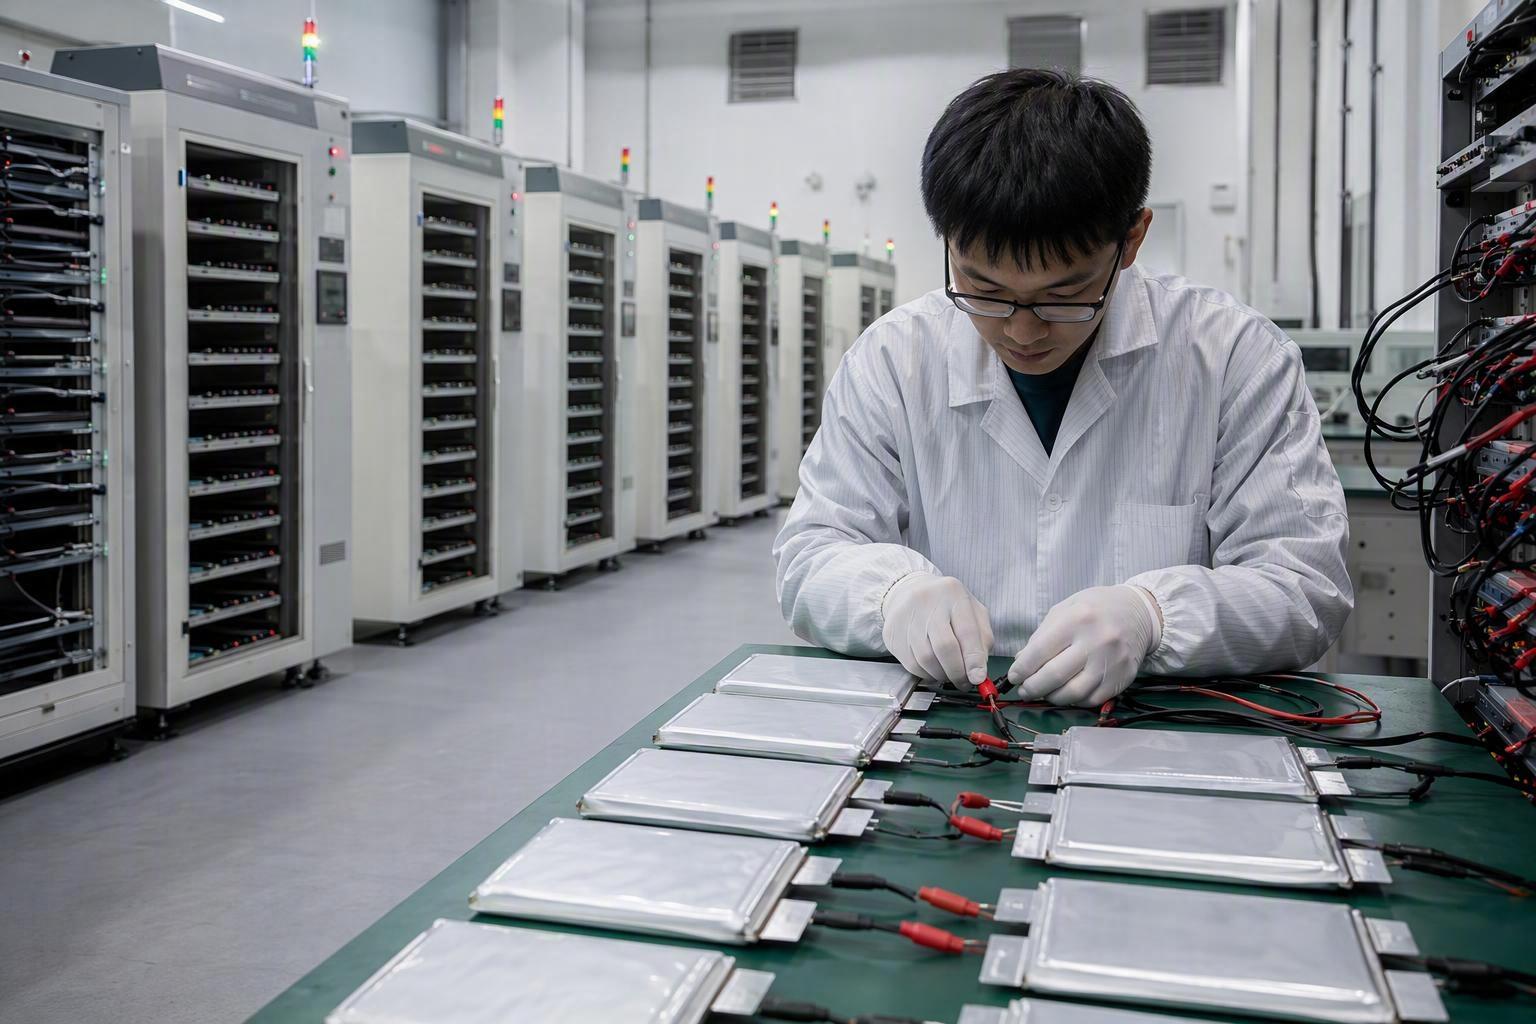
Establish Full-Batch Quality Traceability: Implement full-lifecycle batch traceability and End-of-Line (EOL) testing using high-current pulse loads to verify pack impedance, weld integrity, and BMS calibration before factory release.
Prototype vs. Production Validation Checklist
Engineering Area | Prototype Validation | Production Risk | Production-Matched Approach |
|---|---|---|---|
Cell Selection | Tightly selected cells | Statistical variation across lots | Multi-parameter dynamic matching |
Pack Resistance | Short, direct connections | Variable interconnect resistance | Characterized low-resistance path |
Voltage Sag | Controlled baseline | Higher transient voltage drop | Validation under dynamic loads |
Thermal Management | Open-air test conditions | Enclosed-bay heat accumulation | Integrated thermal pathways & telemetry |
Load Profile | Simplified/controlled loads | Dynamic mission-current mismatch | Validation against actual flight profiles |
BMS Thresholds | Bench-calibrated limits | Premature low-voltage response | Dynamic load-aware calibration |
Manufacturing Consistency | Individual build tuning | Lot-to-lot variation | EOL testing & digital traceability |
The goal of production optimization is therefore not to maximize a single cell parameter, but to make every major source of system loss measurable, controllable, and repeatable across production units.
Next Steps for Industrial UAV OEMs
Achieving repeatable, production-grade flight endurance requires moving away from single-cell component sourcing toward system-level power architecture engineering. As energy density and payload requirements expand across commercial inspection, agricultural spraying, and logistics platforms, battery systems must be designed, assembled, and validated around mission-specific load profiles.
For a broader view of how UAV battery systems are evolving toward higher energy density, smarter telemetry, and more integrated charging architectures, see our overview of future UAV battery and charger developments.
If your production aircraft is showing lower endurance than the validation prototype, the first step is not necessarily to change the cell. Compare the production pack against the prototype under the same mission load profile—including pack resistance, voltage sag, temperature rise, and BMS response.
Herewin can support UAV OEM engineering teams in comparing prototype and production packs across these parameters to identify where performance losses enter the production power system—whether through cell matching, electrical path resistance, thermal behavior, or manufacturing variation. Contact our engineering team to review your mission current profiles and power system requirements.

 日本語
日本語  English
  Español
  한국어
한국어  Deutsch
  Français
  Русский
  Bahasa Indonesia
  ไทย
ไทย  العربية
  Português do Brasil
  Italiano
  Nederlands