
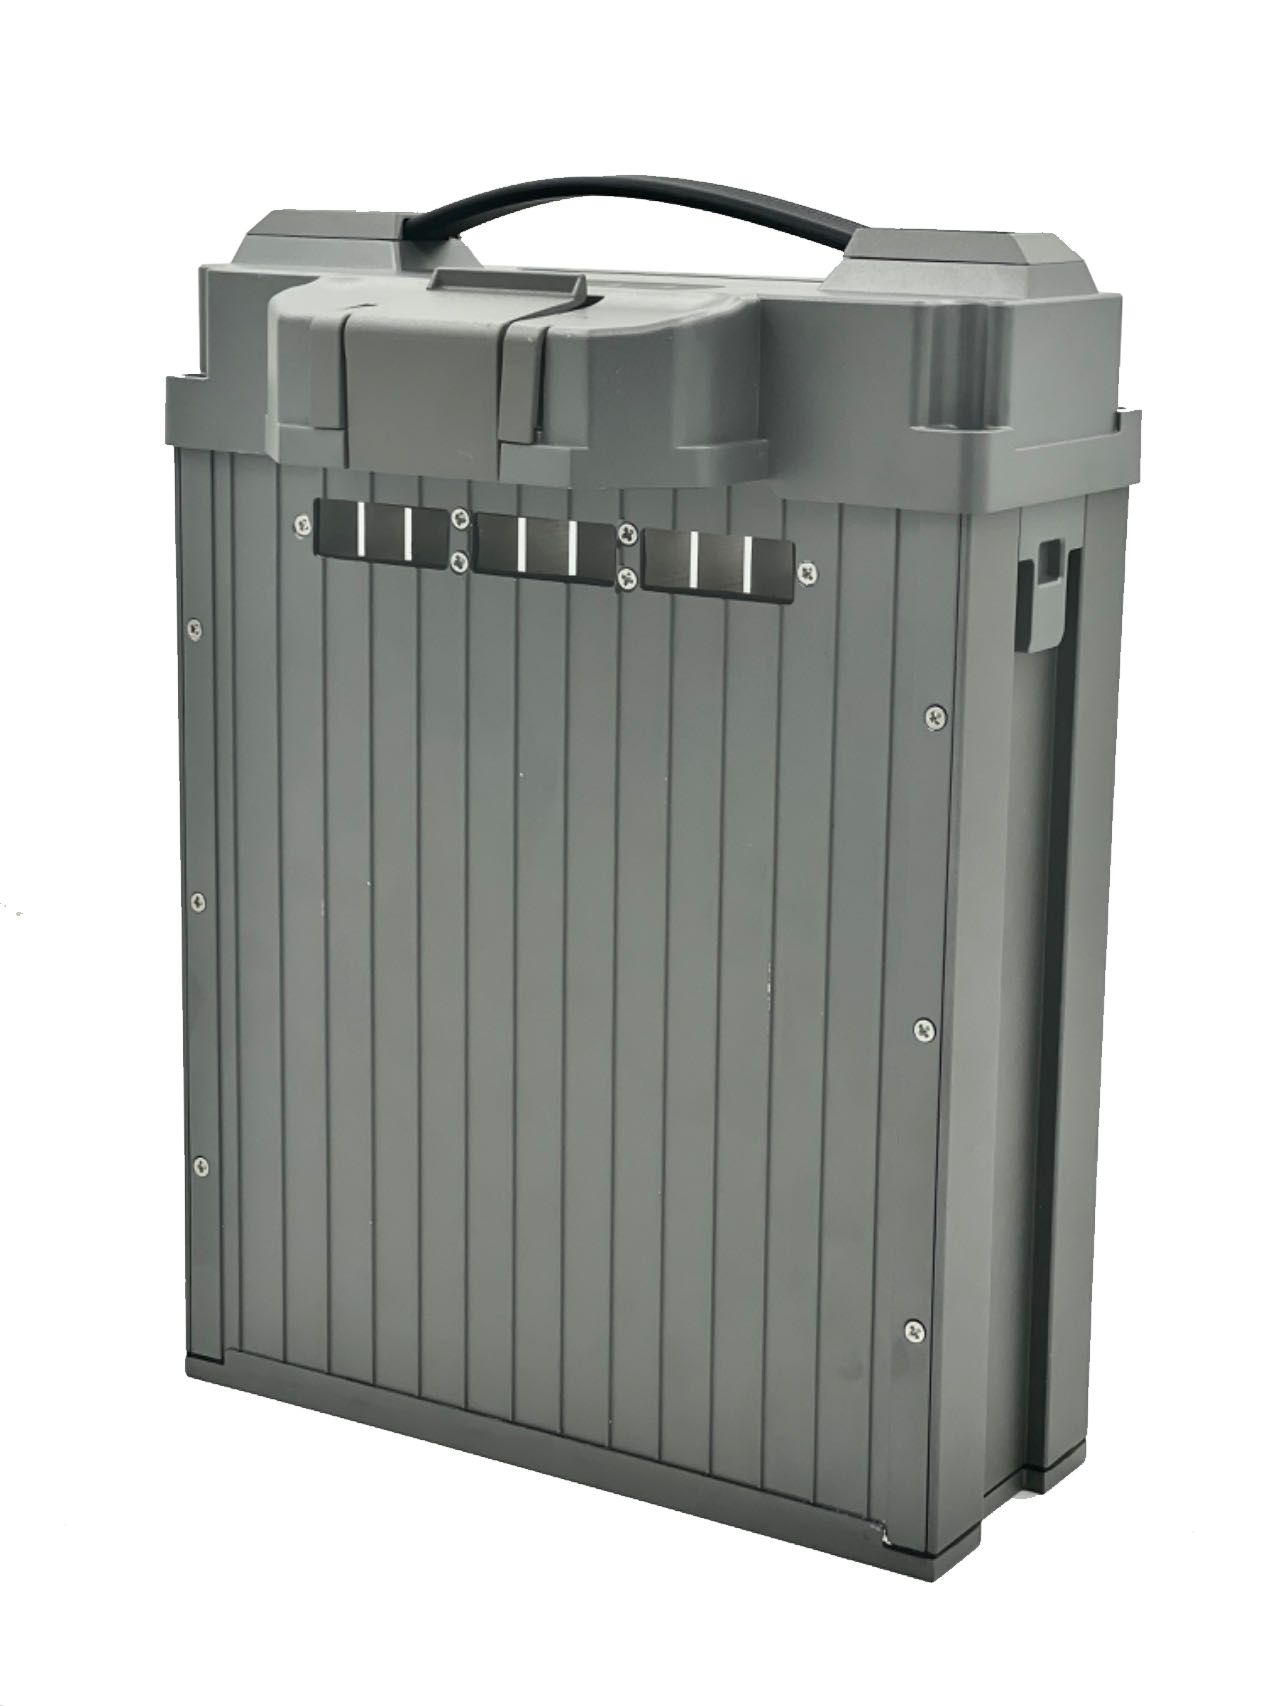
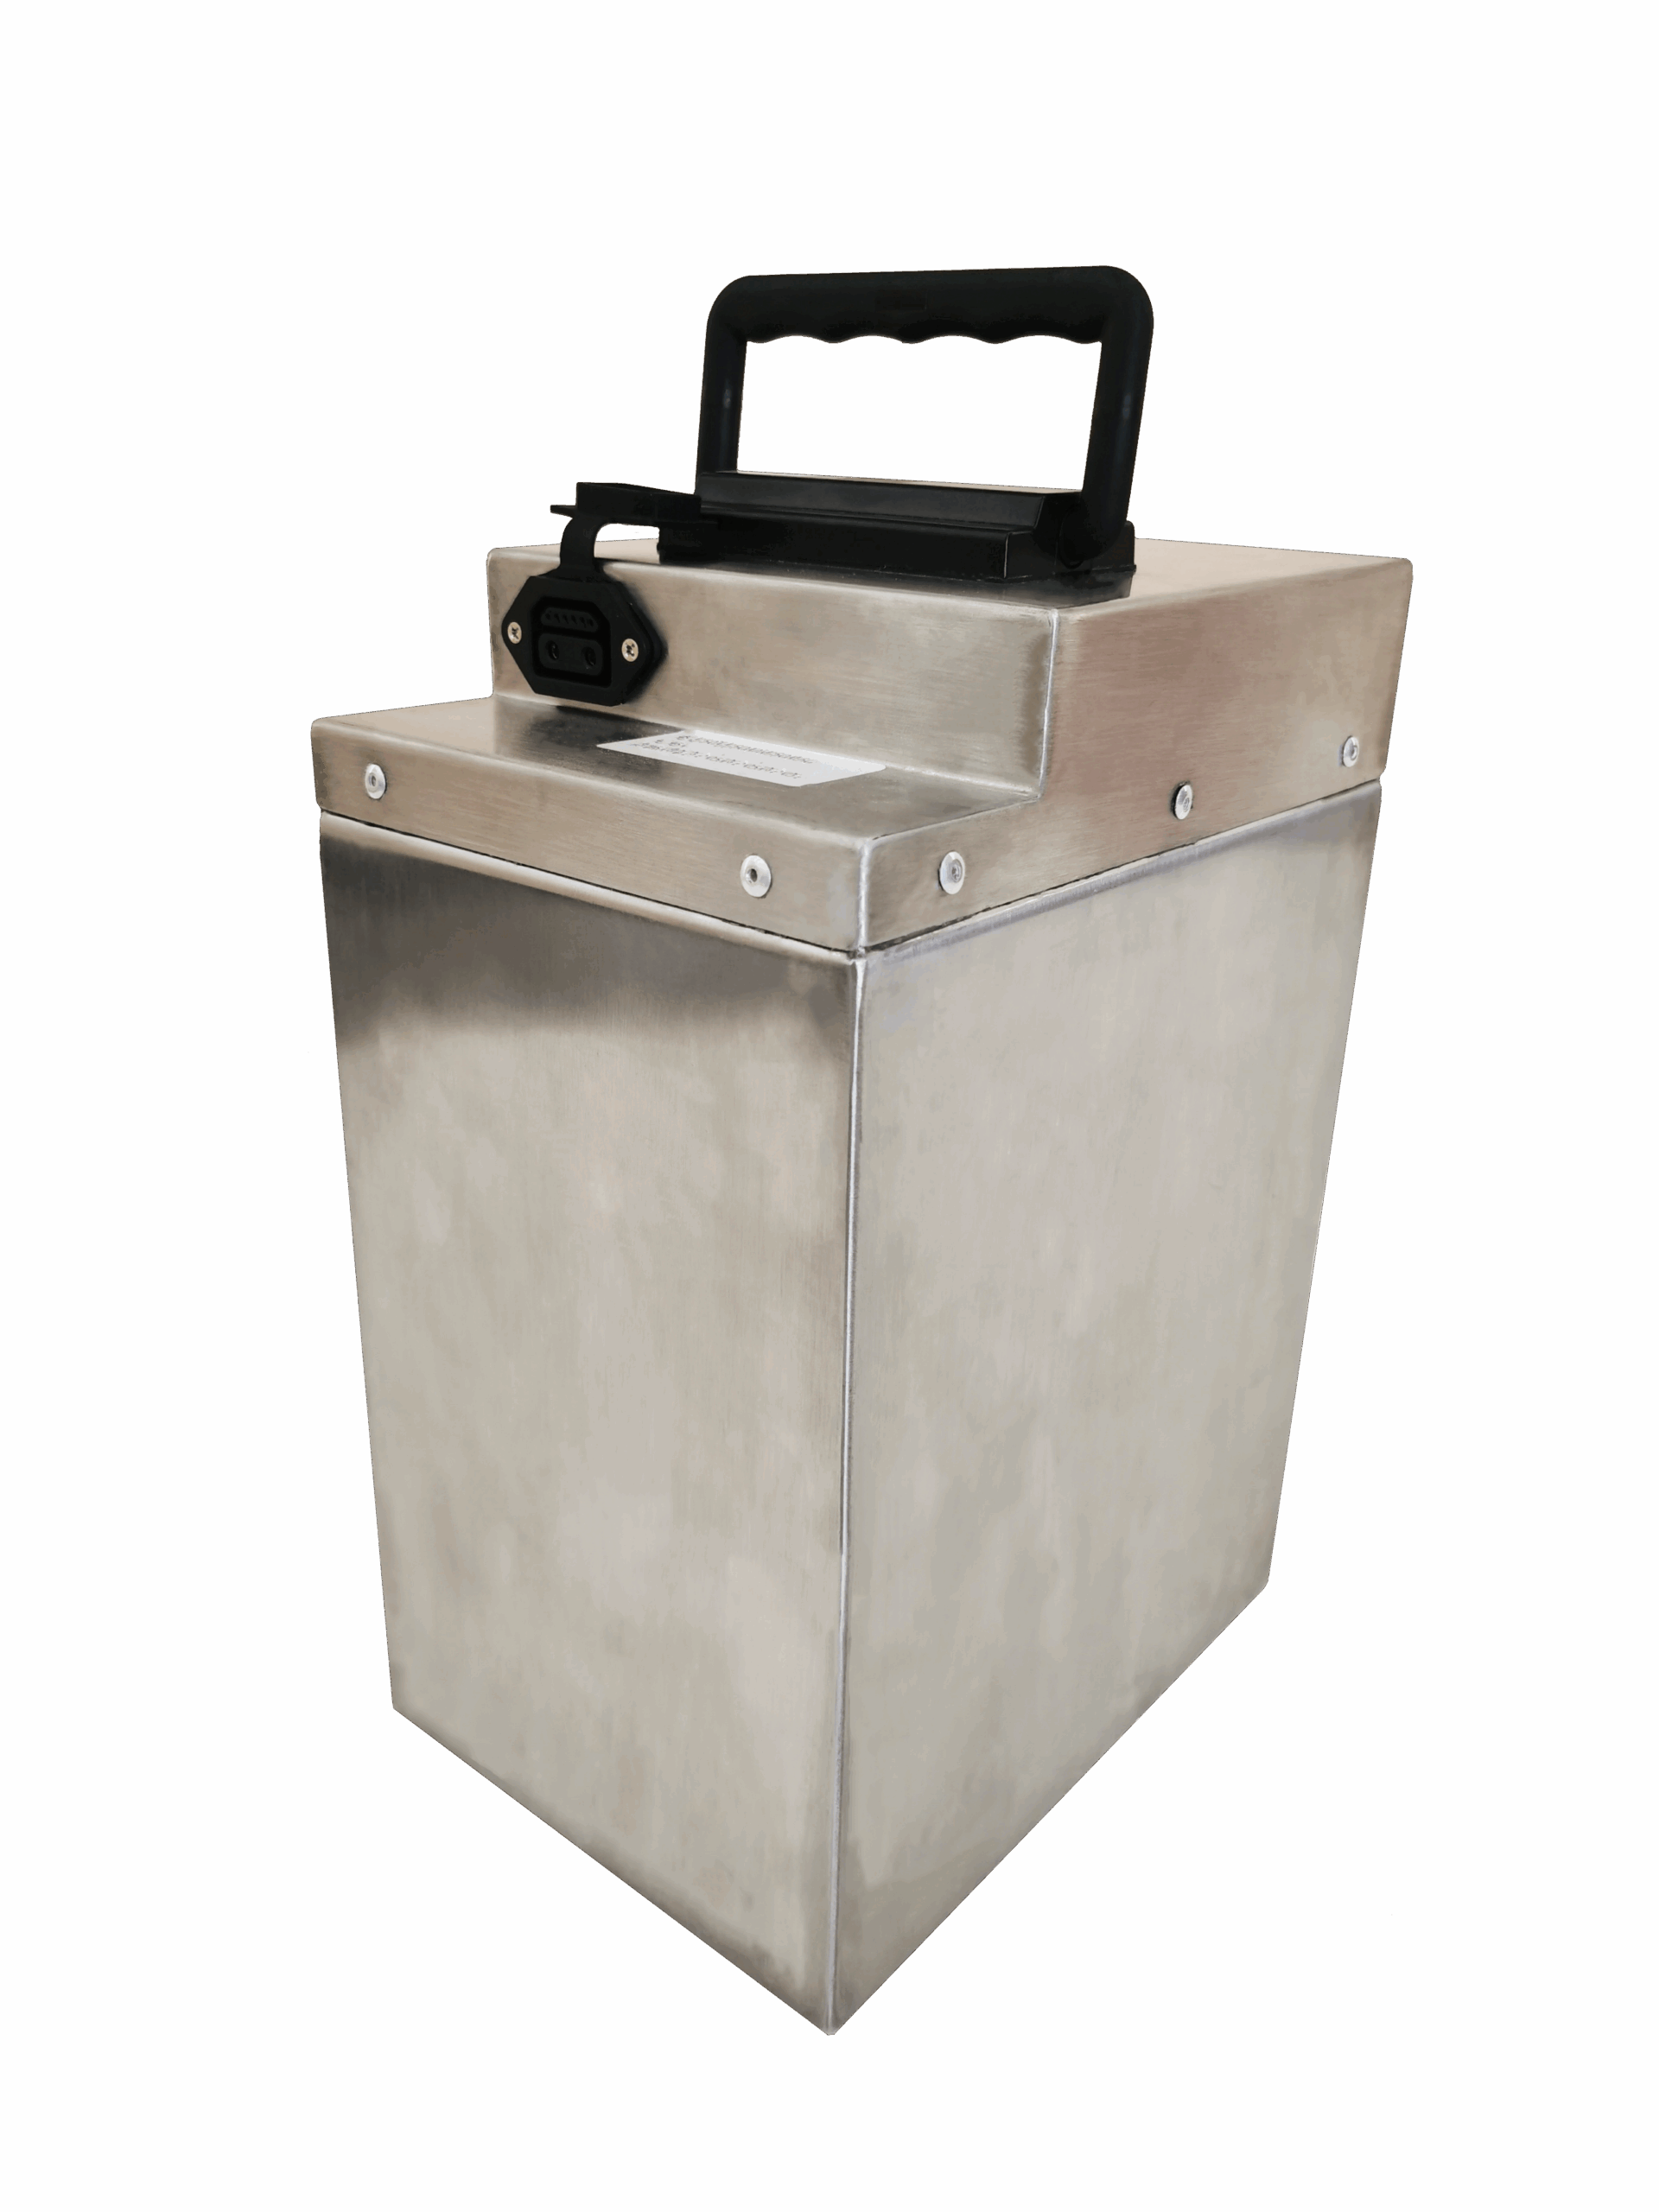







Two suppliers quote a battery for the same drone. Quote A reads 44.4 V, 20 Ah, 888 Wh. Quote B reads 22.2 V, 40 Ah, 888 Wh. The energy figure matches to the last digit, so it’s tempting to treat the two as interchangeable and pick on price.
Don’t. Your ESC and flight controller may take one and reject the other, and neither quote tells you how long the drone stays up. Voltage, capacity and energy describe the same pack from three angles, and each answers a different question — almost none of which the other two can cover.
Read them in order — voltage, then Ah, then Wh — and the two quotes stop looking interchangeable. Two more things fall outside those figures entirely: the current a pack can supply, and whether it physically fits your aircraft.
Battery Voltage, Capacity and Energy: What Each Figure Means
The three figures on a battery label are three different measurements, not three names for the same thing. Voltage describes the electrical level of the pack, and it’s the first compatibility check against the equipment the pack directly powers. Capacity, in amp-hours (Ah), measures electric charge, while energy, in watt-hours (Wh), combines the two — and it’s the only one of the three that lets you compare packs built at different voltages.
The handy pack-level expression is Wh ≈ nominal V × Ah. That single relationship is why two packs can carry identical energy yet still not fit the same aircraft.
Figure | What it describes | The question it answers |
|---|---|---|
電圧 (V) | The electrical level of the pack | Will it match the ESC and flight controller input range? |
Capacity (Ah) | Electric charge the pack holds | How much charge is available under stated test conditions? |
Energy (Wh) | Nominal energy, voltage × capacity | How do packs of different voltage compare on one scale? |
If the voltage doesn’t match the equipment’s specified range, stop there. A higher Ah or Wh figure cannot make an electrically incompatible pack work. A fourth question sits outside the three figures altogether: how much current the pack can deliver. It never appears in V, Ah or Wh, so the datasheet and specification sections come back to it.
Battery Voltage: What V Tells You
During a flight, the voltage at the ESC input changes as the pack discharges and the load changes, so it is never simply the nominal voltage printed on the label.
That printed number is the nominal voltage — a reference value close to the middle of the discharge curve, used to label and compare packs, and one a multimeter will rarely show you. Off the charger the pack sits higher at its fully charged voltage, and each burst of load pulls it lower still (voltage sag under load).
The pack’s window follows from the cell. A common 3.7 V nominal LiPo cell charges to 4.2 V, and its usable lower-voltage limit depends on the cell and the manufacturer’s discharge specification — often around 3.0 V per cell. Multiply by the series count and a 6S pack runs from about 18 V to 25.2 V under a 22.2 V label, while a 12S pack built on the same 3.7 V cell runs from about 36 V to 50.4 V under a 44.4 V label. Those figures apply to a 3.7 V nominal LiPo cell; other cell types use different nominal and charge voltages. The difference between the nominal label voltage and a meter reading is normal, since actual pack voltage changes with state of charge, load, temperature and cell characteristics.
A pack is a stack of cells, and the per-cell nominal voltage is what shifts the pack’s headline figure. The S count tells you how many cells are connected in series, while the pack’s nominal voltage depends on the nominal voltage of the cells used. So treat 44.4 V as the value for a 3.7 V cell, rather than as a fixed property of “12S.”
This is where the label can trip you up. A battery labelled 44.4 V may look compatible with a “48 V” system, but the label alone isn’t enough, because the equipment has to accept every voltage the pack visits, from full charge down to cutoff. So compare the pack’s maximum charged voltage with the equipment’s stated maximum input voltage, not one nominal label with another. A 12S pack sits at about 50.4 V off the charger, which means equipment rated only up to a 48 V input would be pushed past its rating by a pack sold as 44.4 V. Even when the electronics survive, a higher bus voltage changes how the propulsion system operates, so the motor, propeller, current and thermal limits still need checking. The low end matters too, because the pack’s low-voltage cutoff, along with any warning threshold the flight controller sets, decides how much of the charge you can use before the aircraft reacts. Check both ends of the range against the equipment datasheet, and confirm the charger matches the pack’s per-cell charge voltage, since a setting meant for a higher-voltage chemistry can overcharge a standard pack.
Datasheets also tend to name packs by cell count rather than voltage, which is why 6S and 12S turn up as often as 22.2 V and 44.4 V. The S stands for cells in series, but it fixes only the number of cells in that string — the actual nominal voltage depends on the cell type, and packs run 3.65 V, 3.7 V and 3.8 V nominal cells, with LiHV cells charging higher still. Read the S count alongside the stated nominal and maximum charge voltage, not instead of it.
Battery Capacity: What Ah Tells You
Amp-hours count charge, and that number is easy to read as a promise. Rated capacity is a declared value, measured under stated conditions: IEC 61960-3 tests it through a defined discharge at 20 °C, and regulatory definitions likewise describe it as the capacity measured under a stated load, temperature and voltage cutoff. If a supplier hands you an Ah figure with no test conditions attached, you still don’t know what that number means in practice — a 20 Ah rating does not mean the pack will deliver 20 A for exactly one hour in every application.
Real-world use rarely matches the test conditions exactly. At a high discharge rate the voltage sags toward the cutoff sooner, so less charge is delivered before the pack reaches its limit. In the cold, internal resistance rises and the same early cutoff follows — the low-temperature UAV battery guide covers why capacity drops in cold conditions. Over hundreds of cycles capacity fades, so the label describes the pack when new. Three factors matter most in practice:
High discharge rate — voltage sag reaches cutoff early
Cold conditions — higher internal resistance triggers an early low-voltage cutoff
Cycle count and aging — capacity fades with use
Usable capacity in a real mission is often lower than the rated capacity, which is why mission planning starts from usable capacity rather than the figure on the label.
Datasheets often quote mAh rather than Ah, and the conversion is a simple factor of 1,000: 22,000 mAh is 22 Ah, so convert the units before comparing two quotes that use different ones.
There’s a second way capacity misleads, and the two quotes show it clearly. Quote B carries twice the Ah of Quote A, which can make it look like the bigger battery, but charge only becomes energy once voltage is factored in, and B has half the voltage, so the two actually store the same amount. Ah is most useful for comparing packs with the same nominal voltage and comparable test conditions.
Nor does Ah tell you how long a drone will fly, since that depends on the power the aircraft draws — which moves with payload, flight mode, wind and altitude — and on how much of the capacity you can actually use. Two aircraft on the same pack can return very different flight times, because estimated flight time comes down to usable energy divided by average power, so the same pack can post very different numbers in two different airframes.
What if you simply choose a higher-Ah pack at the same voltage? Electrically, that is usually the easier part, since the voltage range stays the same, but the harder questions sit elsewhere. Does the pack fit the bay and the mount, and what does the extra weight do to the aircraft? Can the charger handle a larger pack, and do the connector and current rating still suit the load? More Ah buys longer endurance only if the aircraft can carry what comes with it.
Battery Energy: What Wh Tells You
Watt-hours settle the comparison that amp-hours could not. Multiply nominal voltage by rated capacity:
Nominal Energy (Wh) ≈ Nominal Voltage (V) × Capacity (Ah)
For the two quotes, that gives 44.4 V × 20 Ah = 888 Wh and 22.2 V × 40 Ah = 888 Wh. Both packs are hypothetical, and the figures are illustrative only, not the specification of any real product. Larger systems sometimes quote the same figure in kilowatt-hours, where 888 Wh is 0.888 kWh.
Its usefulness as an engineering figure stops at the word “nominal”, though. Wh is the pack’s nominal rated energy, calculated from nominal voltage and rated capacity, and a mission can usually draw less. Usable energy sits below nominal Wh, because the system normally does not use the full rated voltage window, and resistive losses in the pack and wiring take their share.
Here’s the purchase mistake worth naming: Wh is a better starting point for energy comparison than Ah, but it is still not a direct flight-time rating. Endurance depends on the aircraft’s power draw, which is why two packs with the same 888 Wh can return very different flight times in two different airframes. As a rough guide, estimated flight time ≈ usable energy ÷ average power.
Wh also hides a difference that matters just as much: current. For the same power, a lower-voltage pack has to supply more current, so at a peak of 1,500 W, Quote A supplies roughly 34 A and Quote B roughly 68 A, before losses. That higher current can require larger conductors, higher-rated connectors and more attention to resistive heating, which means the two quotes are not drop-in alternatives even if the aircraft’s electronics could accept either. V, Ah and Wh on their own never tell you how much current a pack can deliver — the load profile does.
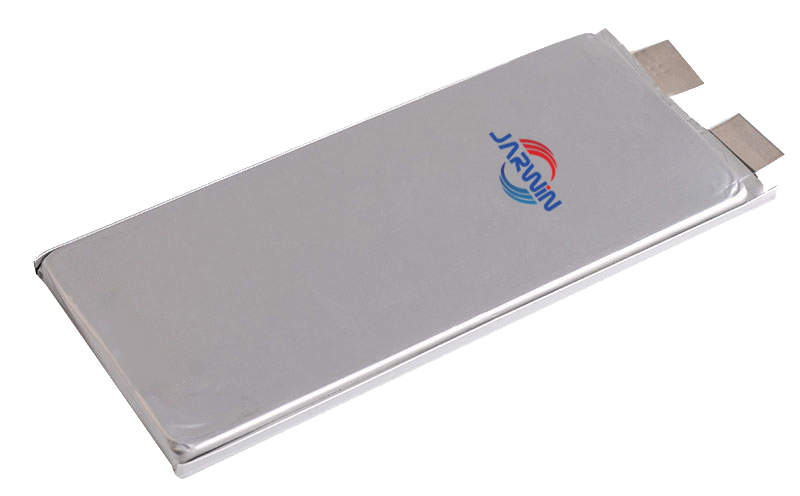
The same relationship also explains why the two quotes can share a Wh figure while showing different voltage and capacity. For identical cells, series connections add voltage, parallel connections add Ah, and energy follows the total cell count. Using the same hypothetical 3.7 V, 5 Ah cell (18.5 Wh) as a simplified example, either quote could be built from 48 cells:
Configuration | Pack nominal voltage | Pack capacity | Number of cells | Nominal energy |
|---|---|---|---|---|
12S4P (Quote A) | 44.4 V | 20 Ah | 48 | 888 Wh |
6S8P (Quote B) | 22.2 V | 40 Ah | 48 | 888 Wh |
Rearranging the same cells changes voltage and capacity but not energy — which is why Wh makes a sound first comparison between candidate packs. What the rearrangement does change is current. Real packs also depend on cell characteristics and system constraints, so treat the table as a way to read a label, not as a design method.
How to Read V, Ah and Wh on a Datasheet
Put the three figures on one line and the reading order becomes clear. Here is a hypothetical datasheet line: 12S1P, 44.4 V nominal, 22 Ah, 976.8 Wh, charge voltage 50.4 V, discharge cutoff 36 V. The values are illustrative. The line actually mixes five kinds of information — a configuration (12S1P), a reference value (the nominal voltage), a rated value measured under test conditions (the capacity), a figure derived from those two (the Wh), and two boundary values (the charge voltage and the discharge cutoff). Those last two define the important upper and lower boundaries for charging and discharge, and both should be read alongside the manufacturer’s specification rather than treated as a simple operating range.
Voltage comes first, so set the 50.4 V and the 36 V against the ESC and flight controller ranges rather than the 44.4 V in the headline. If the equipment’s specified operating range does not cover the pack’s required voltage window, the pack is ruled out before capacity even enters the discussion.
Next, check that the figures agree with each other. Here 44.4 V × 22 Ah = 976.8 Wh, so the line is consistent; when a quoted Wh doesn’t equal nominal voltage times Ah, the energy was worked out with a different voltage or a different rating, and it’s worth asking which. It also pays to check which capacity the line states, since some datasheets give a typical value and others a minimum, and the difference carries straight into Wh.
The rest of the line is what it leaves out: the current the pack can deliver (continuous and peak, usually expressed as a C-rating, which this C-rating guide explains), its weight and dimensions, the connector, the charger it needs, and the conditions behind the Ah rating. Those gaps are the ones you need to close before a quote means anything.
What to Give a Battery Supplier
So what do you actually send a supplier? V, Ah and Wh start the conversation, but a supplier will usually need more than those three figures to assess a pack properly:
The voltage range your equipment accepts, including its low-voltage cutoff behaviour. Take it from the ESC and flight controller datasheets rather than the nominal figure, since the pack will visit the whole range.
Your energy and mission target. If the real goal is mission time, give the expected power draw or workload instead of minutes alone, so the pack can be sized on usable energy, and say how much runtime you can accept at the end of the pack’s life.
The current and power profile. Continuous, peak and pulse current or power, and how long each lasts. V, Ah and Wh say nothing about how much current a pack can deliver, which is why a pack that matches on paper can still fall short in the air.
Weight and dimensions, including mounting method and available space. A higher-energy pack is no help if it does not fit the bay or eats the payload allowance.
Charging requirements: the charge source, the charge time you want, and whether the pack is used while charging.
Environment and connections: operating, charging and storage temperature ranges, plus connector, wire and any communication or temperature-sensing requirements.
A supplier can’t quote a pack from a cell datasheet alone. The pack adds a BMS, wiring, connectors, an enclosure and mounting, which take up weight and volume the cells don’t, so pack-level energy is always lower than cell-level energy.
State units explicitly (V, Ah or mAh, Wh) so nothing is lost between teams and suppliers. A request that says only “44.4 V, 20 Ah battery for a drone” leaves every item above as a question the supplier must come back and ask. Compare that with a first request such as:
12S, 44.4 V nominal; equipment accepts 36–51 V per the ESC datasheet; about 900 Wh for a 60-minute mission; average load 600 W, peak 1,500 W.
The values are illustrative, and a request does not have to be complete to be useful. Items such as certification needs, prototype quantity and launch schedule matter once a project moves past first assessment.
That closes the reading order: voltage first, then capacity, then energy, then the pack details V, Ah and Wh leave out. Run it over the two 888 Wh quotes and they resolve — same energy, different aircraft. Voltage decides which airframe, Ah gives the charge available at its stated test conditions, and Wh makes them comparable in energy terms only. None of the three covers current capability, weight, size, connector type or real flight time; those come from the rest of the datasheet and the mission profile.
For a pack project, Herewin develops and manufactures both cells and packs, so cell selection and pack design can be evaluated together rather than treating the cell datasheet as the finished-pack specification. If you are evaluating drone batteries or planning a custom pack, send the voltage range, energy target and load profile you already have, and Herewin can start from there.







 日本語
 English
 Español
 한국어
 Deutsch
 Français
 Русский
 Bahasa Indonesia
 ไทย
 العربية
 Português do Brasil
 Italiano
 Nederlands