


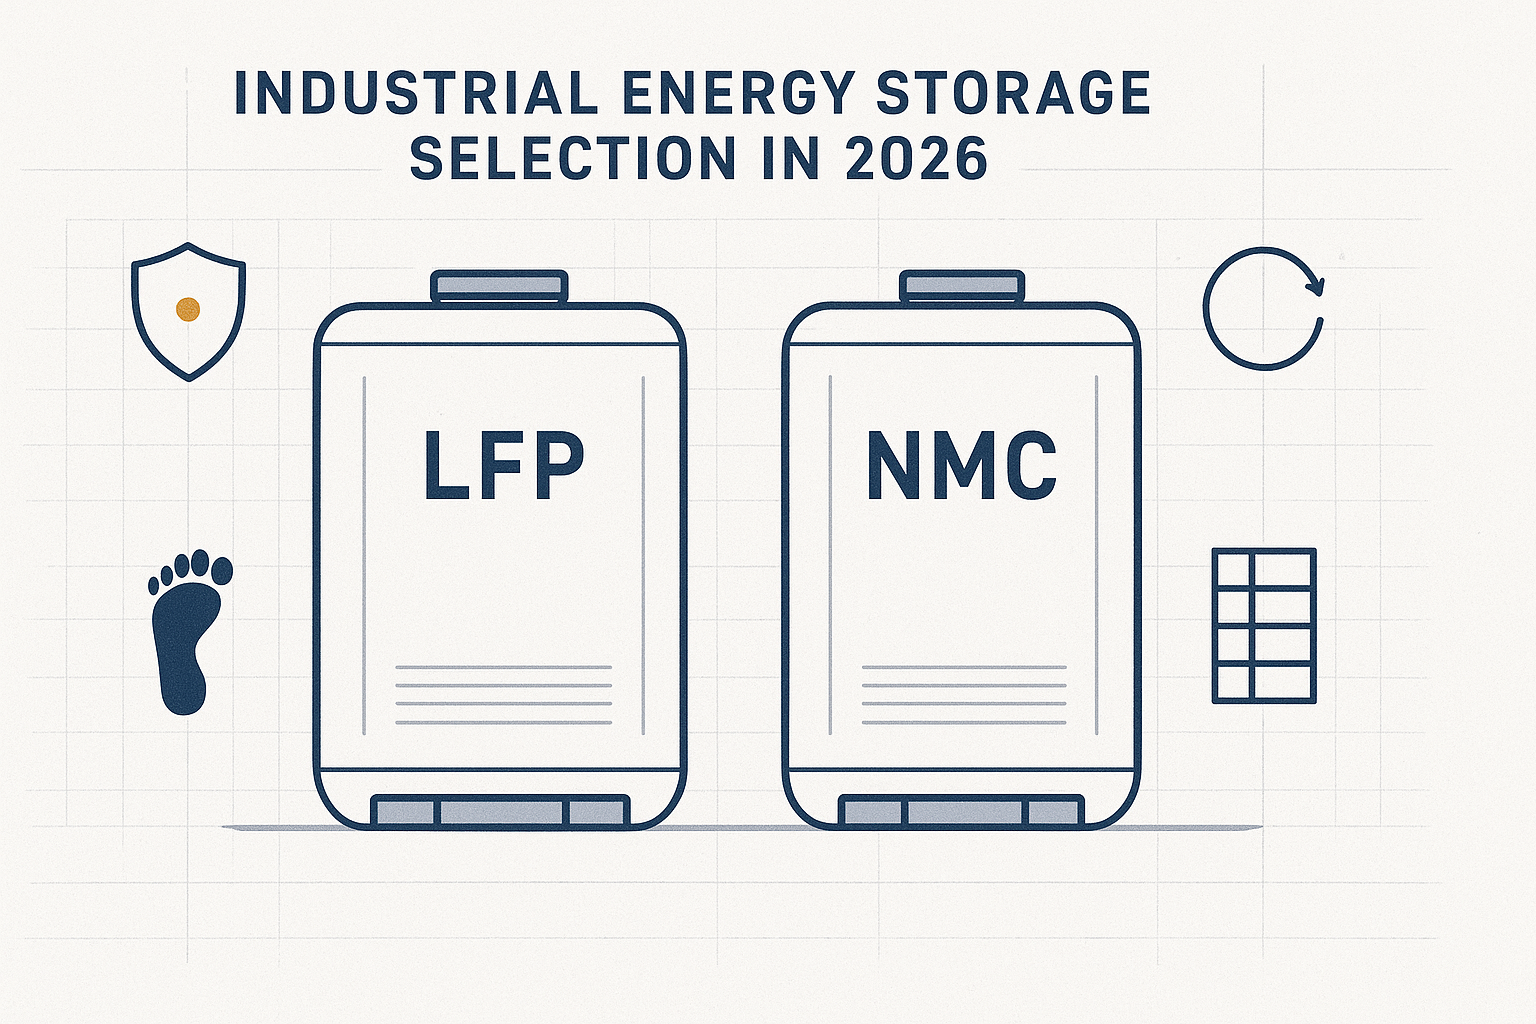
Industrial energy storage in 2026 is rarely a “battery spec” decision. In most procurement and engineering committees, it shows up as a bundled question:
What chemistry best matches the duty cycle we actually run?
What failure modes do we need to price into the project (safety, compliance, downtime, replacement)?
What can be defended in a bankability/insurability conversation over 10+ years?
This article compares lithium iron phosphate (LFP, LiFePO₄) and nickel manganese cobalt (NMC/NCM) from a decision-maker’s perspective: what tends to differ at cell level, what that difference looks like at system level, and how those differences often surface in total cost of ownership (TCO).
Scope note: numeric performance ranges in lithium-ion are highly conditional (cell design, C-rate, depth of discharge, temperature window, calendar aging, BMS limits, and test protocol). Where a number is presented, treat it as an orientation range—not a guarantee.
LFP vs NMC energy storage: quick comparison matrix and decision baseline
Evaluation criterion (what gets priced or constrained) | LFP (LiFePO₄) — common signals | NMC/NCM — common signals | What to verify in your RFP / due diligence |
|---|---|---|---|
Energy density / footprint | Lower cell energy density is commonly observed; footprint and container count may increase for the same MWh | Higher cell energy density is commonly observed; packaging efficiency can improve | System-level Wh/L and Wh/kg (not cell-only), HVAC/aux loads, layout limits |
Cycle life / replacement planning | Long cycle life claims are common; calendar aging still matters | Cycle life can be competitive in some designs; depends strongly on operating window | Warranty throughput (MWh), EOL definition, test conditions, degradation curve |
Safety risk & propagation | Often positioned as more thermally stable; still requires system-level fire design | Often requires tighter monitoring and mitigation in high-energy designs | Evidence pack: UL 9540 listing + UL 9540A reports, separation distances, gas management |
Supply chain exposure | Cathode materials typically rely on widely available inputs (iron/phosphate) | Nickel/cobalt exposure tends to add commodity volatility and sourcing complexity | Price index exposure, contract adjustment clauses, origin constraints |
Bankability (warranty + O&M) | “Predictability” is often framed around conservative operating windows and long-term degradation | “Performance density” can be framed around footprint constraints and power density | O&M plan, spares strategy, response time SLAs, reference installations |
Footprint vs. density: the system-level reality
The most repeated difference between LFP and NMC is energy density: NMC cells are often designed to deliver higher gravimetric and volumetric energy density than LFP.
For industrial storage, the decision tends to translate into system footprint and integration constraints, not cell chemistry pride:
If site area and civil works are constrained (urban substations, brownfield plants, retrofits), higher system energy density can reduce container count, cabling complexity, and some balance-of-plant costs.
If site area is available (industrial parks, greenfield microgrids), the footprint penalty of LFP can be tolerable relative to its risk and lifetime signals.
A useful procurement framing is to force system-level comparability:
same usable energy (MWh)
same C-rate / power requirement (MW)
same ambient temperature envelope
same target availability and maintenance concept
This avoids a common failure mode: comparing cell-level Wh/kg while ignoring system factors (module packaging, racks, cooling, fire design, auxiliary power, and control overhead).
Lifecycle economics: beyond the datasheet
Cycle life is often presented as a chemistry property. In practice, operational guardrails (SoC window, temperature limits, C-rate caps) do as much to define longevity as the chemistry itself.
Battery life affects your TCO in four primary ways. While most models focus on usage cycles, a crucial—and often underpriced—driver is “shelf life” (calendar aging): capacity loss that accrues over time, even when the system is largely idle. In real projects, this shows up when assets sit in standby, partial cycling, or “ready” mode for long stretches. Temperature exposure and SoC dwell time can become as important as cycle count.
To make these “four ways” actionable, a TCO model must account for:
Replacement timing: When does usable capacity fall below what the revenue model requires?
Warranty economics: What is covered, and under what specific operating boundaries?
Operating derates: What margins are baked into EMS/BMS controls to keep degradation within guardrails?
Augmentation strategy: When (if ever) does the financial model assume module additions to maintain contracted usable energy?
For procurement teams, the payoff is simple: instead of arguing about headline cycles, you get a clearer view of cash-flow timing—knowing exactly when additional capacity spend is likely to hit under your actual dispatch profile.
Two practical levers for procurement committees:
Throughput warranty beats “cycle count”: A warranty expressed as total MWh delivered to EOL can be mapped into LCOS more cleanly than “4,000 cycles at X% DoD.”
EOL definition is a financial variable: Moving from an “80% remaining capacity” to a “70%” definition produces materially different replacement economics and must be harmonized across all bids.
Where LFP and NMC often diverge
Without implying a universal rule, the following patterns are frequently used in industrial storage evaluation:
LFP is commonly positioned for long service life in stationary duty cycles, especially when operated in conservative SoC windows and temperatures.
NMC is commonly positioned where energy density or power density is a dominant constraint, with degradation management placed more heavily on controls and thermal design.
This framing becomes concrete when you translate it into procurement questions:
What are the vendor’s reference conditions for the degradation curve (temperature, DoD, C-rate)?
Is the warranty tied to a specific operating SoC window?
What is the allowed time at high SoC (calendar-aging driver) under the warranty?
In a financing or ROI discussion, the chemistry debate tends to collapse into “how predictable is capacity over time under our actual duty cycle,” not “which datasheet has more cycles.”
Safety and compliance: how UL 9540A de-risks schedule
Industrial energy storage risk is usually governed less by “is the chemistry safe” and more by “what happens when something fails.” For lithium-ion systems, that often leads to thermal runaway propagation questions.
Two references are useful as a neutral baseline:
The U.S. Environmental Protection Agency’s discussion of safe installation notes UL 9540/9540A among the relevant standards and highlights that lithium battery fires can be difficult to extinguish and may re-ignite, which is one reason incident response planning and site design get scrutinized early in projects (see the EPA guidance on safe battery energy storage installation (2025)).
UL describes UL 9540A as a test method for evaluating thermal runaway fire propagation behavior in battery energy storage systems and how results can inform installation guidance and separation distances (see UL’s overview of UL 9540A thermal runaway fire propagation testing).
How chemistry differences typically enter the conversation
In practice, LFP and NMC are often discussed as having different thermal stability characteristics and different heat/gas release behaviors under abuse.From a risk-management perspective, it is useful to treat chemistry as one layer in a stack:
cell chemistry and design
cell manufacturing quality and consistency
module design and venting
pack/container architecture
BMS/EMS detection and controls
thermal management
siting, separation, and fire protection design
Chemistry can shift the risk baseline, but projects are often approved or rejected based on the evidence package (reports, listings, and design documentation) rather than chemistry labels.
Permitting and insurance: where UL 9540A evidence de-risks schedule
For many overseas projects, the practical question isn’t whether a chemistry is “safe,” but whether the documentation supports faster approvals and predictable operating constraints.
In tighter sites (dense urban parcels, indoor/adjacent-to-critical-infrastructure deployments), thermal-runaway propagation behavior can translate into:
siting and separation constraints that reduce usable layout options
added mitigation scope (gas detection/venting, suppression, blast/pressure relief) that changes design and O&M
approval and commissioning timeline risk, because AHJs, fire engineers, and insurers may ask for additional evidence or design iterations
Instead of debating threshold temperatures, treat UL 9540A outputs as an input into an auditable workflow:
Which installation scenario does the test evidence actually cover (cell/module/unit level, enclosure type, ventilation assumptions)?
What separation distances and ventilation requirements are derived from the test results for your specific layout?
What conditions/limits are required to keep the system within the tested risk envelope (SoC limits, temperature bounds, detection thresholds)?
This is often where “chemistry” decisions show up as bankability signals: the stronger and more relevant the evidence package, the fewer surprises you tend to get late in permitting and insurance review.
UL 9540 listing status (system-level) and the scope it covers
UL 9540A reports at relevant levels (cell/module/unit) and how they map to your installation scenario
gas management assumptions (venting strategy, detection, enclosure pressure relief)
separation distance guidance aligned with local code authority
This moves the discussion from “threshold temperatures” (which are easy to misquote) to test methods and documented behavior.
Supply chain: volatility VS stability
The TCO of industrial storage is sensitive to battery pricing cycles, but not all pricing cycles are driven by the same inputs.
NMC/NCM: commodity exposure as a governance problem
NMC cathodes typically require nickel and (depending on formulation) cobalt. Those inputs are often treated as strategic commodities with:
higher price volatility
more complex sourcing constraints
more compliance scrutiny (origin, ESG, and trade restrictions)
For industrial buyers, the practical implication is not “NMC is expensive” but rather:
pricing clauses tend to be more index-linked
delivery schedules may carry more commodity-driven uncertainty
risk committees may request deeper vendor transparency
LFP: broader materials availability as a planning signal
LFP’s cathode inputs are typically framed as more widely available. This can show up as:
more predictable long-term pricing assumptions
lower concern about single-point commodity shocks
The procurement action is straightforward: require the supplier to disclose what portion of pricing is commodity-indexed and how that index risk is shared over the contract life.
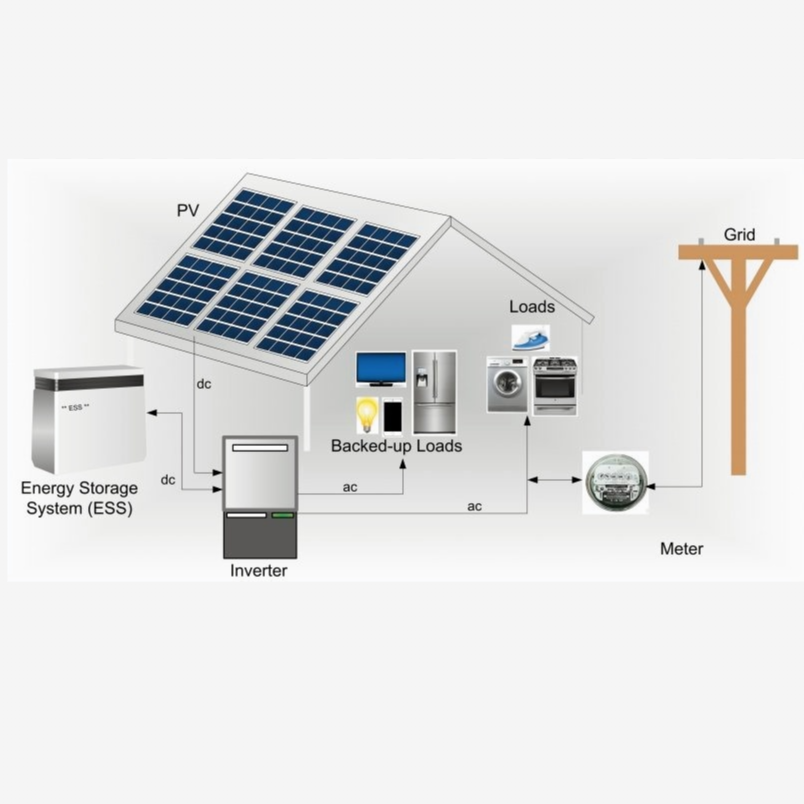
The TCO model: from CAPEX to ROI
Industrial storage TCO varies by business model (behind-the-meter peak shaving vs grid services), but the cost structure often fits a common template.
A TCO structure that stays auditable
Define TCO over a horizon (e.g., 10 years) as:
CAPEX: battery system + PCS + EMS + civil works + commissioning
OPEX: scheduled maintenance + monitoring + energy for auxiliaries (HVAC/pumps) + compliance inspections
Risk cost (expected value): probability-weighted downtime, incident response, insurance premium impacts, and permitting delays
Replacement / augmentation: planned module swaps or capacity augmentation to maintain contracted output
Residual value / disposal: end-of-life logistics, recycling contracts, and any salvage value assumptions
Residual value is easy to ignore until a finance team asks for it. In practice, end-of-life value is a function of the exit pathway:
Second-life use (where permitted): modules can be repurposed for lower-demand applications if testing, re-certification, and logistics pencil out.
Recycling value: economics depend on collection and processing contracts, plus what portion of value is recovered through materials (and how that value is shared).
Because the viable pathway can differ by region, regulation, and system design, it’s best to treat residual value as a scenario assumption and document it explicitly in the TCO model (including who owns the recycling/return obligations and what fees apply).
For chemistry comparison, the goal is to identify which terms are most sensitive to chemistry-driven design differences:
energy density often shifts civil works and footprint
degradation patterns shift replacement/augmentation
safety evidence and mitigation needs can shift risk cost (insurance/permitting) and OPEX (monitoring, fire systems)
A simple LCOS lens (when you don’t want false precision)
If you need one “headline” metric, LCOS can be used as a controlled simplification:
Choose the same delivered energy target (MWh over life)
Apply conservative assumptions on auxiliary loads and availability
Require that both options use the same EOL definition
This avoids over-fitting a spreadsheet to uncertain degradation and price forecasts.
2026 selection guide: scenario mapping
This section compresses the comparison into scenarios where decision variables differ materially.
Data centers and critical backup power
Observed constraints:
safety governance is often strict
downtime cost can dominate energy cost
project acceptance may depend on fire authority comfort and documented test evidence
Selection signal:
LFP is often shortlisted where safety and lifetime predictability dominate and footprint is manageable.
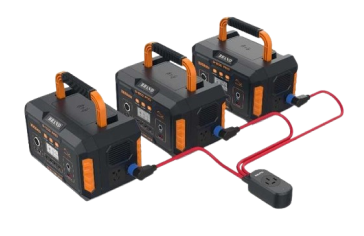
For organizations evaluating vendor options, it can be useful to review a supplier’s C&I positioning and integration scope. For example, Herewin publishes an overview of Herewin’s commercial and industrial energy storage solutions that maps storage to backup use cases (data centers, hospitals, and industrial facilities).
From an engineering standpoint, one area that often separates “spec-compliant” systems from operationally predictable ones is how the controls handle real-world measurement and operating limits. Technical validation typically focuses on issues specific to LFP chemistry—such as the flat voltage plateau (which complicates SoC estimation), sensor accuracy drift, and how estimation confidence fluctuates under heavy loads and temperature swings.
For decision-makers, the takeaway isn’t a single metric—it’s whether the supplier can explain (and document) the test method, error budgeting, and control safeguards used to keep dispatch and warranty boundaries aligned over time.
Grid storage: peak shaving, frequency response, and mixed services
Observed constraints:
duty cycle dispersion (not every project is “one cycle per day”)
revenue depends on availability and performance guarantees
augmentation strategy becomes a core financial lever
Selection signal:
energy density matters when siting is tight, but cycle-life predictability and warranty throughput often dominate long-horizon economics.
Commercial & industrial peak shaving / microgrids
Observed constraints:
demand-charge and tariff structure sensitivity
integration with plant operations and maintenance windows
preference for predictable replacement planning
Selection signal:
LFP is commonly evaluated as a conservative baseline; NMC can appear when footprint and high-power transients are dominant constraints.
2026 Strategy: From Chemistry Conflict to Portfolio Integration
The debate between LFP and NMC is shifting from a “winner-takes-all” competition to a complementary portfolio strategy. As we look toward 2026 planning, two technological convergence trends are narrowing the traditional gaps:
LFP Packaging Evolution: Advanced integration like Cell-to-Pack (CTP) and Cell-to-Chassis (CTC) is significantly increasing system-level energy density. By eliminating heavy internal modules, LFP systems are now challenging the footprint efficiency once reserved for NMC.
NMC Material Innovation: Next-generation NMC formulations (such as high-nickel, low-cobalt, or cobalt-free chemistries) are directly addressing historical pain points—reducing both commodity price volatility and ESG sourcing risks.
For industrial operators managing multiple sites, the 2026 mandate is diversification. Instead of forcing a single chemistry across all assets, leaders are treating them as complementary tools:
LFP for massive-scale, long-duration energy storage and greenfield industrial parks where safety predictability is the primary ROI driver.
NMC for space-constrained urban retrofits or high-power transient support where every square meter of footprint carries a premium cost.
This “Portfolio Approach” ensures that your energy infrastructure remains resilient against both supply chain shocks and shifting local regulatory requirements.
A chemistry-neutral procurement playbook
If you want a selection process that holds up across engineering, procurement, risk, and financing, treat the end of this article as a reusable action memo.
Part A — What to request in the RFP
Ask bidders to submit the following in a format that is traceable to test conditions and configuration scope:
System footprint at equal usable MW/MWh: system-level Wh/L and Wh/kg (not cell-only), auxiliary loads, and layout limits.
Warranty terms you can model: time + energy throughput (MWh), EOL definition, and the operating boundaries required to stay in warranty.
Degradation assumptions: temperature window, SoC window, DoD, C-rate, and any dwell-time limits at high SoC.
Safety and compliance evidence: UL 9540 listing scope and UL 9540A reports (cell/module/unit levels as available), plus installation guidance.
O&M concept of operations: spares strategy, module swap method, remote monitoring responsibilities, response-time SLAs, and escalation path.
Commercial risk exposure: commodity index linkage and price adjustment clauses (indices, caps, pass-through rules).
End-of-life obligations: take-back terms, recycling contracts/fees, and region-specific regulatory assumptions.
Part B — Technical Due Diligence: Validating the Data
Use this checklist to pressure-test vendor claims and avoid late-stage surprises in permitting, insurance, or grid commissioning:
Certifications vs. real-world configurations: what exactly is listed/certified (system vs subsystem), and what configurations are excluded?
UL 9540A evidence mapping: which test level(s) exist, and how do results map to your enclosure type, ventilation assumptions, and layout?
Permitting constraints: separation distances, gas controls, pressure relief, and any mandatory operating limits derived from the installation guidance.
Mandatory derates for warranty compliance: required SoC window, temperature limits, dwell-time limits, and C-rate caps.
Augmentation plan and timeline: year-by-year usable MWh retention forecast, plus triggers and costs for adding capacity.
Auxiliary load reality check: HVAC/pumps/parasitics assumptions and how they vary by ambient conditions.
O&M readiness: spares availability, swap procedure, tooling needs, remote diagnostics coverage, and incident response workflow.
Data and logs: what is logged (SoC/SoH, temperatures, events), retention period, and export format for audit and claims.
End-of-life execution: who owns logistics, what fees apply, and how residual value is treated in the financial model.
If you’d like, you can also request a lightweight ROI/TCO sanity-check worksheet tailored to your site constraints and duty cycle. Provide three inputs—your target MW/MWh, expected cycling pattern, and any permitting/insurance constraints—and the output can be a decision-ready comparison that makes assumptions explicit.
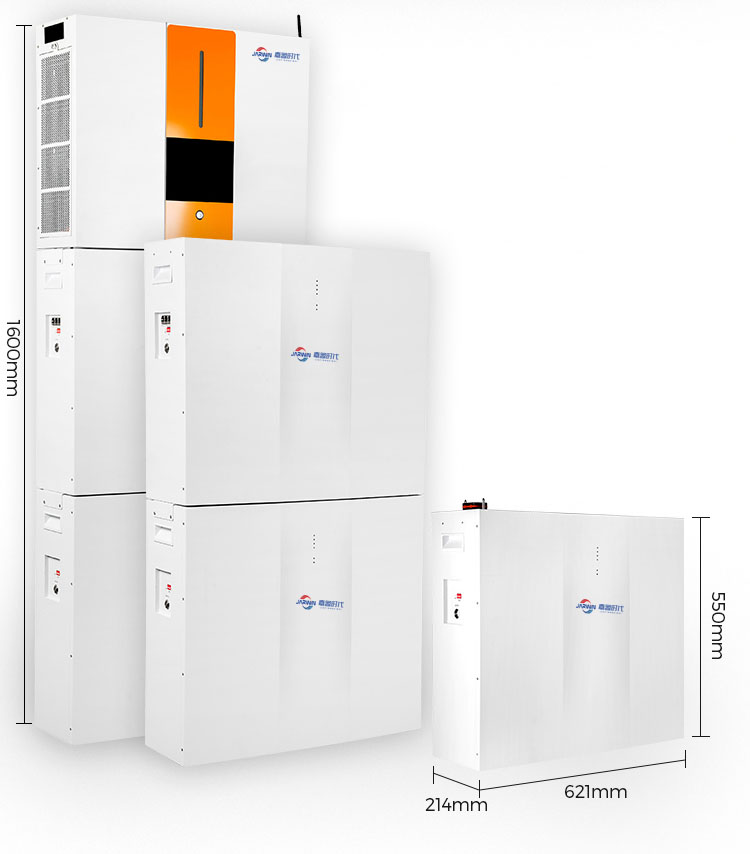
For buyers evaluating implementation options, Herewin provides a detailed range of commercial and industrial ESS products and you can contact Herewin for a spec-level discussion regarding your specific site requirements.