


Industrial UAV programs rarely fail because the battery is “too small.” They more often fail because the energy that exists on paper can’t be converted into stable thrust across the mission’s real load profile.
This is the payload paradox in its operational form: adding battery mass can increase nameplate watt-hours, while simultaneously compressing net payload margin, increasing current demand, and turning a larger share of stored energy into resistive heat and voltage droop.
This guide is written for 10–200 kg MTOW industrial UAV teams doing industrial drone battery selection under heavy payload and high-current constraints.
Scope note: Physics relationships (e.g., Joule heating) are general. Manufacturer-specific statements are attributed to the linked documents.
The Payload Paradox: Why “More Battery” Often Leads to Less Efficiency
The Law of Diminishing Returns in MTOW
For any aircraft, MTOW is a hard constraint: the mass budget is finite. For heavy-lift multirotors, this is usually expressed as a fixed takeoff mass ceiling that must cover:
airframe and propulsion system mass
battery mass
payload (net payload)
reserves and protection margins (thermal, voltage, return-to-home policy)
When battery mass rises, two effects show up at the same time:
The aircraft needs more thrust to hover, raising electrical power demand.
The battery must supply that power at higher current, pushing the pack toward higher C-rate operation.
Past a certain point, the additional watt-hours you “add” are partially consumed by the additional energy required to lift the added battery mass itself. The result is a diminishing-return curve rather than a linear flight-time gain.
The Conflict Between Flight Time and Net Payload
In a payload-constrained mission (cargo, spraying, lifting tools), endurance and net payload form a practical seesaw:
Increasing battery capacity can extend nominal endurance.
The same increase reduces net payload headroom inside MTOW.
This is why heavy-payload programs often become mass-budget negotiations rather than capacity hunts. Improving UAV battery energy density (Wh/kg) tends to move the seesaw more effectively than simply increasing pack size.
The Heat-Weight-Power Trade-off
Under heavy payload, propulsion demands a higher power ceiling (and faster transient response). In electrical terms, higher power typically implies higher current.
That shifts the battery into a regime where resistive losses and temperature rise become first-class design constraints—not side effects. Teams often respond by adding:
more thermal mass (structure, heat paths)
larger safety buffers (reserve SoC, conservative cutoffs)
lower current limits (derating)
All three protect safety and reliability, but they also add mass or reduce usable energy—tightening the paradox further.
Energy Loss Mechanisms: Why Batteries Fail Under High Load
DCIR and P = I²R : The “Energy Tax”
DC internal resistance (DCIR) is a compact way to describe how much of your battery’s delivered power is diverted into heat when current flows.
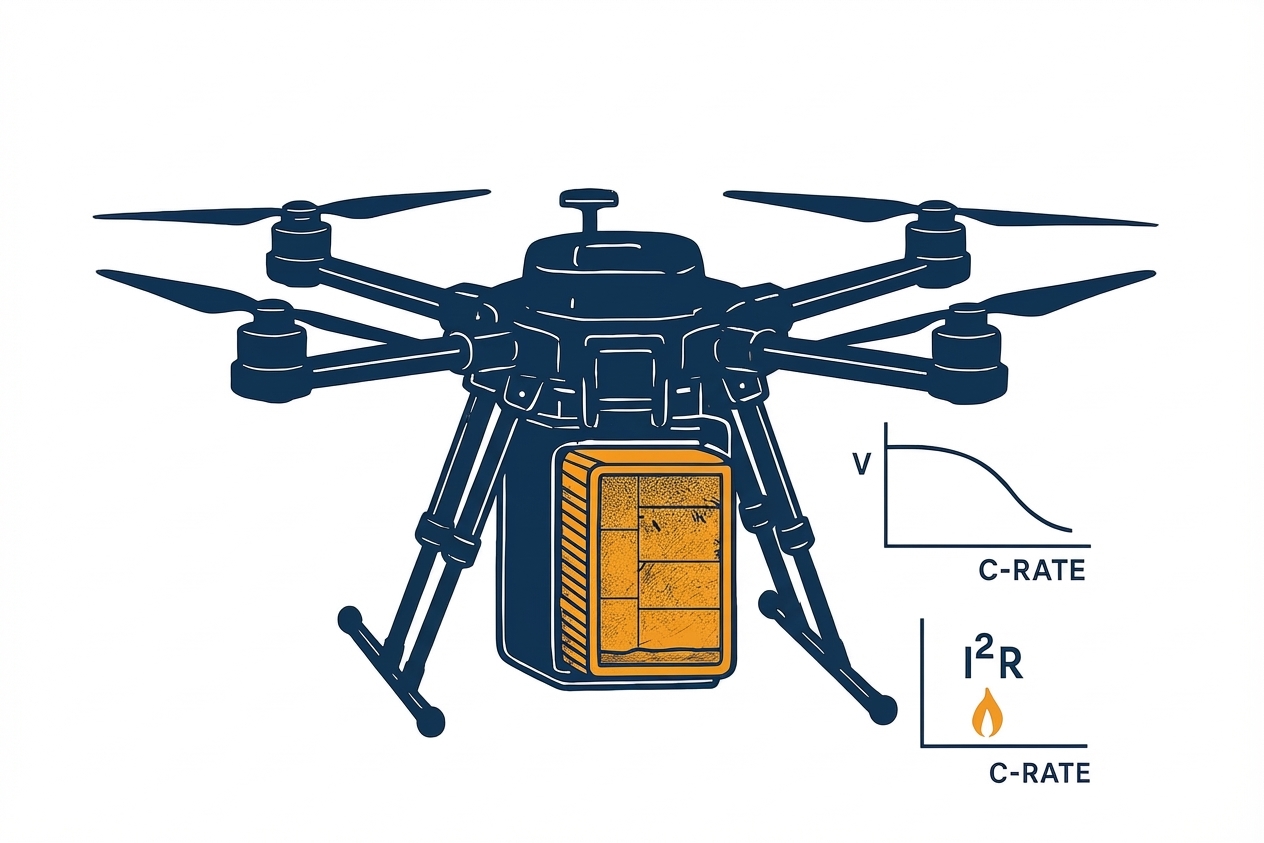
At the mechanism level, resistive heating follows the Joule relationship: power dissipated as heat scales with current squared:
Resistive power loss: Ploss = I² · R
In practical UAV terms, this behaves like an “energy tax”:
The mission draws current to generate thrust.
A portion of that draw is paid as heat inside cells, interconnects, and contacts.
That heat is not available for propulsion, and it accumulates with duty cycle.
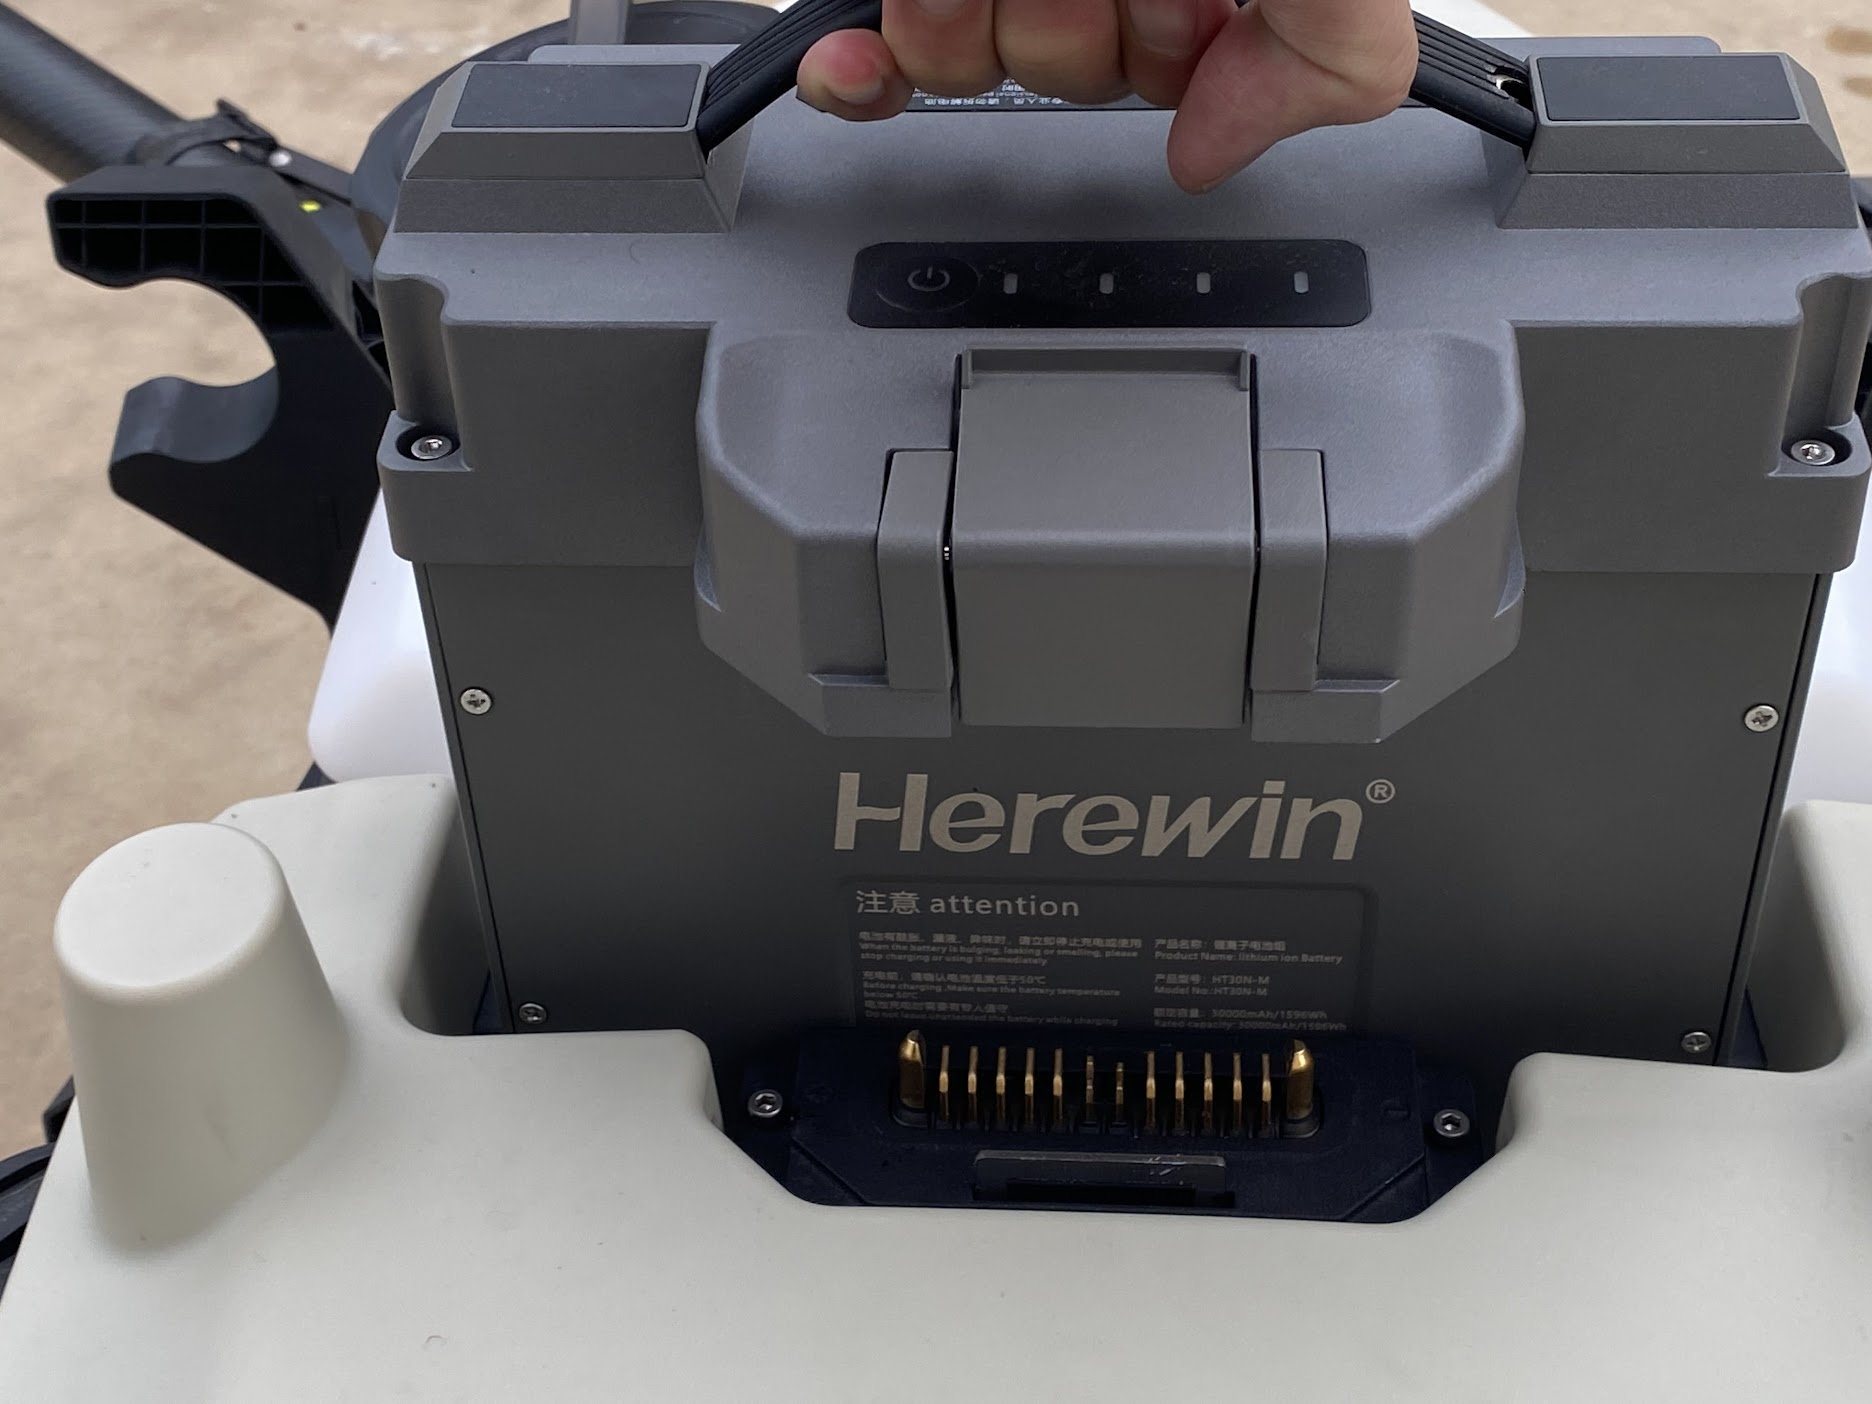
A manufacturer example of how DCIR is treated operationally is described in Herewin’s Industrial Drone Lithium Battery Maintenance Guide, which frames DCIR as a key health indicator and references Joule heating (Q = I²R) under high-current sorties.
Voltage Sag and Premature Low-Voltage Cutoff
Voltage sag is the short-term drop in terminal voltage when a high current step occurs—takeoff, aggressive climb, or a recovery from a gust.
Operationally, sag matters because most UAV powertrains enforce low-voltage cutoffs to protect the pack and maintain control authority. If voltage droop crosses the cutoff threshold during a transient, the aircraft can behave as if it is “out of battery,” even when usable capacity remains.
One way sag becomes visible is cell-to-cell divergence under load: a weaker cell or higher-impedance path sags more, and pack-level safety logic is forced to follow the worst element.
Thermal Accumulation in Heavy Payload Operations
Thermal accumulation is rarely “one spike.” It’s typically the combination of:
high average current across a sortie
repeated transients (climb, maneuver, wind correction)
limited convective cooling (hot days, low airflow, tight enclosures)
In this regime, DCIR rise and temperature rise are frequently observed together. As described in the same maintenance guide, DCIR growth is discussed alongside SEI thickening and reduced electrolyte conductivity.
Important constraint: Cycle-life outcomes depend on chemistry, voltage window, DoD, thermal management, and the mission load profile. Avoid treating any single “500 → 300 cycles” narrative as universal without validation data for your operating envelope.
The Core Engineering Decision for Industrial Drone Battery Selection
The Inverse Relationship Between C-Rate and Wh/kg
C-rate capability and specific energy are often treated as independent spec-sheet columns, but in engineering practice they are entangled by design choices.
Supporting high discharge rates is typically associated with:
lower effective resistance (cell design + interconnects)
higher-rate electrode architecture (ionic/electronic transport)
higher thermal and safety headroom (materials + packaging)
Those choices can coincide with extra non-active mass or lower active-material loading. The observable outcome is that packs designed to survive repeated high-current load profiles may not maximize Wh/kg.
The selection problem is therefore not “high C vs high density” as a binary. It is: how much C-rate headroom is required by the mission’s current profile—and how much Wh/kg remains after you build the safety envelope needed to operate there?
Mission-Based C-Rating Selection
A practical way to de-risk the trade-off is to classify missions by the C-rate band they actually demand—and to size the pack from measured peak current and load steps, not from a generic label.
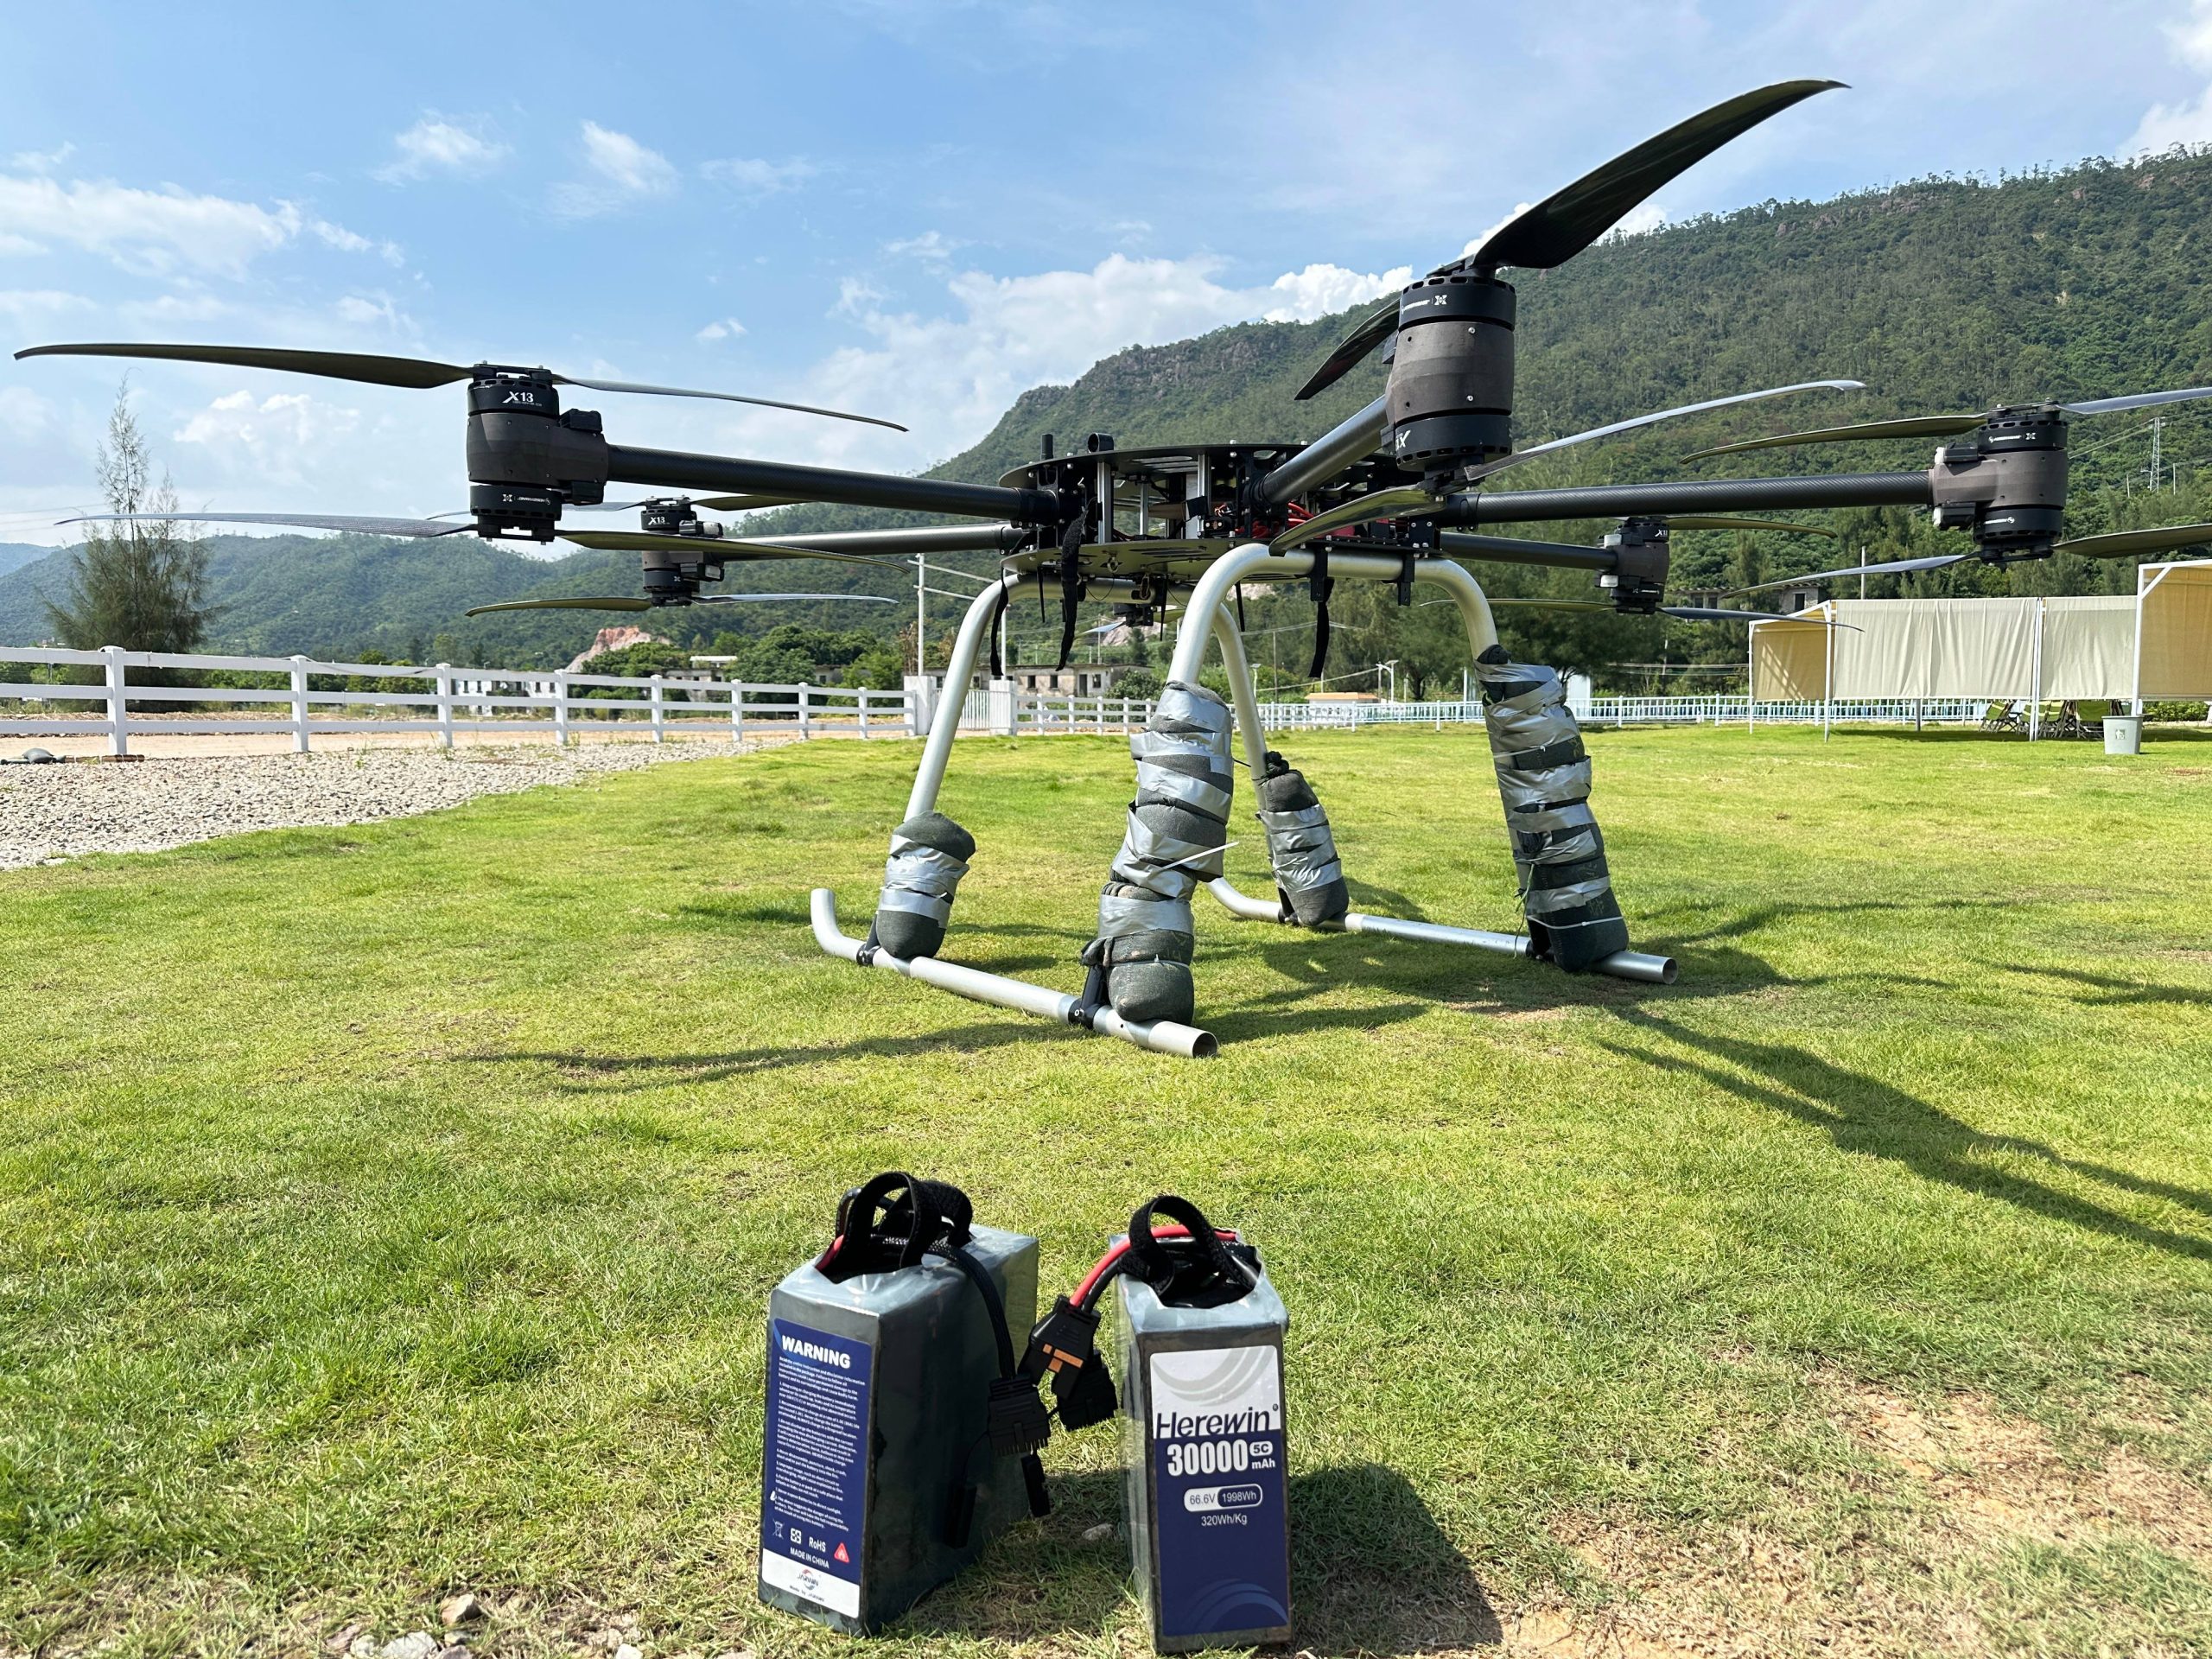
At Herewin, we often map battery recommendations to UAV mass classes because the current profile and duty cycle tend to shift predictably with payload and takeoff weight. A simplified sizing reference looks like this:
10–50 kg (light industrial UAVs): commonly optimized for frequent takeoffs/landings and short sorties. Typical reference specs include 6S (22.2V), 10,000–15,000 mAh, and 50C–80C to support fast transient response.
50–100 kg (mid-load industrial UAVs): often prioritize endurance and robustness in field operations. Typical reference specs include 3S–6S, 15,000–25,000 mAh, and 30C–50C, balancing capacity with sag resistance.
100–200 kg (heavy-load industrial UAVs): frequently require customized voltage (airframe-driven), 25,000 mAh+, and 50C+ headroom, because takeoff and gust recovery can create very high peak current steps.
These bands shouldn’t replace validation. They’re a starting point to align your pack design with the mission’s peak-current envelope. We still recommend deriving the final C headroom from flight logs: peak current, minimum pack voltage during steps, temperature rise rate, and per-cell divergence. That’s the most reliable way to ensure the pack won’t hit low-voltage protection or thermal derating during the exact parts of the mission that matter most.
Defining the Optimization Window for 10-200kg UAVs
Rather than a single “best battery,” heavy UAV programs usually define an optimization window—a set of acceptable combinations of:
pack Wh/kg (mass budget)
DCIR and its drift over life (sag + heating)
allowable peak current (transient response)
thermal rise per sortie (thermal headroom)
reserve policy (usable SOC vs safety margin)
A simple engineering matrix for 10–200 kg MTOW classes can be expressed as a selection checklist rather than a universal recommendation:
UAV class (MTOW) | Typical mission risk under load | What tends to dominate qualification | What to log in flight testing |
|---|---|---|---|
10–30 kg | Voltage cutoff events during bursts | sag behavior + reserve policy | current peaks, minimum pack voltage, per-cell delta, DCIR trend |
30–80 kg | Thermal accumulation across duty cycle | thermal rise + DCIR drift | temperature rise per minute, DCIR at standardized SoC/T, cutoff proximity |
80–200 kg | Mass budget + reliability at scale | pack Wh/kg vs safety envelope | mass breakdown (active vs inactive), thermal limits, derating logic, cycle retention |
This matrix is deliberately phrased as “what to measure.” Your program’s acceptable window depends on payload, thrust margin, ambient conditions, and certification boundaries.
At this point, the selection logic should feel consistent: a heavy-payload mission creates a current profile, the current profile drives DCIR heating and voltage sag, and those mechanisms determine which pack-level metrics you must qualify. Only then does it make sense to compare architectures—because “better” only means “better at your measured load-step and thermal envelope.”
Engineering Solutions: High-Energy-Density Architectures for Industrial UAVs
Semi-Solid Chemistry: High-Ni + Silicon Anode
Semi-solid batteries are sometimes discussed as a branding label. The engineering version is more precise.
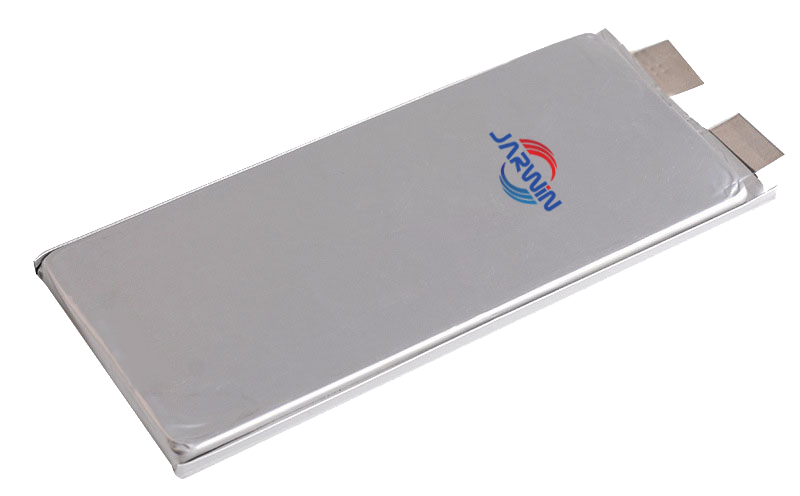
In Herewin’s semi-solid energy-density note, semi-solid is framed as a solid-dominant electrolyte network with ≤10% liquid by weight, using polymer/ceramic composite structures and ceramic fillers, in Industrial Drone Battery Density 2026: Achieving 300+ Wh/kg via Materials and Design.
In the same note, silicon-carbon anodes are described with roughly 5–10 wt% silicon, alongside mitigation techniques for silicon expansion and SEI stability.
Targeting 350-400 Wh/kg Energy Density
When teams talk about “Wh/kg,” it’s easy to mix two different engineering numbers:
Cell-level specific energy (what the electrochemistry can deliver at the cell)
Pack-level specific energy (what the aircraft actually carries after structure, protection, interconnects, harnessing, and BMS)
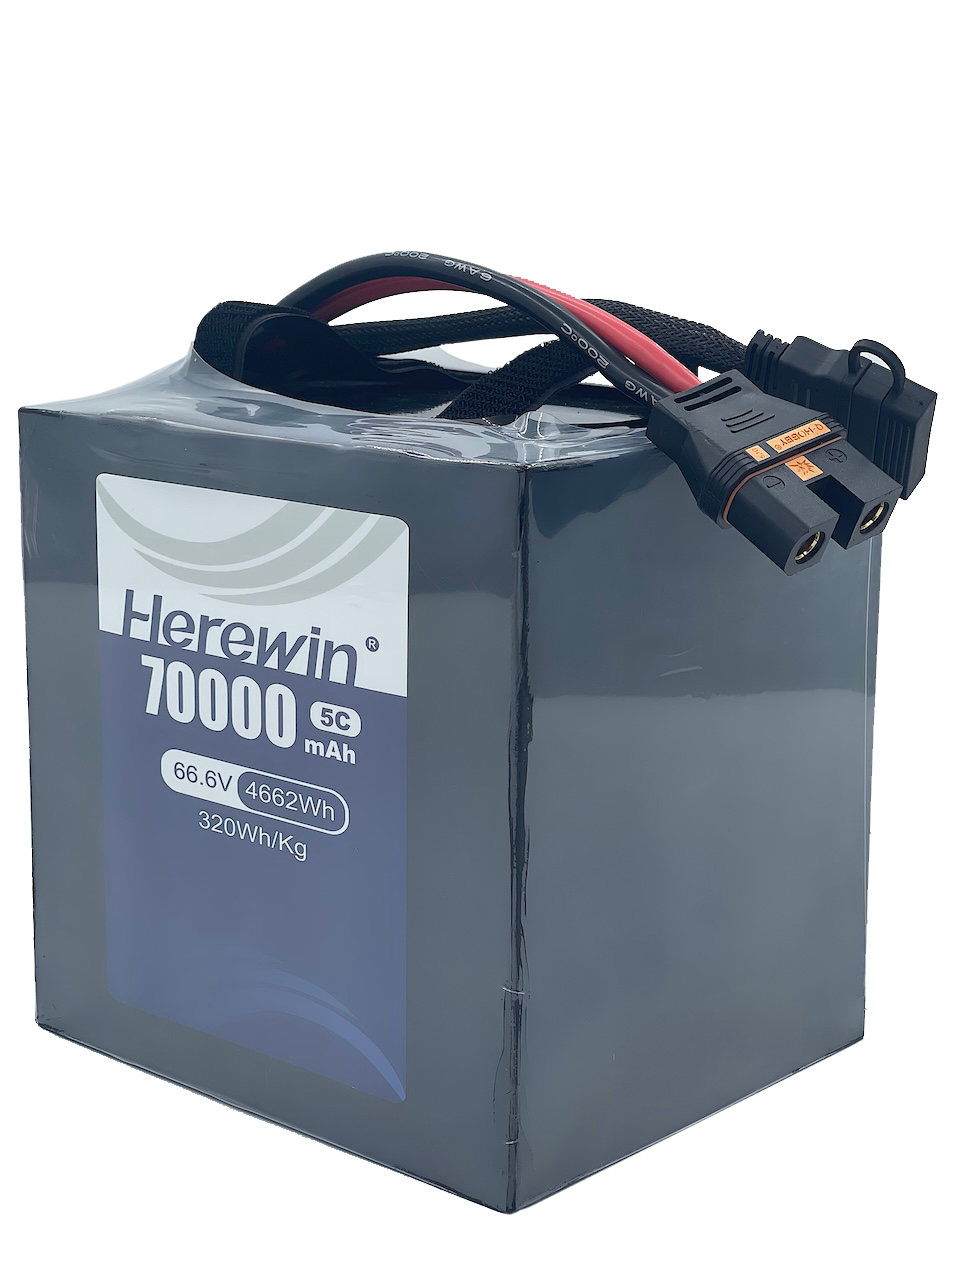
In our semi-solid program, our cell-level characterization reaches ~347.5 Wh/kg under defined conditions. The aircraft, however, flies the pack, not the cell. Once you account for structural parts, compression/swelling control, busbars, connectors, protection design, and BMS, the pack-level target band typically lands around 280–320 Wh/kg.
This “cell → pack” delta isn’t a marketing footnote; it’s the practical cost of operating safely in industrial duty cycles. For heavy-payload selection, pack-level Wh/kg is the decision number because it is what consumes MTOW budget and determines how much margin you can allocate to payload, thermal headroom, and reserve policy.
Structural Optimization: Reducing Inactive Mass in the Pack
When teams chase longer endurance by adding capacity, they often ignore the “silent” penalty: inactive mass. Enclosures, compression structures, busbars, and protection layers don’t produce watt-hours, but they absolutely consume MTOW.
At Herewin, we separate two different levers that often get mixed together:
Cell/stack-level changes that increase active fraction (for example, in some designs we target up to ~30% reduction in separator thickness via alumina coating and solid-electrolyte thin-film approaches, subject to safety and qualification constraints)
Pack-level structural changes that reduce inactive mass (for example, using soft-pack / aluminum-plastic film packaging in place of metal housings can deliver an estimated ~20% pack weight reduction in certain configurations)
These are different dimensions: one is inside the cell stack, the other is the mechanical and packaging overhead around the pack. The point isn’t the headline percentage—it’s whether the finished pack shows a better mass breakdown (active vs. inactive) and still passes swelling, vibration, impact, and thermal qualification.
If you want the deeper rationale and the cell-to-pack accounting method we use (cell-level vs. pack-level Wh/kg), we summarize it in Industrial Drone Battery Density 2026: Achieving 300+ Wh/kg via Materials and Design.
System Integration and Operational ROI
Smart BMS: Reducing Safety Buffers via ±3% Accuracy
BMS accuracy isn’t just a safety spec—it changes how much energy you can confidently use. When SOC uncertainty is large, flight ops teams protect themselves by carrying a bigger reserve buffer. That buffer is real, mass-budgeted energy that never turns into thrust.
At Herewin, we use a next-generation SOC estimation approach that combines coulomb counting with voltage compensation. Under our defined test conditions and calibration process, we keep SOC display error within ±3%, so the system can report remaining energy and estimate remaining operating time more consistently. In many deployments, this data can also be viewed remotely in an app, which helps maintenance and operations teams plan return-to-home timing earlier and reduce the likelihood of schedule-driven, premature landings.
What this enables in practice is a more rational reserve policy: you can set return-to-home and cutoff thresholds based on measured estimation bounds, rather than “just in case” padding. The exact utilization gain depends on mission profile, ambient conditions, and your voltage-sag envelope, so it should be confirmed in flight testing. We outline the method and validation steps in Industrial Drone BMS Guide.
Environmental Adaptability: Overcoming Cold-Weather Hazards
Cold weather is where marginal packs get exposed. As temperature drops, internal resistance rises and reaction kinetics slow, so the same thrust demand produces more voltage sag and more heating per delivered watt.
Operationally, the most reliable pattern we see is simple: preheat when you can, and validate cold starts with the same load-step profile you expect in the field (takeoff, climb, gust recovery). We also recommend treating charging as a separate risk gate—charging below 0°C can increase lithium plating risk depending on chemistry and current.
We lay out a practical cold-start checklist and the reasoning behind preheat thresholds in Ultimate Guide: Emergency Response Drone Batteries — Cold Start.
From Battery Performance to Productivity ROI
ROI discussions often fail because they skip the intermediate variables. A more auditable approach is to express productivity as a function of measurable inputs.
A simple template:
Δm: Mass saved by moving to higher pack Wh/kg.
m_payload: Net payload mass.
E_usable: Usable energy per sortie after reserve policy.
P_avg: Average electrical power across the mission profile.
Then, first-order operational effects can be evaluated as:
Net payload headroom change: Δm can be re-allocated to payload or to safety margin (thermal/voltage).
Endurance change: t ≈ E_usable / P_avg. Improvements to sag behavior or reserve policy effectively increase E_usable in the same mass envelope.
Throughput change: Missions/day depends on sortie duration + turnaround (charging/swapping) + reliability interruptions.
If you need an explicit “heavy-lift drone battery” ROI estimate, the most defensible path is to plug your own mission geometry and turnaround constraints into this template rather than borrowing universal percentages.
Next steps
If you’re formalizing a downselect for a 10–200 kg MTOW platform, keep the main thread intact: validate mechanisms with measurements. That means you don’t just compare datasheets—you confirm that DCIR, sag, and thermal rise stay inside your control envelope under the same load steps your aircraft will see.
A practical validation packet that makes the trade-offs auditable usually includes:
pack-level Wh/kg (mass breakdown: active vs inactive)
DCIR at standardized SoC and temperature, plus DCIR drift over cycles
voltage sag under load using a representative load-step profile
thermal rise per sortie under a defined duty cycle
SOC accuracy method and calibration approach
cold-start SOP and charging temperature constraints
If you want help turning your mission profile into a test plan and acceptance window, contact our application engineering team for a validation packet tailored to your MTOW class at Herewin Technical Consultation.