
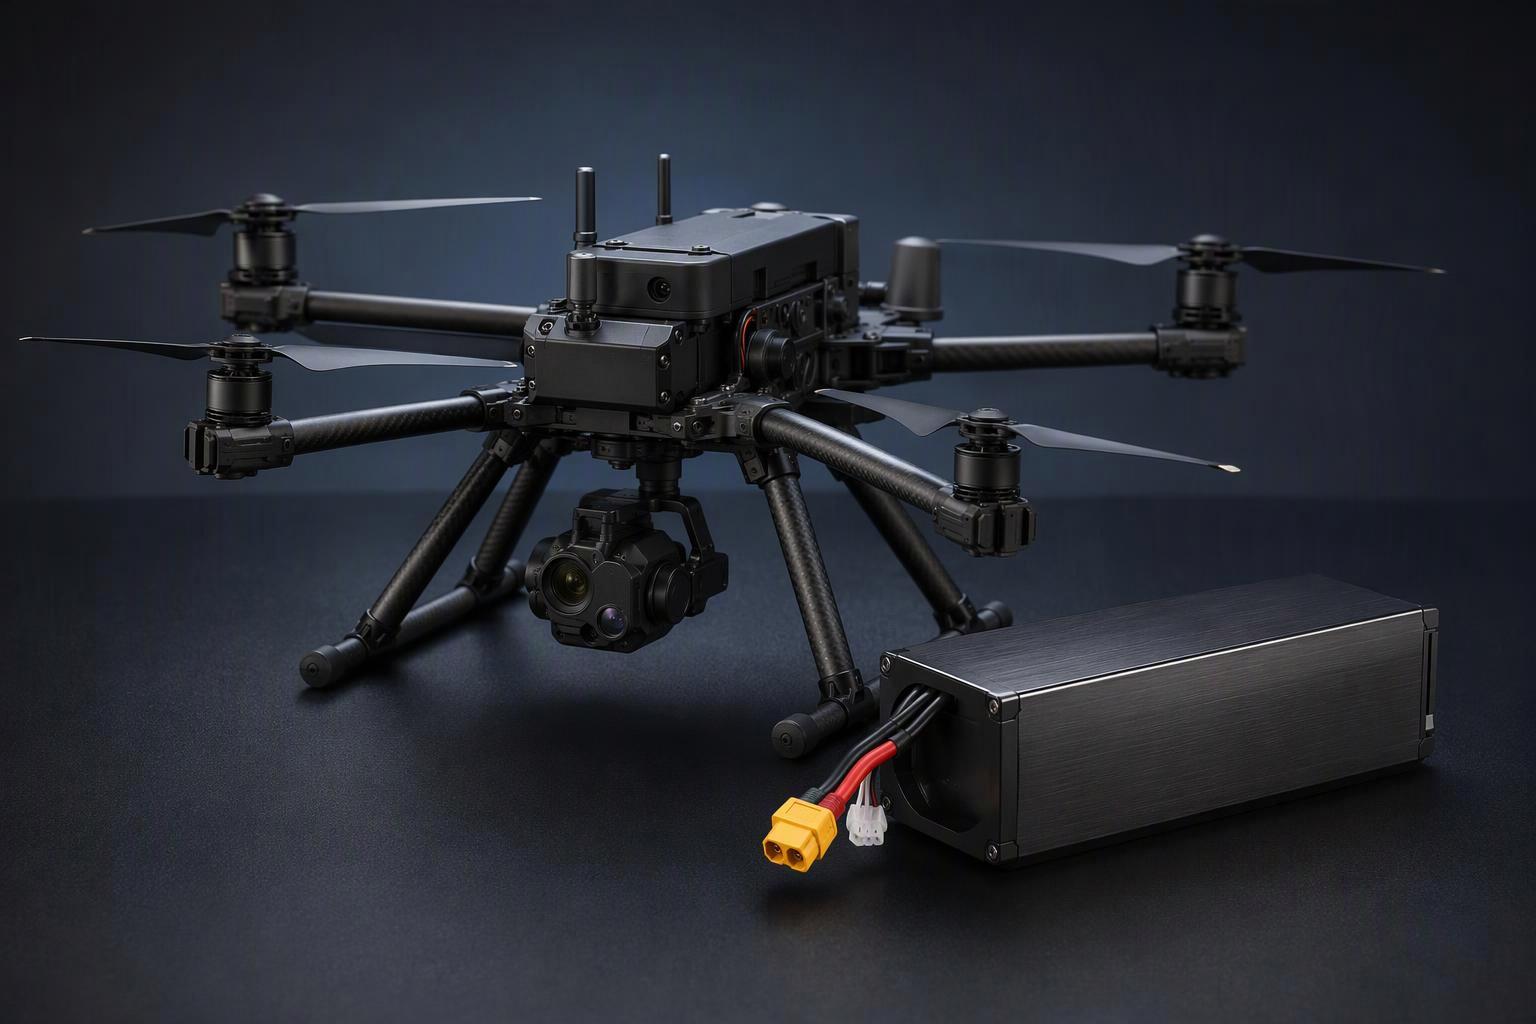
The short answer is no. The reason is simple: adding battery capacity also adds battery mass, and that extra mass increases the power required to keep the UAV airborne. On a multirotor, those two effects pull in opposite directions, and beyond a certain point the extra mass can erode the benefit of the added energy.
So the useful question is not “how many Ah can I fit” but “which lever moves endurance on this airframe”: more capacity, better pack-level energy density, or more power capability. Those three levers have different costs, and picking the wrong one gives you a heavier aircraft that flies no longer.
Battery Capacity Determines Stored Energy, Not Flight Time
Amp-hours measure charge, not energy, and the distinction decides every comparison you make between packs. Energy in watt-hours is nominal voltage multiplied by capacity. A 22.2 V, 5 Ah pack stores about 111 Wh, while a 22.2 V, 7 Ah pack stores about 155 Wh. But the larger pack also weighs more, and two packs with the same Ah label at different platform voltages are not interchangeable. Ah alone cannot rank them.
Rated capacity is also declared under fixed test conditions rather than mission conditions. A pack that meets its rating on a lab bench has not been qualified for a climb profile, because nominal capacity says nothing about how it holds up under a real discharge load.
The number that matters in the air is delivered energy — the watt-hours actually delivered over the mission, divided by pack mass to give usable Wh/kg. Capacity is the starting point of that calculation, not the answer to it.
Why a Larger Battery Also Increases UAV Power Demand
For a multirotor, hover power does not rise proportionally with mass. As total mass increases, the propulsion system needs disproportionately more power to generate the required lift. A 20% increase in mass can therefore require substantially more than 20% additional induced power under simplified hover assumptions (ICAS 2024).
Disk loading decides how painful that penalty is. On a small-rotor airframe, added mass pushes the propulsion system into a materially higher power band; a large-rotor platform absorbs the same extra pack with far less strain. Rotor area, air density and drivetrain losses all sit between the battery and the clock.
This is the crux of the whole trade-off. The practical question is whether the additional stored energy outweighs the propulsion penalty created by the added battery mass.
Why Flight Time Does Not Increase Linearly With Battery Capacity
There is a capacity beyond which more battery shortens the flight, and it is not a rule of thumb you can read off a datasheet. Simulations that sweep payload against battery capacity, recalculating craft mass on every iteration, show an endurance optimum at a specific capacity band and falling flight time on both sides of it, because “as battery capacity is increased, the battery mass increases also” (Oregon State University, EATS 2019).
The point is that there is an optimum battery mass range for a given airframe, and beyond it additional battery mass can reduce endurance rather than extend it. That optimum is not a number you import from someone else’s aircraft — it is a curve you find for your own platform.
|
Pack |
Capacité |
Nominal energy |
Pack mass |
Note |
|---|---|---|---|---|
|
A |
5 Ah |
111 Wh |
820 g |
Baseline |
|
B |
6 Ah |
133.2 Wh |
975 g |
+20% energy, +19% mass |
|
C |
7 Ah |
155.4 Wh |
1,130 g |
+40% energy, +38% mass |
Example assumption. The table is illustrative arithmetic at a fixed nominal voltage and a constant energy-to-mass ratio. It shows why the energy gain and the mass gain arrive together. It does not predict a flight-time percentage, and no propulsion test data backs a hard number here.
More Capacity or Higher Energy Density?
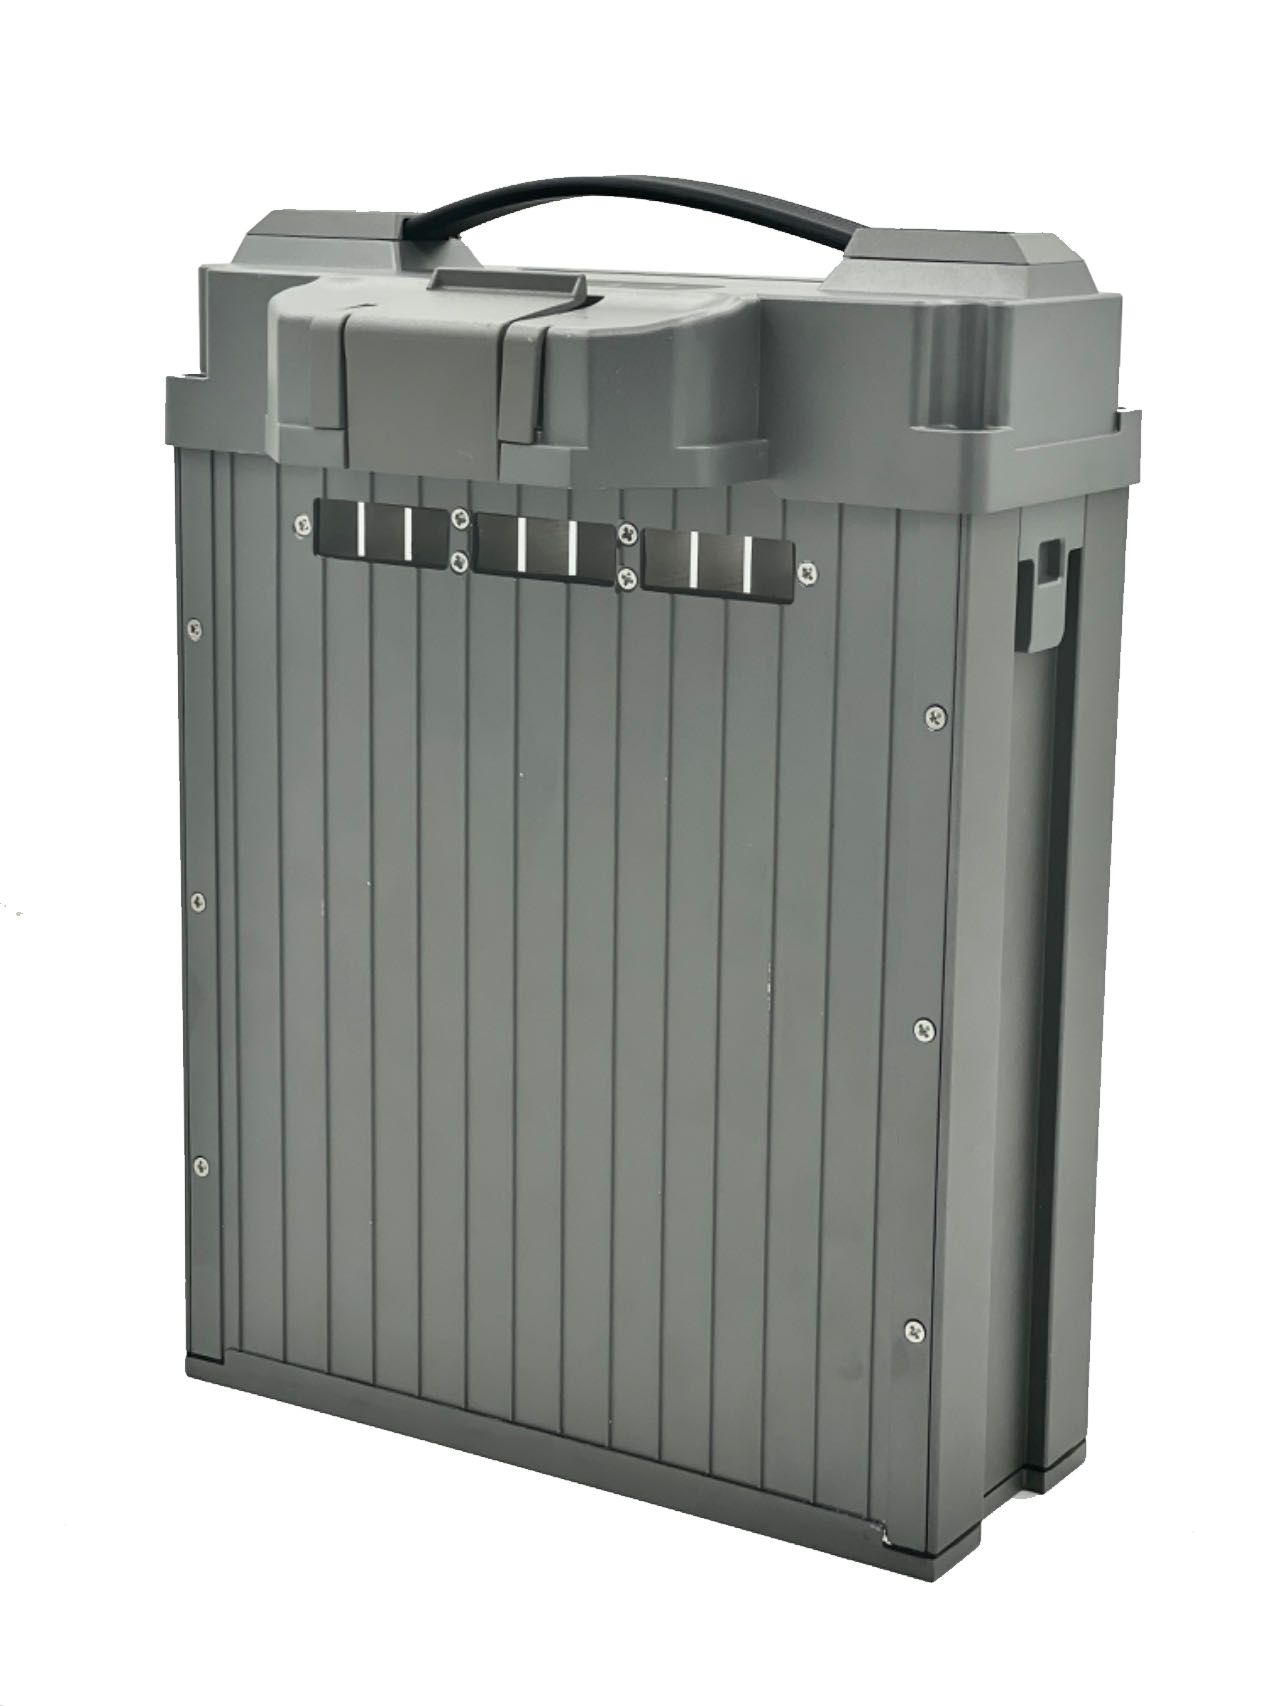
This is the decision that actually matters, and it comes down to one question: which budget is binding on your airframe? Not which number looks better on a datasheet. If you still have mass margin to spend, capacity is available as a lever. If you do not, adding capacity spends the very resource that endurance depends on. Whichever lever is right, the pack will be built to the airframe rather than bought off a shelf — which is where pack-level design decisions, from cell mixing to thermal path, get made.
|
Airframe constraint |
Better direction |
|---|---|
|
Enough mass margin |
More capacity |
|
Mass-limited |
Higher pack-level Wh/kg |
|
Volume-limited |
Higher volumetric energy density or a pack redesign |
|
Power-limited |
Higher discharge capability and a thermal-aware pack design |
When to Add Capacity
Adding capacity works when the airframe still has sufficient mass margin, the pack bay has physical room for a larger pack, and the propulsion system has headroom above the new hover power — because a 20% mass increase asks for substantially more than 20% more induced power. It also only helps if the mission needs more usable energy rather than more burst current, which is a different constraint entirely.
When to Improve Pack-Level Wh/kg
When the airframe is mass-limited, payload-critical, weight-sensitive or space-limited, capacity is the wrong lever and pack-level Wh/kg is the right one. Beyond the endurance optimum, further capacity increases reduce maximum flight time because the mass arrives with the energy. A pack that delivers the same watt-hours in less mass improves endurance without touching the power budget, the pack bay geometry or the payload allowance — which is exactly what a heavier pack cannot do.
Look at Cell Wh/kg and Pack Wh/kg Separately
Cell-level energy density is not the number your aircraft flies on, and the gap is large enough to change a selection decision. NASA measured the same gap on its X-57 pack — 225 Wh/kg cells against 149 Wh/kg at the pack level, a substantial reduction — and the paper states plainly that “doubling cell energy density doesn’t translate to doubled pack energy density” (NASA NTRS 20210017488). The overhead is not constant either; it varies with pack requirements, cell chemistry and architecture, and a substantial part of it exists to manage thermal runaway rather than nominal heat.
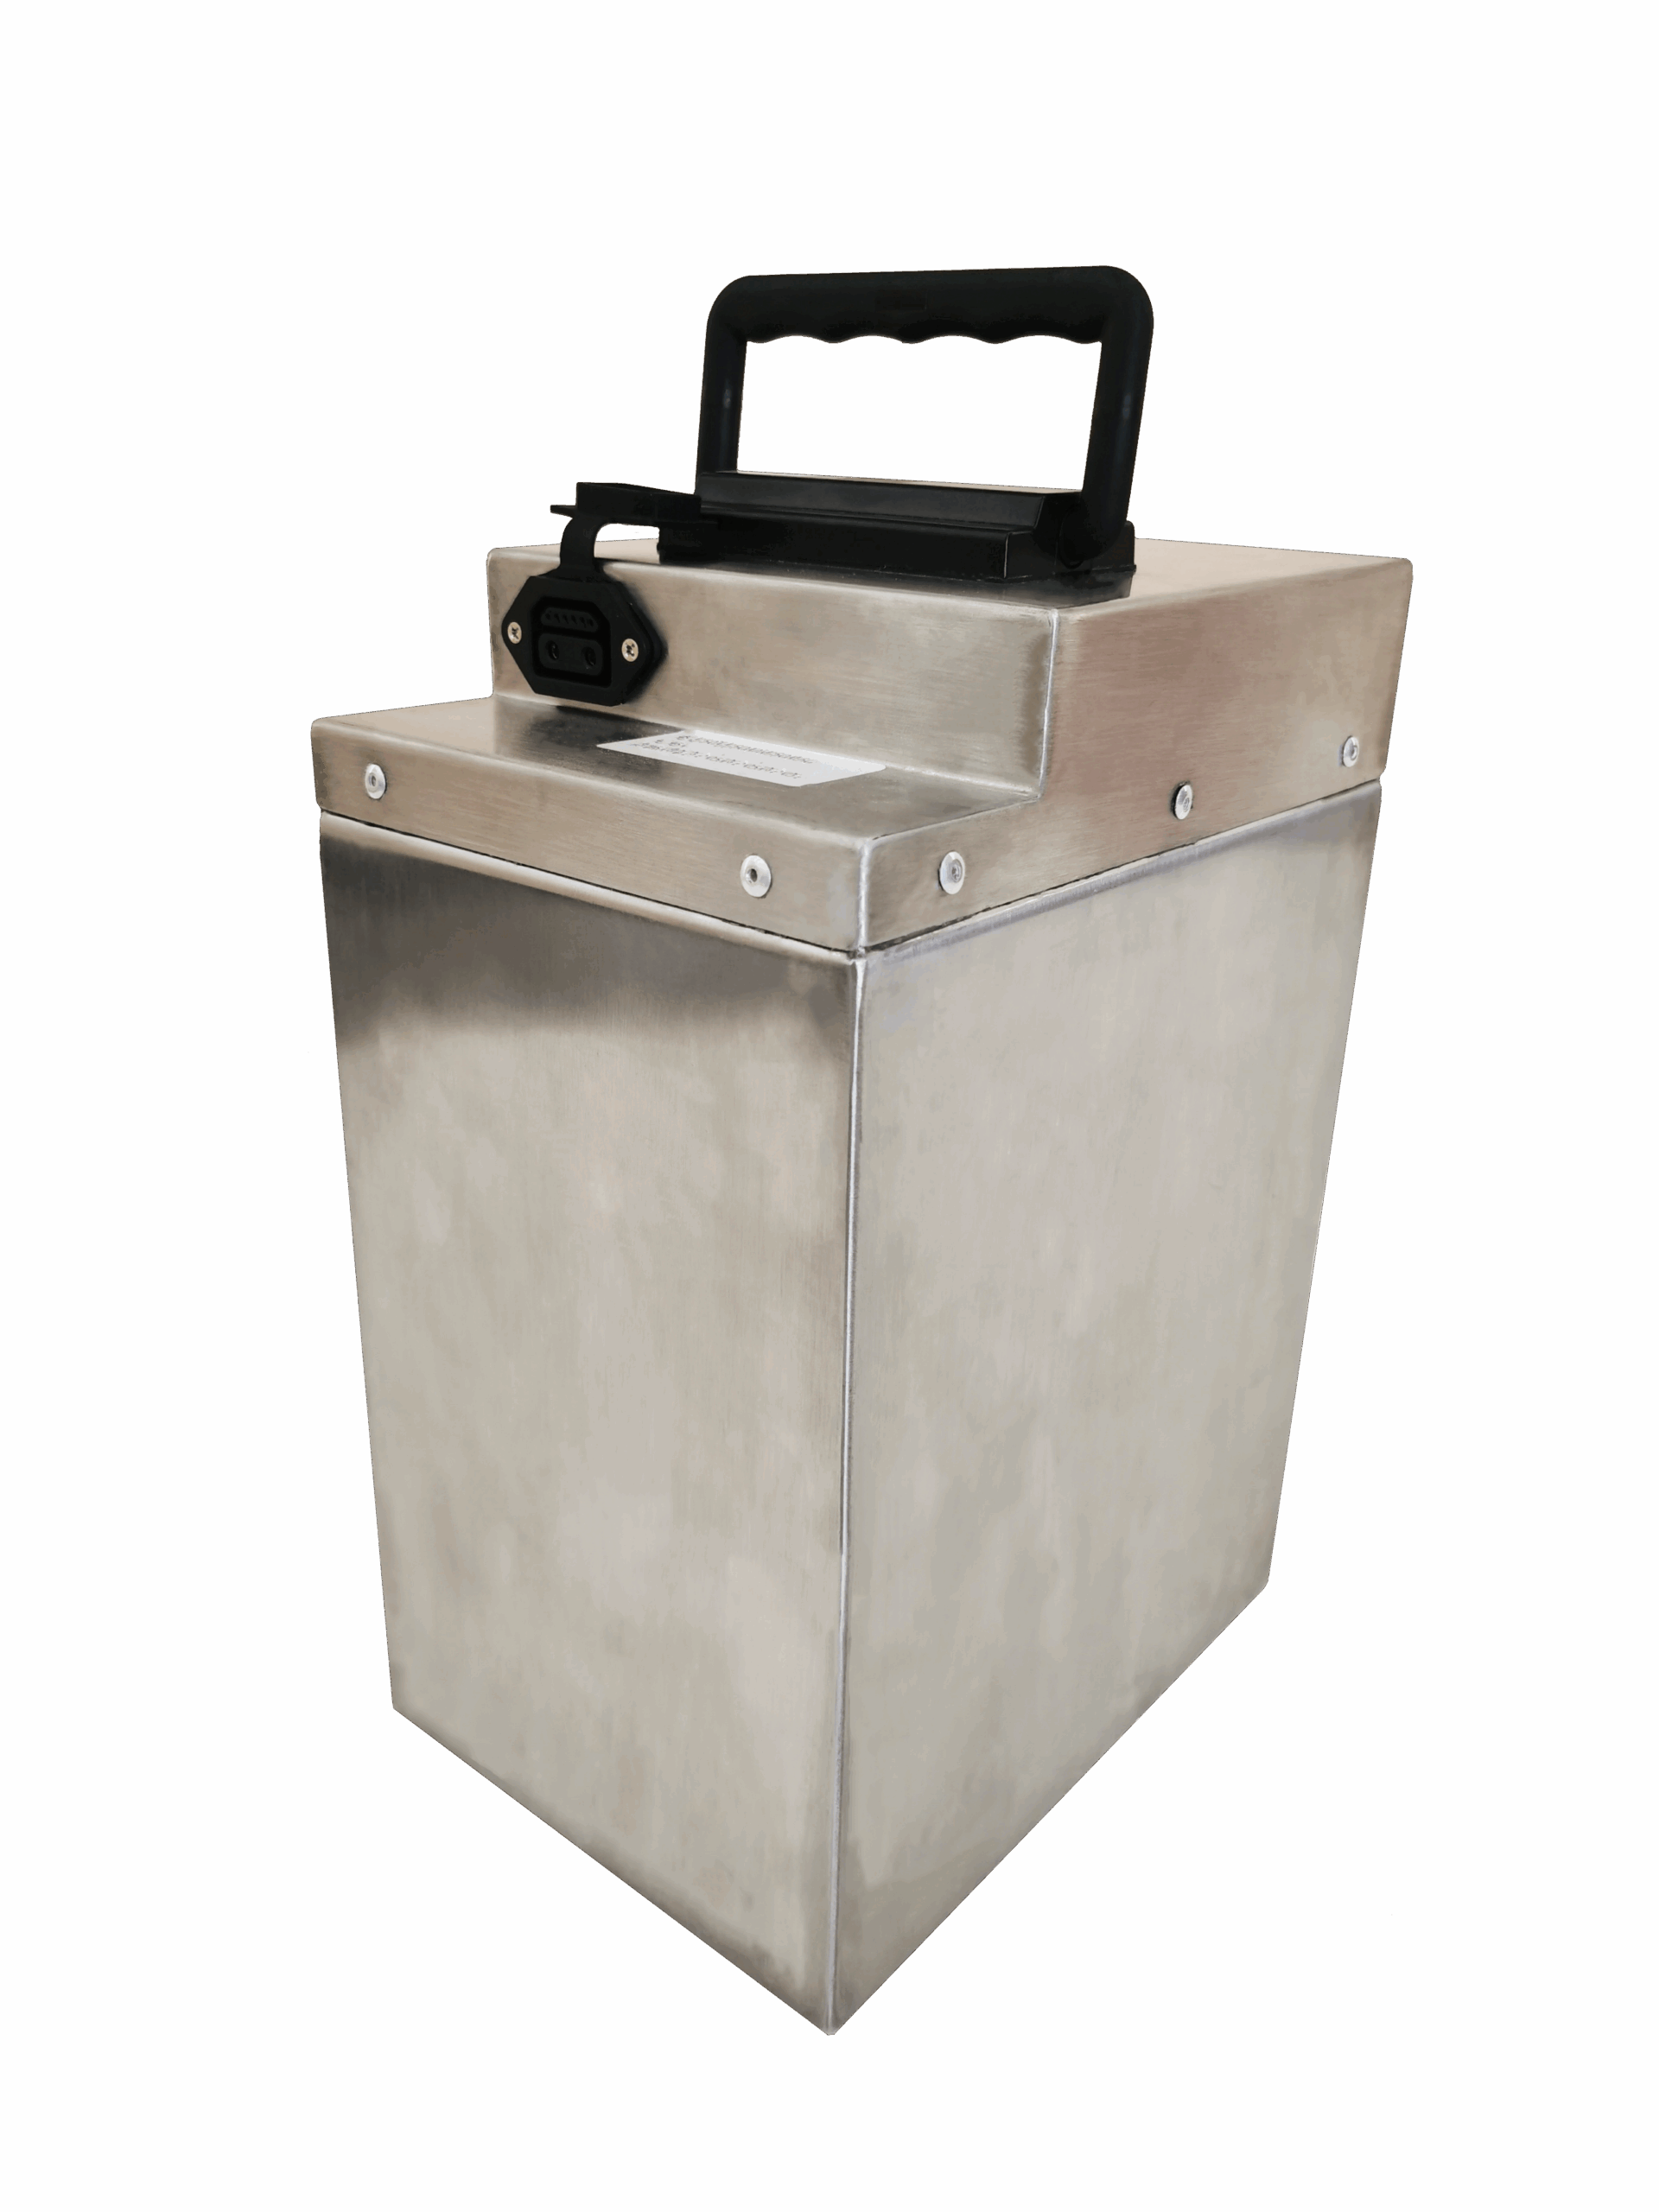
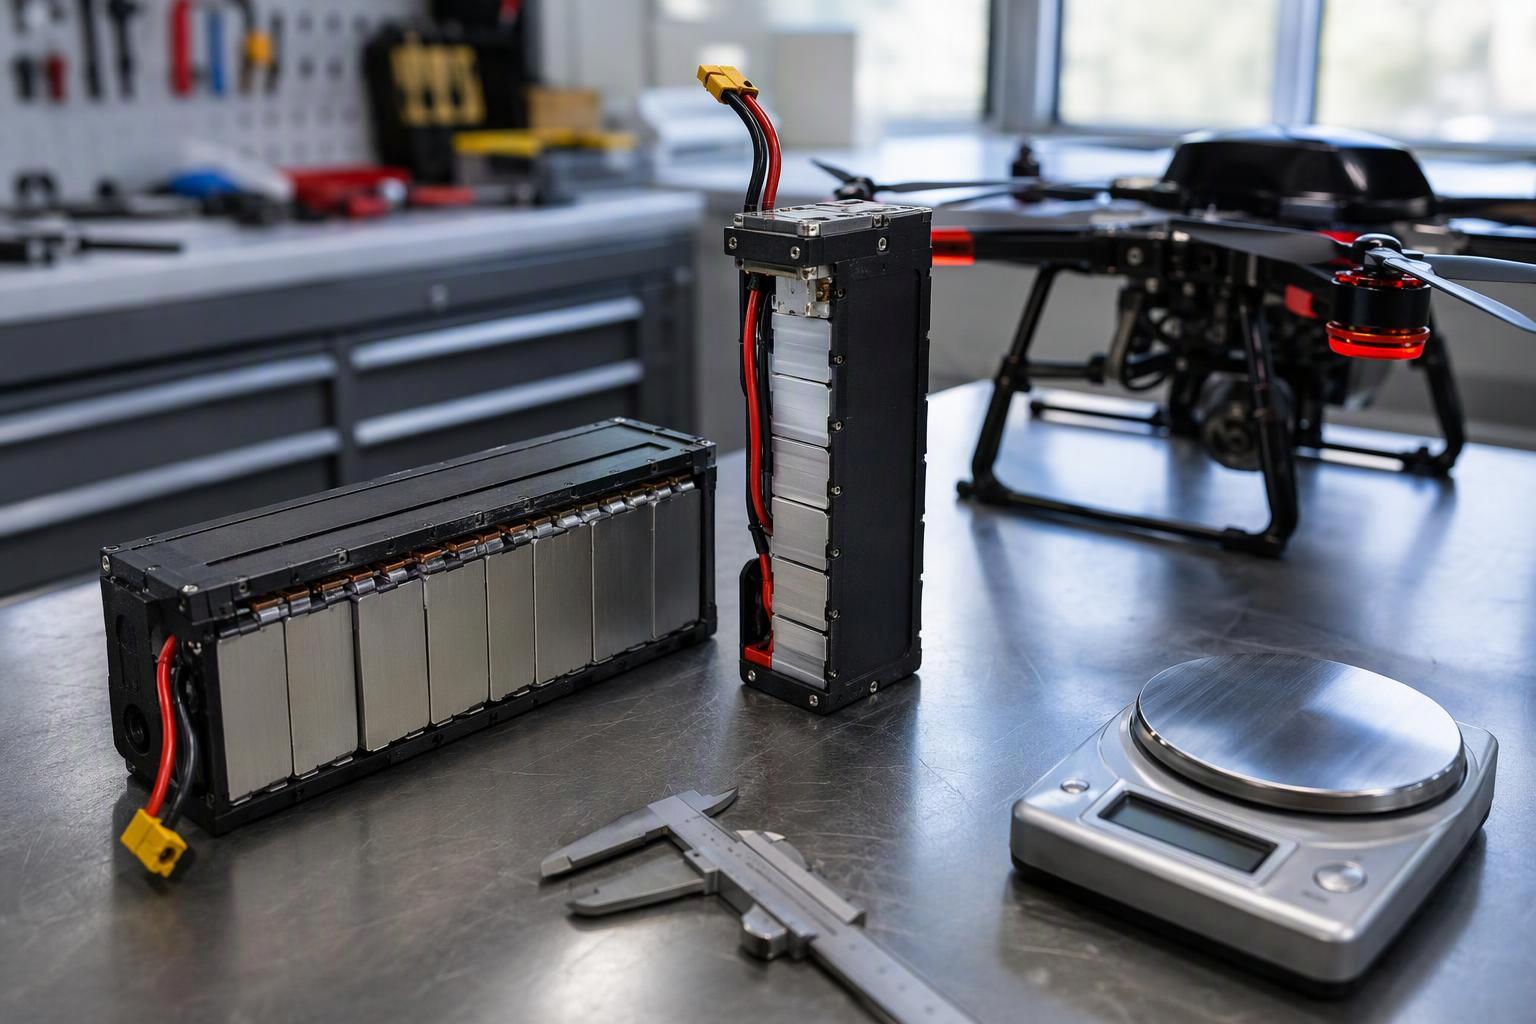
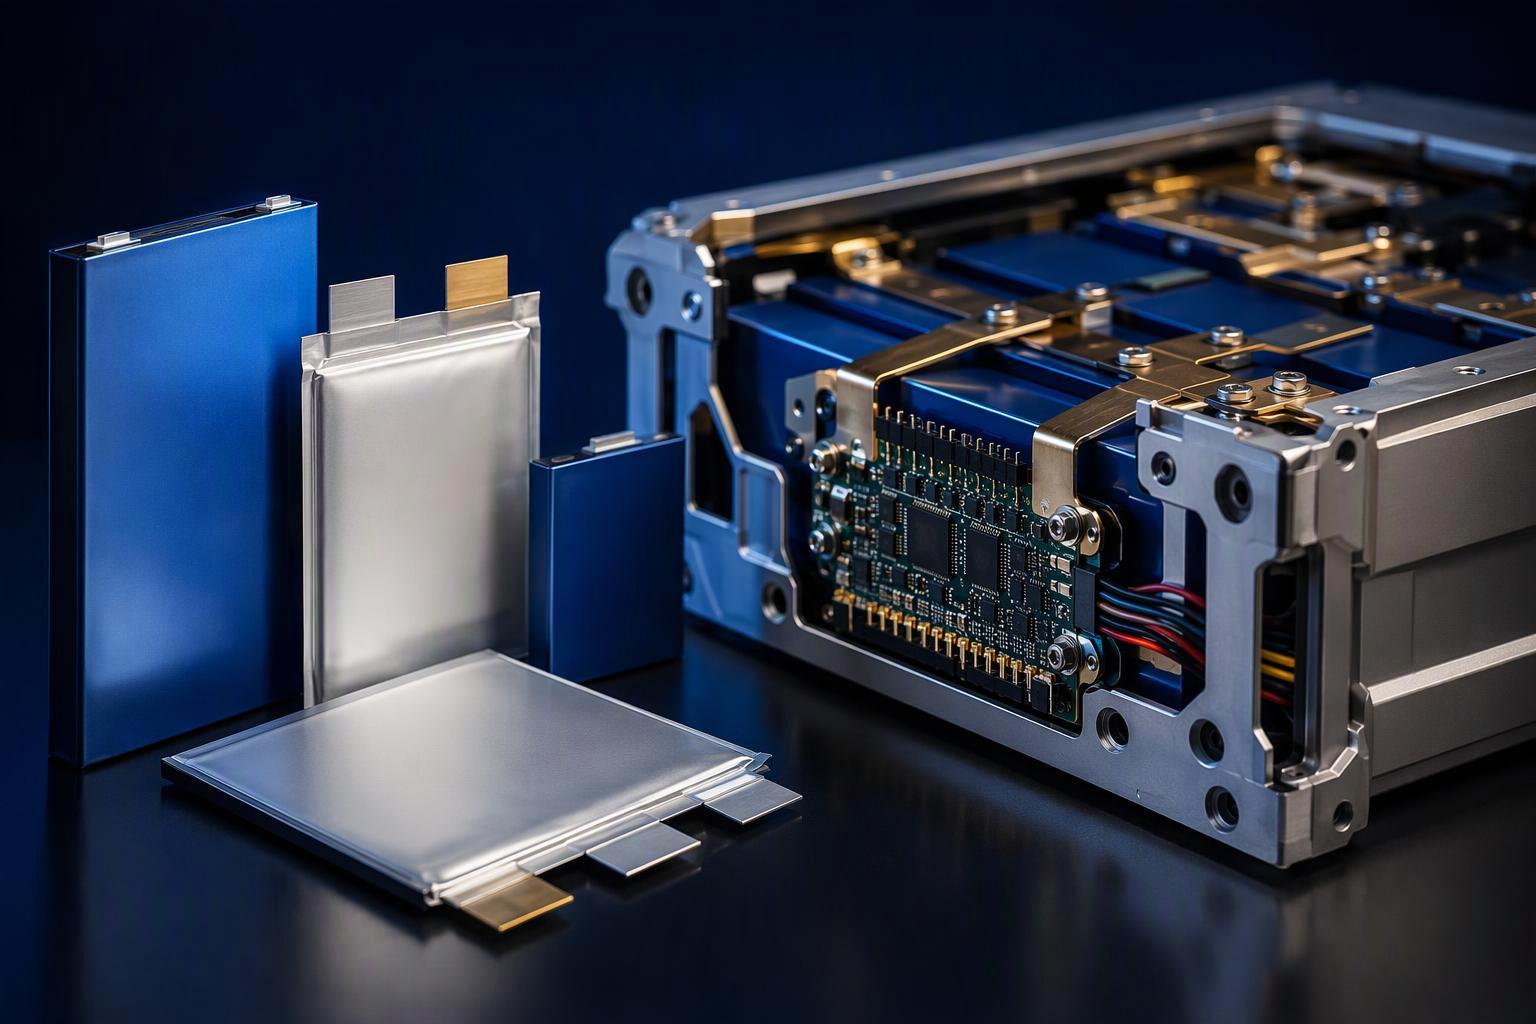
Pack mass is the cells plus everything that makes them a pack: battery management system, wiring, connectors, enclosure and thermal components. All of it rides on the aircraft, and none of it stores energy.
What matters to the aircraft is finished-pack Wh/kg — delivered watt-hours divided by the as-integrated pack mass — not the cell figure on a spec sheet. That is the number to put in front of your propulsion team when the airframe is mass-limited. Closing the gap between the two is not a datasheet exercise: it comes from tuning cell selection and pack architecture together — which is only possible when both layers sit under the same roof.
Capacity Is Not Enough: Check Power Capability
A pack can carry enough watt-hours and still be unsuitable, because continuous and peak current are different quantities with different time scales. Continuous current is the maximum sustainable without exceeding thermal limits; peak current covers short bursts, and repeated or extended peak loads should not be treated as continuous operation because thermal stress builds quickly. A pack qualified on a burst rating has not been qualified for a mission profile.
Loaded voltage is where an undersized power path shows up. Terminal voltage sags as current rises, and resistive heating grows with the square of that current, so a hard burst produces both a voltage drop and heat at the same time. The pack that carries enough watt-hours on paper can still dip below your cutoff voltage exactly when you need thrust.
This is also where usable energy diverges from nominal energy. Discharge current, temperature, voltage sag and cutoff settings all cut into how much of that stored energy you actually get to use in flight. The magnitude is mission-specific, so it belongs in a test at your operating temperature and state of charge rather than in a datasheet figure.
Choose the Battery Around the UAV, Not the Capacity Number
Selection runs in a fixed order, and capacity is not the first step. Start with the airframe: mass budget, payload, available pack volume, power profile and mission duration. Those five constraints, not the Ah label on a cell, decide which battery route is viable — and they map onto the table above, where each one points to a different lever.
The one step the table cannot settle is proof. Is the pack proven under your conditions? Ask suppliers to provide pack-level test data under conditions relevant to your mission profile, including discharge current, temperature, cutoff voltage and total pack mass. A “typical” cell figure is not evidence; a measured result at your operating temperature and state of charge is. That data also needs to be produced under recognized test conditions, because a nominal capacity rating alone does not qualify a pack for a specific UAV mission.
More capacity is not automatically better. The right choice depends on which constraint is actually limiting the aircraft: energy, mass, volume or power. If mass margin remains, adding capacity is a legitimate lever. If the airframe is mass-limited, pack-level and usable Wh/kg are the levers — and cell-level figures can materially overstate the energy density of the finished pack, as NASA’s X-57 case shows. If the pack sags under load, neither lever helps until the power path is fixed.
That is the whole decision in one line: find the binding constraint first, then pick the lever that relieves it.
For a custom UAV battery evaluation, the useful starting inputs are aircraft voltage, target flight time, power profile, battery mass limit and available pack space. Those parameters allow a supplier to evaluate the trade-off between capacity, pack-level energy density and power capability against the actual airframe.
For teams working through this trade-off, Herewin builds UAV battery packs around these same system constraints, from cell and configuration selection through pack validation. If you have a specific mission or application requirement, our technical team can help you evaluate how capacity, pack-level energy density and power capability play out on your airframe — get in touch with the Herewin engineering team.

 Français
 English
 Español
 한국어
 Deutsch
 日本語
 Русский
 Bahasa Indonesia
 ไทย
 العربية
 Português do Brasil
 Italiano
 Nederlands