











Industrial battery selection tends to break down in a familiar way. Teams optimize what looks best on the datasheet—nominal Wh/kg or a headline C-rating—then the mission fails on a system constraint: undervoltage cutoff, thermal rise, weak-cell divergence, or BMS limits. The outcome is typically the same: shorter-than-planned sorties, uneven power delivery, and a costly loop of re-testing and redesign.
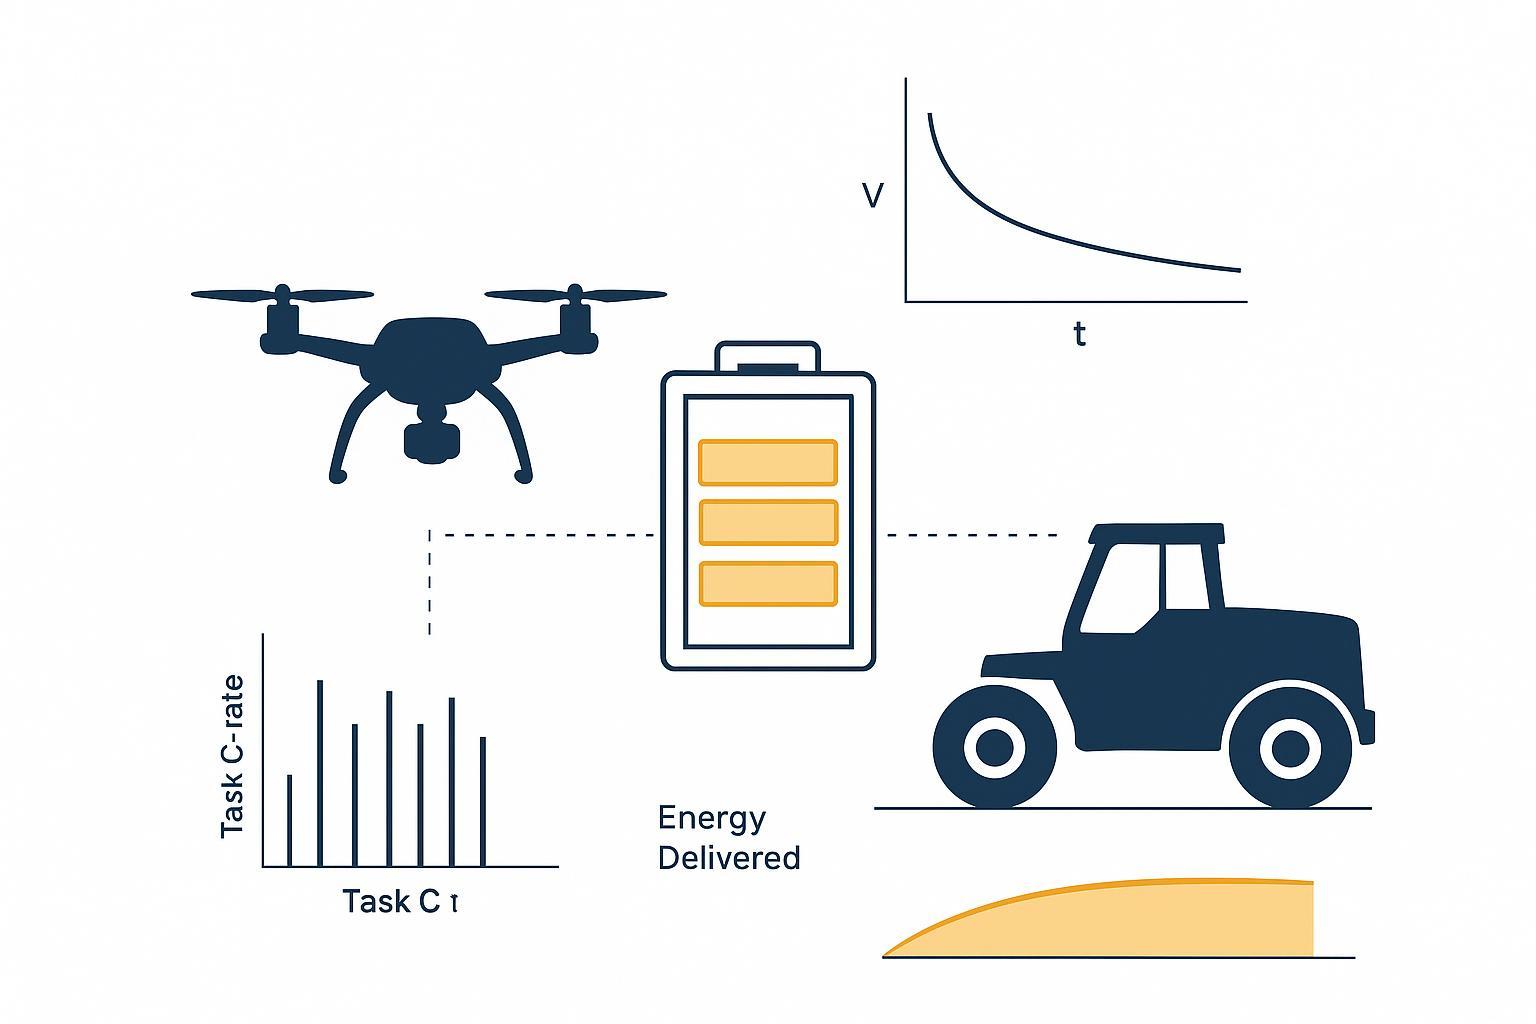
This guide reframes the decision around two mission-facing metrics—especially if you care about UAV battery energy density under real load rather than best-case lab numbers:
Task C-rate: what your mission actually demands (continuous + burst, duty cycle, temperature, cutoff logic)
Usable Wh/kg: what your system can actually deliver under that demand, not what the datasheet implies at gentle conditions
High C-Rate Reality: Failure Modes Under Dynamic Loads
If you’re evaluating high C-rate lithium battery performance, the key question isn’t what the pack can do once—it’s what it can deliver repeatedly without sag-driven cutoffs, thermal drift, and weak-cell divergence.
Dynamic Load Profiles: Why Duty Cycle Beats Nameplate Specs
In UAV and heavy-duty duty cycles, the current draw is not steady. You have high-power segments (takeoff/climb, gust recovery, acceleration, payload actuation) embedded in longer sustained segments (hover/cruise, steady traction).
A battery that looks sufficient at nominal conditions often fails on energy delivery under load: high current drives voltage sag (I·R) and losses/heating (I²R), so the system can hit a cutoff earlier than your energy model assumed.
The operational symptom is not “low capacity” in isolation. It’s sortie-to-sortie endurance variability.
Voltage Sag and Cutoff Risk: How to Validate the Margin
Voltage stability is a mission constraint.
When current spikes, the terminal voltage drops approximately as:
V_terminal ≈ V_OCV − I·R
The immediate implications are straightforward:
ESCs, motor controllers, and payload electronics see lower voltage headroom
under transient load, the pack can hit undervoltage protection even when the battery still contains energy
weak-cell behavior dominates: one cell sags first, and the pack has to follow
In practice, you should treat “voltage under worst transient” as a first-class requirement—because it is usually the real trigger for protection events and forced aborts.
If your acceptance test is “it flew once and didn’t overheat,” you are qualifying the battery for a demo—not for a fleet.
Nominal vs Usable Wh/kg: What to Measure Under Load
Nominal Wh/kg is typically derived from capacity × nominal voltage under standardized, relatively gentle conditions. That number is useful for catalog comparisons, but it is not a mission guarantee.
Those “gentle conditions” usually assume a controlled temperature, a relatively low and steady discharge rate, and a fixed voltage window that may not match how your powertrain enforces cutoffs under burst load. In other words, nominal Wh/kg is a baseline, but it doesn’t automatically tell you how much energy you can access when voltage sag, controller limits, and real duty cycles define the usable window.
The mission-relevant definition is delivered energy:
E_usable = ∫ V_terminal(t) · I(t) dt
BatteryDesign’s overview of usable energy frames the same problem: “nameplate” energy is not the same as what a system can use once you apply real operating windows and constraints.
When current is high, two things happen at once:
Average delivered voltage is lower (voltage sag)
You hit cutoff sooner (because the weakest cell reaches the limit first under load)
That is why an energy-density-first battery can be a poor choice for high C-rate missions: you paid for nominal energy you cannot reliably access.
The Two Metrics That Make Industrial Battery Selection Testable
Task C-rate: How to Turn a Mission Profile Into a Requirement
Treat task C-rate as a mission signature, not a single number.
Start with the normalized definition:
C_task(t) = I(t) / Q_nom
Then specify the mission requirement in a procurement-usable format:
Sustained task C-rate (continuous segment average)
Burst task C-rate (peak current events)
Burst duration and repetition (e.g., every 20–30 seconds)
Temperature band (cold starts and hot soak behavior)
Cutoff logic (minimum cell voltage under load, with recovery expectations)
The key is to separate “can it do the burst once” from “can it do the burst all day without power fade and drift.”
As an illustrative starting point for heavy-lift UAV profiles, teams often see a lower cruise band (sub‑1C) and a higher burst band (roughly 2–5C). This is a hypothetical example for illustration only—your logged mission trace and system limits must set the requirement.
To make this concrete, write your requirement as a phase-based profile (even a simple one is better than a single “max C”):
Phase | What to define |
|---|---|
Takeoff / climb | Burst C-rate, burst duration, repeatability, minimum loaded voltage |
Cruise / transit | Sustained C-rate, duration, thermal stability |
Hover / station-keeping | Sustained C-rate, temperature rise behavior |
Payload actuation / gust recovery | Burst C-rate, repetition rate, recovery expectations |
Landing / descent | Moderate C-rate, cutoff and recovery behavior |
If you have flight logs, convert each phase into peak current, average current, duration, repetition rate, and the minimum allowable loaded cell voltage for that phase.
Usable Wh/kg: How to Calculate It From Real Current Data
Define usable Wh/kg in a way a lab can reproduce and a buyer can audit.
Before you run the profile, lock the measurement window (SOC range and cutoff rules); as an illustrative example, many teams report usable Wh/kg from ~80% SOC down to ~20% SOC to keep results comparable.
Measure delivered energy under a representative mission profile:
Wh_delivered = (1/3600) · ∫ V(t) · I(t) dt
Normalize by mass:
usable Wh/kg = Wh_delivered / mass_kg
That number automatically captures:
voltage sag and recovery
cutoff behavior under transient load
rate-dependent usable capacity
temperature effects (if you test at relevant temperatures)
To keep results comparable across candidates and suppliers, define the test protocol explicitly:
Sampling and logging: log V(t) and I(t) at a consistent sampling rate that is fast enough to capture burst events
Repeatability: run the same profile multiple times after the pack reaches thermal steady-state and report both the average and the spread
Mass and auxiliary loads: use the as-integrated pack mass (including enclosure, harness, and BMS) and document any auxiliary power draw (e.g., BMS consumption) so usable Wh/kg reflects the energy your system can actually use
Balancing Energy Density with Peak C-rate
Engineering selection is not “pick the highest Wh/kg” or “pick the highest C-rating.” It’s managing the energy–power trade-off that is fundamental in lithium systems (see discussion of trade-offs in Chemistry Europe / Wiley (2022)).
A practical selection stance:
Utilisation nominal Wh/kg to shortlist architectures and chemistries.
Utilisation task C-rate + usable Wh/kg to pick what will actually meet the mission.
Engineering Implications of Usable Wh/kg
Maximizing Flight Endurance and Payload
In flight, the penalty of “energy you can’t access” shows up as:
reduced time at a given payload
reduced payload at a required time
more conservative reserve policies (because voltage collapse is harder to predict)
Usable Wh/kg is the metric that lets you quantify this without wishful thinking. If two candidates have similar nominal Wh/kg, the one with better usable Wh/kg under your task profile is the one that will deliver more consistent sortie completion.
Maintaining Voltage and Power Stability
Voltage stability is where usable Wh/kg becomes a reliability metric.
At high load, the system is usually sag-limited by internal resistance. Since:
sag ≈ I · R
heating ≈ I² · R
small differences in resistance (and, critically, resistance spread across cells) can create large differences in:
minimum cell voltage during bursts
thermal rise rate
how early undervoltage protection triggers
This is one reason to treat headline C-rating as a starting point and to evaluate DCIR and dynamic behavior under mission-like loads.
Reducing Mission Failure Risk
Usable Wh/kg is not only about “more minutes.” It reduces mission failure risk by making the weak-link constraints visible.
A simple risk chain often looks like:
high burst current → sag exceeds margin → minimum cell voltage crosses cutoff → flight controller/ESC protection triggers → forced return or abort
If you quantify usable Wh/kg under the task profile (including worst bursts), you are effectively quantifying reserve predictability.
Practical Battery Selection Guidelines for UAV and Industrial Systems
Pack-Level Integration Checks Before You Blame the Cell
Cell selection does not equal pack success. In a real UAV battery selection or industrial traction program, usable energy often disappears in the integration layer.
One common source of confusion is cell-level vs pack-level energy density. Even when a cell has strong nominal Wh/kg, the as-integrated pack typically delivers a lower usable Wh/kg because you add mass and constraints that don’t exist at cell level—interconnects, enclosure, potting/foam, harnessing, BMS electronics, and safety margins. On top of that, cell-to-cell spread (capacity and resistance dispersion) can force early cutoff under burst load: the weakest cell defines the pack.
Use this as an integration checklist:
Choose bus voltage to reduce current (same power, lower I → lower I²R loss and lower voltage sag). In high-power systems such as heavy-lift UAV propulsion, raising bus voltage is often the most direct way to protect voltage margin during bursts—because it reduces the current that drives both sag (I·R) and heating (I²R).
Verify wiring / connector / busbar resistance (these can dominate at high C-rate battery loads)
Validate the thermal path (hot spots raise DCIR and accelerate early cutoff)
Confirm BMS limits (current caps, balancing behavior, temperature cutoffs) match the mission
Check pack mechanics (compression, vibration, and layout can amplify weak-cell divergence)
In heavy-lift applications, a consistent pattern shows up: reduce current where possible via system voltage, then validate sag and thermal behavior with real telemetry.
DCIR Monitoring to Predict Lifecycle Performance
If your mission is sag-limited, DCIR is an early-warning metric.
The simplest test definition is a pulse test:
DCIR = ΔV / ΔI under a defined SOC, temperature, and pulse duration.
Neware’s primer on DCIR testing principles and methods highlights why DCIR matters: it directly impacts energy efficiency, discharge capability, and service life.
What to do with DCIR in procurement and operations:
specify the test conditions (SOC, temperature, pulse length, rest time) so numbers are comparable
track DCIR trend over life, not just a single value (e.g., periodic DCIR-vs-cycle checks using the same pulse definition)
request/measure DCIR distribution across cells in a lot (spread predicts weak-cell emergence)
request DCIR-vs-cycle traces (not just a single “beginning-of-life” number) under the same defined pulse method and temperature, so you can forecast when a pack will become sag-limited and usable Wh/kg will fall below your mission requirement
For fleets, define a standardized “signature segment” (worst dispatch moment) and track minimum loaded voltage + recovery voltage + DCIR. That trio catches degradation earlier than capacity checks alone.
Validate in Three Layers: Lab → Pack → Field
Think of this as industrial drone pack-level testing: you’re validating the cell, the pack integration, and the real vehicle control stack as one system.
A defensible workflow for an industrial battery selection guide uses three layers. Each layer should produce a small set of pass/fail metrics you can reuse lot-to-lot.
Layer | What to do | What to record |
|---|---|---|
Lab | Run a mission-profile discharge across your temperature band; perform DCIR pulse tests at defined SOC | Minimum loaded voltage on worst burst, recovery voltage, temperature rise, DCIR under defined conditions |
Pack | Validate the integrated stack (battery + controller + representative load) | Which limit trips first (voltage/current/temp), and why |
Field | Fly/drive with telemetry under worst-case bursts | Current, pack voltage, temperature, and per-cell voltage when available |
This acceptance-testing framing is consistent with fleet reliability work: use a worst-case signature segment and gate batch mixing with controlled sag/recovery and resistance checks.
Case Study: Selecting the Optimal Battery
Comparing Candidate Cells Using Usable Wh/kg
This example is illustrative (hypothetical) and is intended to show the decision logic, not to represent a specific product. Any “Candidate A/B” language (and any example values, if used) should be treated as placeholders for your own test results, not as supplier-verified performance data.
Assume two candidate cells (A and B) have similar nominal Wh/kg on paper. To avoid false confidence, run the same profile at the temperatures you actually operate in (cold/nominal/hot) and compare the A/B results separately—because the winner at room temperature can lose under cold-start sag or hot-soak limits. The mission profile includes:
a sustained segment (cruise/traction)
repeated burst events (takeoff/climb or acceleration)
a defined minimum cell-voltage cutoff under load
Example assumptions table (copy/paste for tests and RFQs)
What you must define | Symbol | What to record (no numbers here) | How it’s used |
|---|---|---|---|
Nominal capacity | Q_nom (Ah) | Nameplate Ah at stated conditions | Normalizes current into task C-rate |
Nominal voltage | V_nom (V) | Chemistry nominal voltage | Baseline for spec-sheet comparison only |
Pack mass | m (kg) | Mass of the tested pack (as-integrated) | Converts delivered Wh into usable Wh/kg |
Mission current trace | I(t) | Flight/drive log, dyno profile, or programmed load | Defines task C-rate across sustained + burst segments |
Loaded cutoff rule | V_cell,min,load | Minimum cell voltage under load + dwell time | Determines early termination under voltage sag |
Temperature envelope | T | Test points (cold/nominal/hot) and stabilization method | Captures DCIR and usable capacity shifts |
DCIR test method | DCIR | Pulse size, pulse length, SOC, rest time | Explains sag drivers and lot-to-lot comparability |
Delivered energy | E_usable | ∫V_terminal(t)·I(t)dt with sampling rate | The input to usable Wh/kg calculation |
Compute (make this auditable by logging the raw signals and test conditions):
Wh_delivered = (1/3600) · ∫ V_terminal(t)·I(t) dt
usable Wh/kg = Wh_delivered / m
Then map those results back to procurement language:
task C-rate = sustained C + burst C + burst duration + repetition rate + temperature band + loaded cutoff rule
Now compare candidates under the same profile using a small, RFQ-friendly set of recorded signals:
Decision gate | What to compare under the same task profile | Why it matters |
|---|---|---|
Worst-burst loaded voltage | Minimum loaded cell voltage during the worst burst | Predicts protection events and power fade |
Recovery behavior | Voltage recovery after the burst (and the time to recover) | Indicates resistance growth and usable window stability |
Delivered energy | Wh_delivered over the defined SOC window | Determines usable Wh/kg directly |
Thermal rise | Temperature rise rate in sustained segments | Predicts derating needs and life impact |
Lot consistency | Spread across samples (not just the mean) | Weak-link risk scales with dispersion |
Candidate A typically fails when it sags more and reaches cutoff earlier. Candidate B typically wins when it sags less, recovers better, and delivers more energy under the same protection constraints—even if nominal Wh/kg looked similar on paper.
Lab and Field Validation Results
In a real program, you would validate “A vs B” with results that are hard to argue with:
minimum loaded cell voltage during worst burst segment
recovery voltage after burst
temperature rise per minute in the sustained segment
DCIR trend after conditioning cycles
dispersion across a lot (how many outliers you must quarantine)
If the winner only “wins” at 25°C in the lab but collapses in cold-start conditions, it is not a fleet-ready choice.
Selection Conclusion
In this illustrative decision, the optimal battery is the one with:
adequate burst power and predictable sustained behavior
higher usable Wh/kg under the task profile
lower variability across cells and packs (less weak-link behavior)
That is the battery that will reduce aborted missions and procurement rework.
Selection Principles and Supplier Value
Core Selection Guidelines
Use these principles to turn selection into a repeatable process:
Define a task C-rate profile (continuous + burst + duty cycle + temperature + cutoff logic).
Compare candidates on usable Wh/kg under that profile, not nominal Wh/kg.
Gate on sag and recovery at the worst dispatch moment.
Require evidence packs: test conditions, batch statistics (not only averages), and traceability.
Ensuring Reliability and Environmental Adaptability
For UAV and heavy-duty systems, derating is not pessimism—it is engineering.
Cold increases resistance and sag; hot accelerates aging.
Aging shifts the same pack from “energy-limited” to “sag-limited.”
Your selection should explicitly include:
temperature-band validation
lifecycle expectations and retirement/derating thresholds
operational SOPs (storage SOC windows, cooldown time, inspection checks)
Demonstrating Supplier Expertise and Support
In industrial programs, supplier value is not “a battery.” It is the ability to reduce engineering uncertainty.
For engineering support and test validation, Herewin positions itself as an ODM/OEM battery partner with vertically integrated manufacturing and documentation support for industrial deployments. In practice, the supplier support that matters most for this decision looks like:
helping you define the task C-rate and signature segment
providing lot-level consistency evidence (capacity + resistance distribution)
supporting pack integration constraints (BMS limits, thermal path, wiring)
managing change control so re-testing risk is minimized
If you want to make this selection auditable, compile your mission profile (current vs time, worst bursts, temperature envelope, cutoff rules) and request a validation checklist that maps directly to those constraints. If you’d like our engineers to review your profile and recommend a test plan, contact Herewin.



 Français
  English
  Español
  한국어
한국어  Deutsch
  日本語
日本語  Русский
  Bahasa Indonesia
  ไทย
ไทย  العربية
  Português do Brasil
  Italiano
  Nederlands