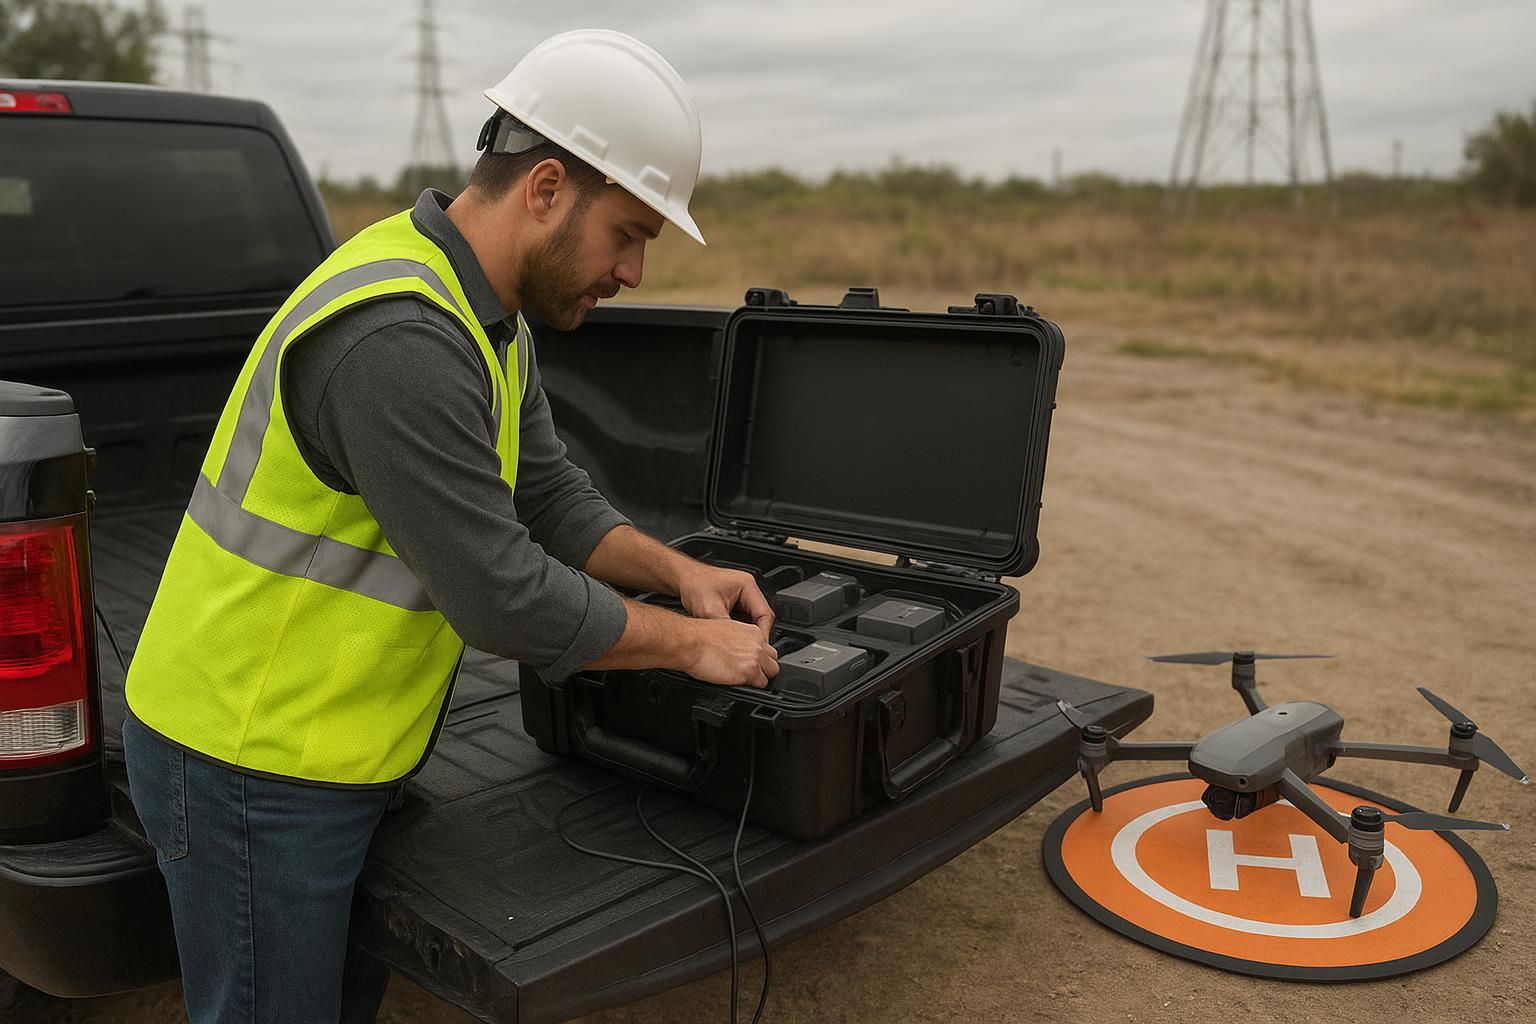


In high-stakes agricultural drone operations, reliable power is critical for mission success and cost control. In 35–40°C (95–104°F) fields, battery performance affects cost through two coupled mechanisms: thermal derating that limits daily throughput, and transient voltage instability that can degrade control precision under dynamic spray loads. The first typically dominates cost-per-hectare; the second can increase the risk of VRA inconsistency when loads change fast.
This guide presents a 2026 evaluation framework for agricultural drone batteries, focusing on three pillars:
Operational Precision – Benchmarks for Internal Resistance (IR) and voltage sag to support VRA consistency.
Throughput Optimization – Hot-weather charging SOPs and swap cadence to minimize idle time.
Asset Lifecycle Strategy – High-precision SOC/SOH monitoring to reduce premature RTH and extend fleet ROI.
These validated Method Targets help fleet managers implement effective procurement and maintenance practices under demanding conditions.
Agricultural Drone Batteries and the Real Cost of Power Instability
If your agricultural drone battery can’t hold voltage in 35–40°C field heat, you pay for it twice: once in downtime, and again in re‑sprays. In most hot-climate fleets, throughput loss from heat (derating, cooling holds, early RTH) is the primary cost driver. Voltage instability is usually a secondary mechanism, but it can still reduce control headroom under fast load changes—raising the odds of flow/pressure tracking error and, in turn, re‑sprays.
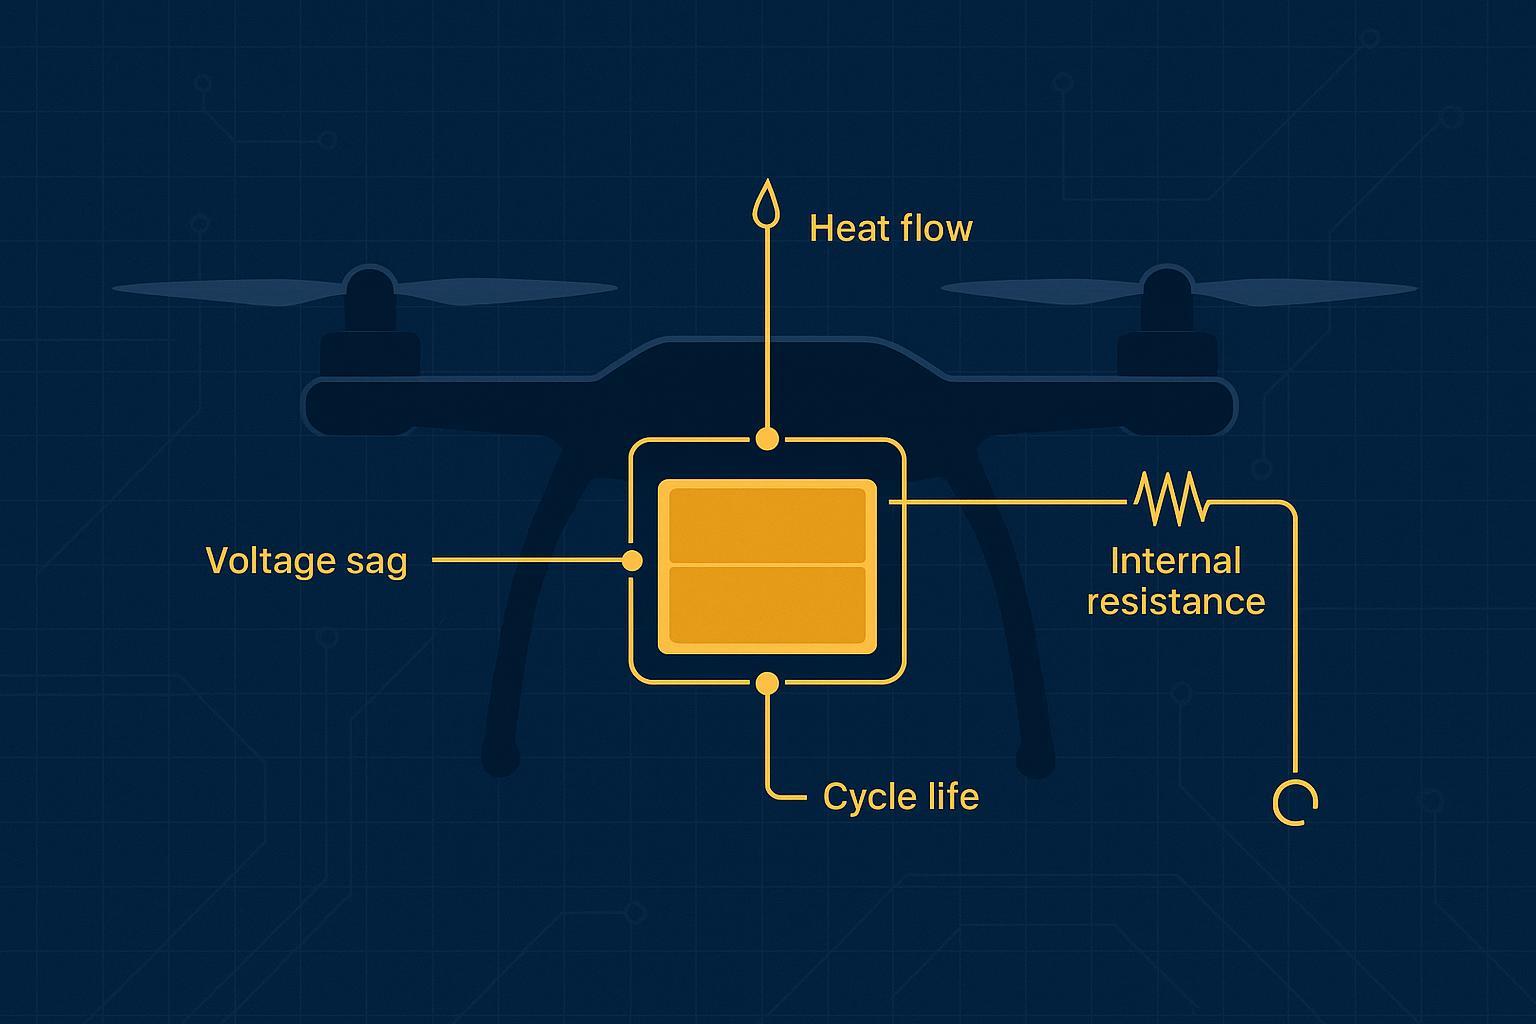
What’s happening inside the pack is straightforward. When current demand spikes, internal resistance causes a voltage drop and extra heat. As cells age—or simply run hotter—effective resistance rises, so sag gets worse and temperatures climb faster. Your pump and flight controllers then spend the whole sortie “chasing stability,” and uniformity suffers.
Voltage Instability and VRA Accuracy
In precision agriculture, the power system is the “silent driver” of the spray controller. Under dynamic loads, a BLDC pump’s RPM and its associated control loops are highly sensitive to supply fluctuations. Stable bus voltage is not just a safety requirement; it is a prerequisite for Variable Rate Application (VRA) precision.
When voltage fluctuates, the gap between commanded flow and actual field delivery widens. Recent 2025 research on variable spraying control confirms that actuator stability—and by extension, the reliability of the power rail—is the deciding factor in maintaining tight tracking across changing mission profiles.
Engineering Benchmarks for VRA Protection
The following targets serve as bench-backed guidance to be validated against your platform’s pump tolerance. These are grounded in established electrochemical laws where:
Voltage Sag scales with I x R (Current x Resistance)
Thermal Load scales with I2 x R (Current2 x Resistance)
Metric (Internal Fleet Indicator) | 2026 Working Target (Platform Validation) | Why it matters to cost/ha |
|---|---|---|
Bus voltage stability under steady spray | Within ±5–10% of nominal | Keeps pump pressure/flow from drifting and triggering re‑sprays |
Load‑step recovery time (pump on/off) | < 30 s to return near nominal | Slow recovery is an early sign of rising resistance and heat stress |
SOC display accuracy | ≈ ±3% as a method goal | Reduces over‑conservative return‑to‑home buffers and wasted usable energy |
Cooling/hold time per cycle in hot ambient | < 5–6 min (operational goal) | Avoids losing sorties to forced cool‑downs |
To bridge the gap between electrochemical boundaries and VRA control logic, engineering teams should implement high-fidelity impedance profiling and real-time discharge telemetry. By mapping power-rail stability against actuator response, operators can ensure consistent spray pressure even during peak transient loads. This data-driven integration is essential for optimizing the feedback loops that govern precision variable-rate applications.
Operational Windows and Downtime Impact
Hot-ambient sorties narrow the safe charging and operating windows. In most industrial BMS designs, thermal derating or protection is typically triggered as cell temperatures approach ~55°C. This threshold effectively defines the upper boundary of usable throughput in hot-climate operations, as approaching it will induce current limiting, forced cooling delays, or premature return-to-home events.
While many OEM documents allow discharge up to 60°C, practical operating margins are tighter in real deployments. For high-payload systems, charging windows typically narrow to roughly 5–40°C (41–104°F) to preserve cell stability. For context, the DJI T-series (DB1560 system) specifies this 5–40°C range on official maintenance pages; pushing packs to charge above this window induces safety derates or forced cooling time—idle minutes that directly reduce hectares per day.
Quantifying the Downtime Impact:
Excessive battery heat directly translates into operational “thermal idle.” According to field simulations, if forced cool-down adds just 6 minutes per cycle over 28 sorties/day, the cumulative loss is 168 minutes.
In a typical 55-minute mission cycle, this equates to 3 lost sorties per day—often the critical margin between finishing a block within the daylight window or incurring the added mobilization costs of a make-up day.
From Battery Failure to Yield Loss: A TCO Analysis
Unstable power doesn’t just damage hardware; it erodes the Total Cost of Ownership (TCO). To quantify this, we modeled a typical large-scale operation under the following field assumptions:
Fleet Profile: 12 drones, 70L payload, VRA mapping.
Operational Baseline: 22 sorties/day per drone; 18 hectares/sortie.
Cost Drivers: $120/hr labor (3-person unit); $4/ha chemical/water mix cost.
The Impact of Power Instability (Modeled Results)
When batteries suffer from mid-sortie voltage sag and high-temperature derates, the financial bleed occurs in two areas:
1. The Cost of Re-application (Voltage Sag) If 1 in 6 sorties experiences pressure under-delivery due to bus sag—forcing a 5-hectare re-spray—the operation loses ~18 hectares/day to redundant work. This is not just wasted time; it is wasted chemical and daylight.
2. The Cost of Idle Time (Thermal Derates) Adding just 3 minutes of forced cooling per sortie results in 66 minutes lost per drone/day. Across a 12-drone fleet, this equates to ~13 lost sorties daily—the equivalent of losing an entire drone’s productivity.
Financial Summary (Per Drone/Day)
Idle Labor/Overhead: ~$145 loss.
Wasted Chemicals: ~$72 loss.
Bottom Line: Total per-hectare cost rises by 15–25%, depending on the contract price.
Note: These figures are based on specific field scenarios; we recommend validating these against your own fleet telemetry and local chemical costs.
Precision Power for VRA Operations
In a precision agriculture drone battery system, voltage stability under combined flight + pump transients is what protects spray consistency and keeps “hidden” re‑spray costs from creeping into your day.
Dynamic Load: Flight and Spray Coupling
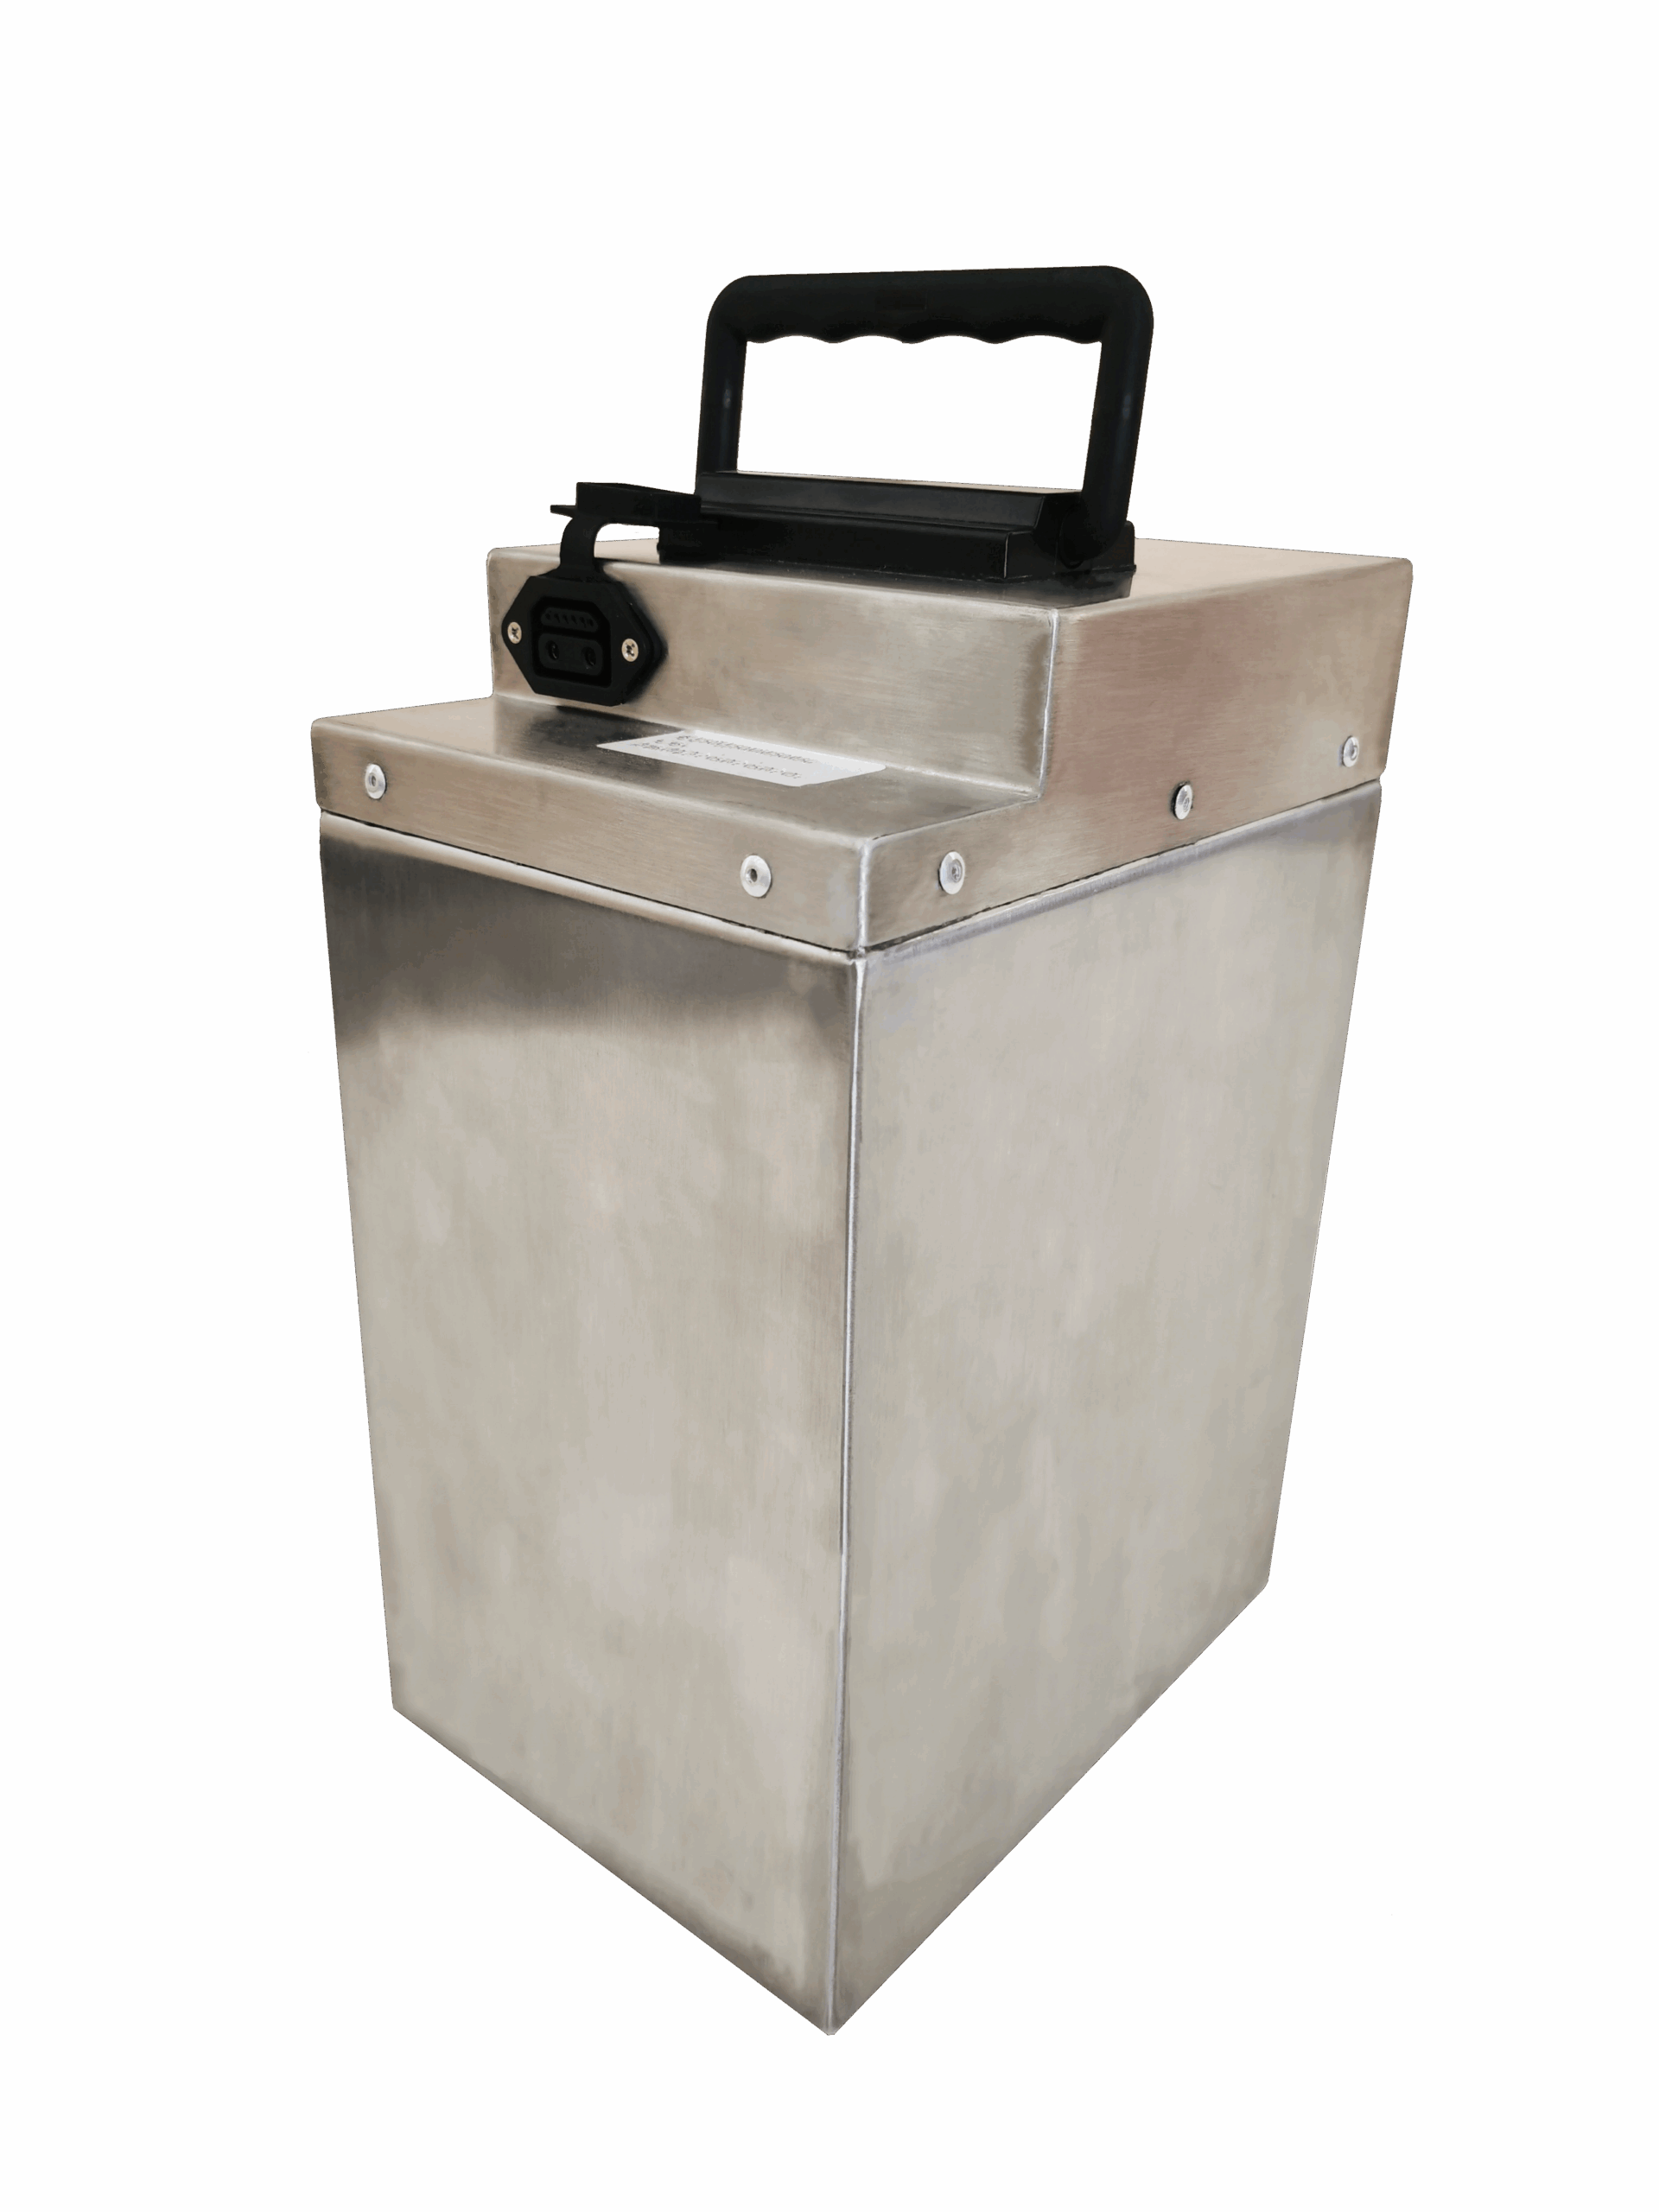
Your power bus feeds both the flight stack and the spray system. When pitch increases or wind gusts hit, the propulsion current spikes just as the pump controller issues corrections to hold flow. If the pack’s internal resistance is high, transient droop stacks and the pump’s pressure error grows. Practically, you want low‑IR packs rated for continuous discharge in the 10–30 C band for your capacity class, with thermal behavior characterized at 25–30°C and method‑projected to 35–40°C.
Peer‑reviewed work supports the core equations and trends: voltage droop scales with I×R; heating with I²R; and IR rises with temperature and state of health. For a quantitative framing of high‑rate behavior, see representative studies in Journal of Power Sources and Applied Energy that map sag and heat rise at multi‑C rates.
Stable Discharge for Consistent Output
Method targets you can adapt and verify on your platform:
Keep pump-on bus voltage within ±5–10% of nominal during steady spray at your target flow/pressure, verified under representative mission current and hot-ambient conditions.
Track “recovery to nominal” after pump off/on transients; rising lag over the season is an early SOH warning.
Specify or test for DCIR bands (fresh cells often 1–5 mΩ per pouch cell; aged/overheated units can drift to 10–50 mΩ). Use EIS or pulse methods for periodic fleet screening.
For a deeper operational explainer on energy density, internal resistance, and sag trade‑offs in UAV‑class packs, see the practitioner overview in high energy density UAV batteries for industrial drones.
BMS Response Under Real‑Time Load
Accurate SOC lowers “just‑in‑case” reserves on return‑to‑home and reduces surprise derates. A practical goal is to tune and verify SOC display error to within about ±3% using a combined coulomb‑count + voltage compensation algorithm, with regular user‑level calibration. Treat ±3% as a method target to validate on your hardware.
Operator routine (field‑safe): every ~20 cycles, run one controlled full charge → mission discharge → full charge, then compare displayed SOC to measured energy. If the gap exceeds ~5–8%, increase calibration frequency or flag the pack for evaluation. Better SOC discipline translates into fewer premature returns, more productive spray minutes, and tighter swap rhythm.
For context on a system that implements tight SOC targets and remote monitoring, see our resources on BMS calibration and fleet telemetry (use as a method reference; verify on your own platform).
Maximizing Field Throughput (Hectares/Day)
Throughput comes from repeatable turnaround. While any battery can perform in mild conditions, the true test of fleet ROI occurs at the “thermal limit.” We utilize the Mato Grosso corridor in Brazil as a representative reference for extreme hot-climate UAV operations—where ambient temperatures of 35–40°C (95–104°F) force standard power systems into severe thermal de-rates.
If a pack’s heat and sag force even a few extra minutes per cycle, sorties per day drop, and your cost per hectare rises—even if the battery spec sheet looks impressive on paper.
Energy Density vs Operational Efficiency
High Wh/kg helps, but the KPI is hectares/day, not grams saved on a spec sheet. Two levers often dominate:
Swap frequency: fewer swaps per hectare reduce ground time, but only if packs avoid thermal derates in the hot zone.
Power stability: stable discharge avoids mid‑sortie pressure dips and re‑applications.
A simple swap math sketch: if a 2.2 kWh pack supports 16–18 minutes spray‑on‑target with a 70 L payload, and you can keep turn time at 4–5 minutes (land, swap, relaunch) without thermal holds, you’ll clear ~7–8 sorties in a 90‑minute window per drone. Add 6 minutes of cooling per cycle and your sorties collapse by ~20–25% in the same window. Throughput is logistics plus thermals.
Reducing Swap Frequency in High‑Cycle Missions
Turnaround SOPs that protect life and stability while keeping cadence:
Stage under shade; avoid initiating charge above ~40°C cell temperature.
In hot ambient conditions (≥35°C), apply a staged charging strategy: use ~1–2C charging when thermal conditions are controlled, and derate toward ~0.5–1C as pack temperature approaches upper limits (~40°C), unless active cooling or validated fast-charge systems are in place.
Label rotation sets; use anti‑spark connectors and foam cradles to prevent micro‑damage that raises IR.
Size generators/chargers for your sorties/hour reality. As a planning method, continuous kW ≈ (packs Wh × average C‑rate per channel × active channels)/efficiency. Three‑drone hubs with ~2 kWh packs at ~3.5 swaps/h often need 25–35 kW continuous.
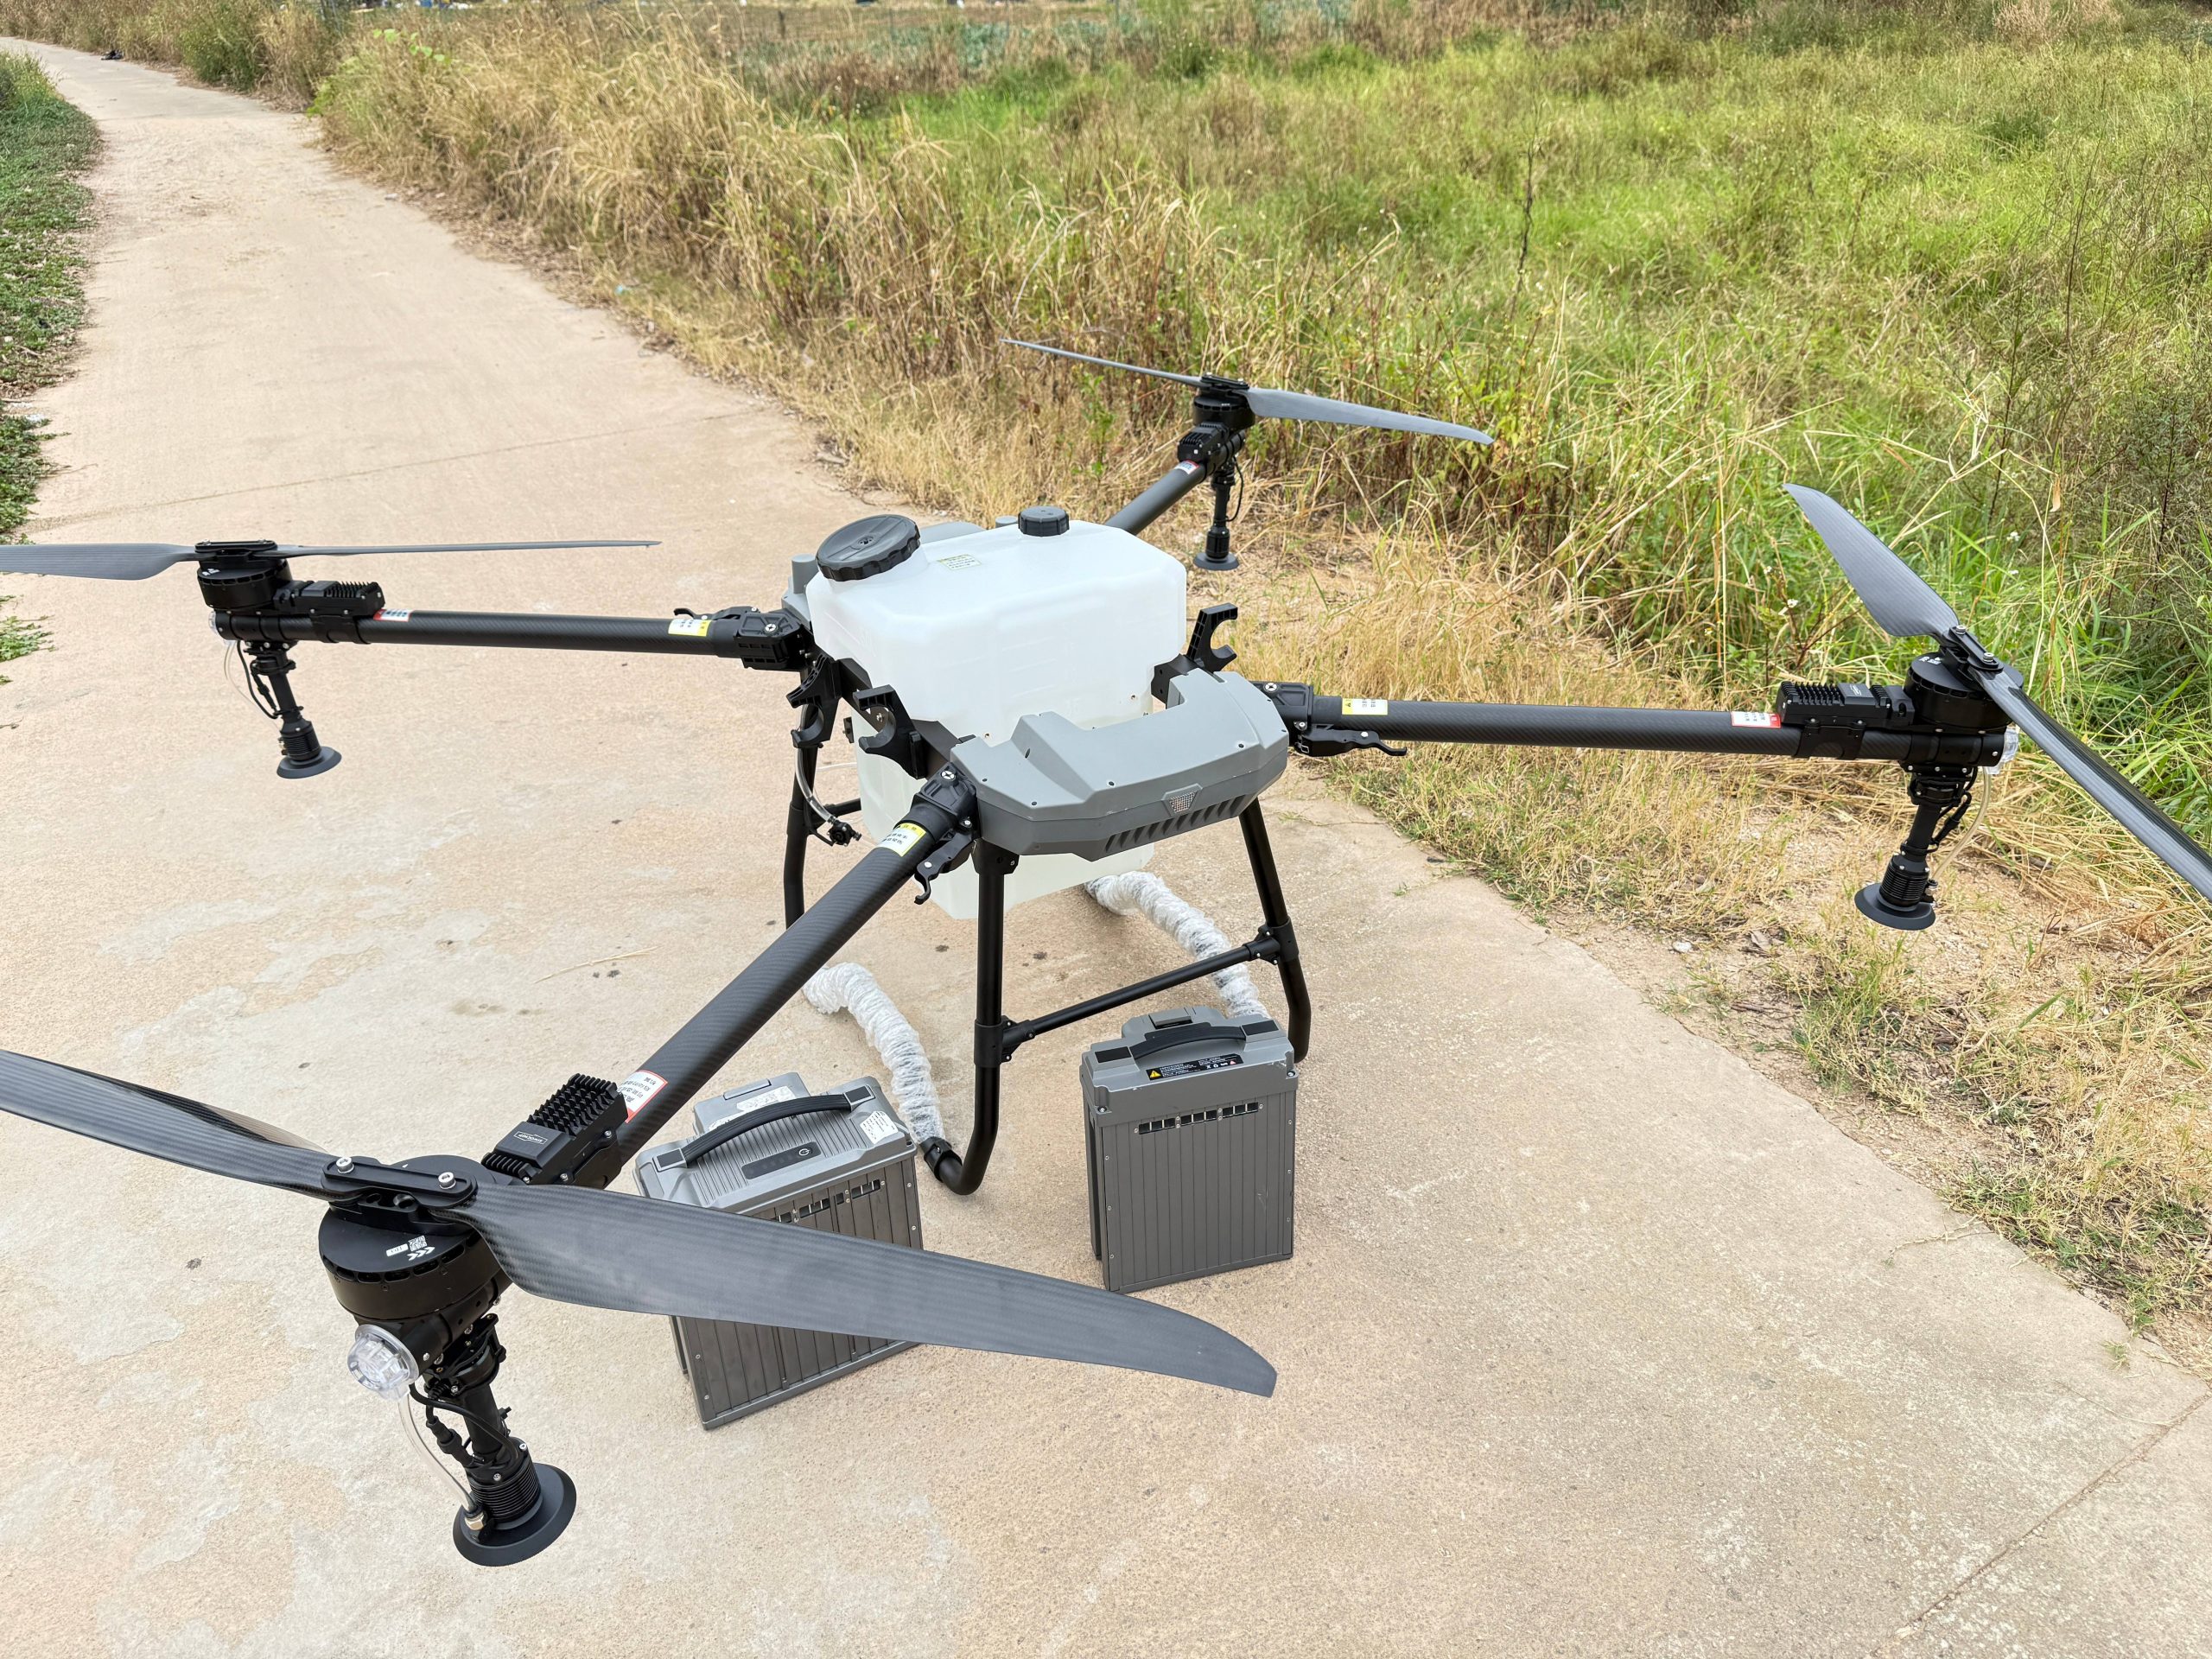
High‑Frequency Operation Under Heavy Payload (50–100 L)
Heavy tanks tighten margins. Expect higher average current and larger transients during climb‑outs and turns. Build acceptance tests that include: full‑payload takeoff to 10 m AGL, immediate spray‑on ramp, 90‑second constant‑flow leg, and a 180° turn, while logging bus voltage, current, and cell delta. Packs that hold within your ±5–10% band and recover quickly are your “A set” for VRA.
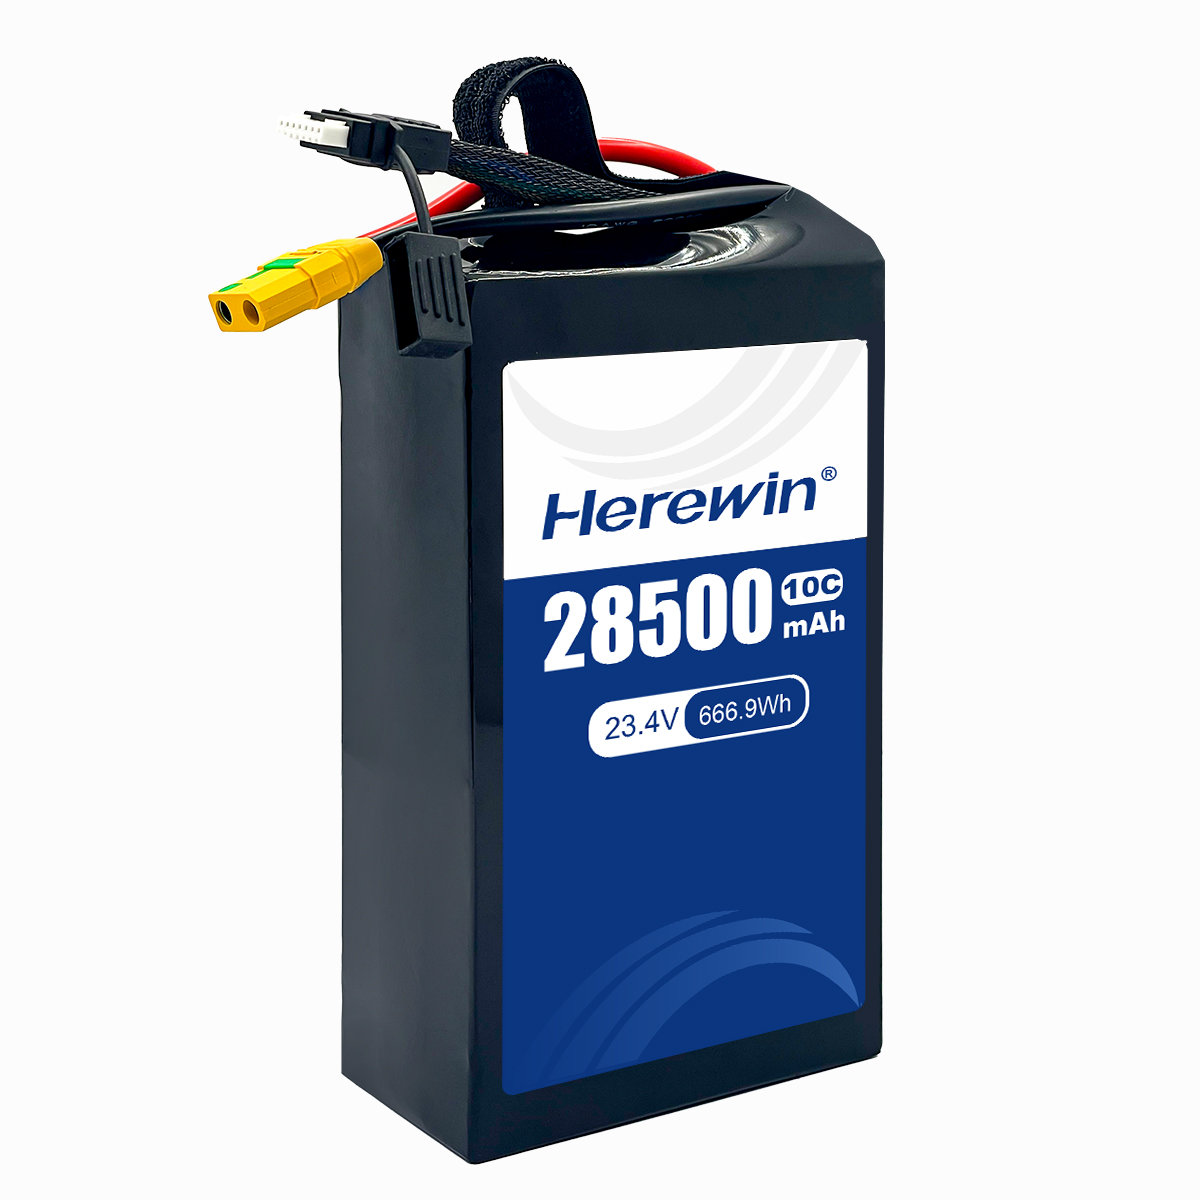
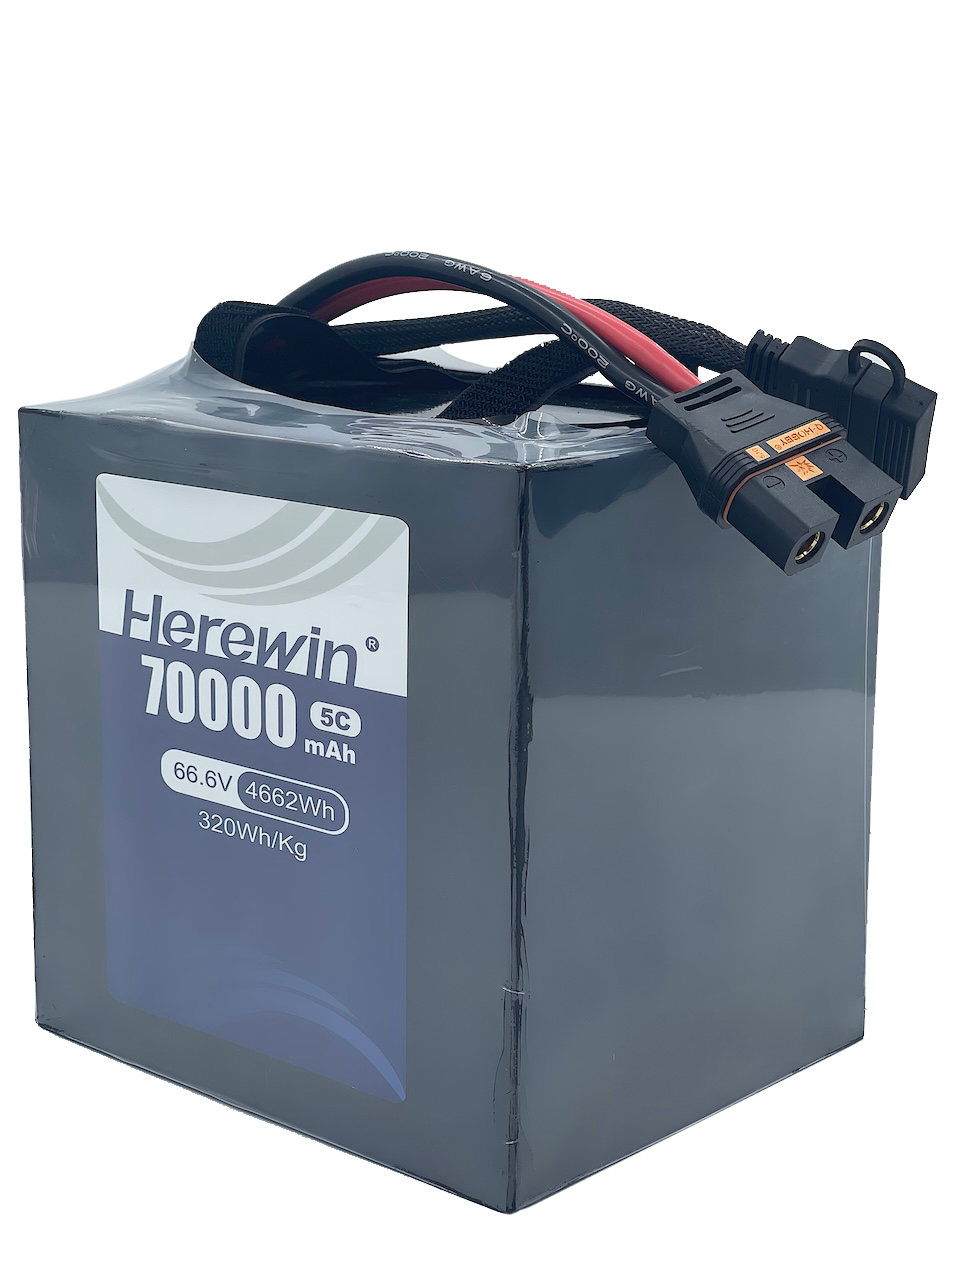
Semi-Solid Technology: The 2026 Performance Standard
Semi-solid architectures are designed to lower internal resistance, stabilize the SEI, and improve abuse tolerance—critical attributes for maintaining voltage in 35–40°C operations.
Modern architectures—specifically those incorporating Alumina-coated solid electrolyte films—inherently stabilize the SEI, reducing the internal resistance (IR) climb that typically plagues liquid cells in high heat. For a deeper technical analysis of these trade-offs, refer to these industry engineering guides:
Semi‑solid batteries for next‑gen drones: An operational explainer
Semi‑solid vs Traditional Lithium: A comparative performance study
Through internal R&D and bench-backed modeling, we have integrated Alumina-coated films into our high-capacity semi-solid series. This architecture is designed to reduce thermal-driven IR climb, helping maintain voltage drop within an estimated ±5–10% stability band during max-payload VRA transients. Internal stress tests suggest these packs may recover faster than generic industrial alternatives, potentially mitigating “thermal idle” losses observed under similar conditions. Readers should validate performance on their own fleets.
Validation Tip: Treat all published Wh/kg and thermal claims as method targets to be validated at the pack level in your own rig using the “A-Set” testing protocol described above.
Hot-Climate Operational Baseline (Brazil Reference Conditions)
In high-stakes agricultural operations, a “weather-resistant” battery is less about laboratory IP ratings and more about predictable performance under sustained 40°C heat, tropical downpours, and exposure to corrosive agrochemical mists.
A hot-climate operational baseline is best anchored in Brazilian agricultural conditions, where sustained 35–40°C (95–104°F) ambient temperatures, high humidity, and intensive spray cycles represent one of the most demanding real-world environments for UAV power systems.
This is not a formal certification standard; the targets below are intended as practical guidelines for structuring procurement testing and field SOPs. Validate them on your own aircraft, mission current, and charging setup.
1. Thermal Resilience in Sustained Heat
Operating in Brazilian field conditions requires planning for sustained 35–40°C ambient temperatures. While many cells allow discharge up to 60°C, the practical constraint is the charging window—which typically tightens to a strict 5–40°C (41–104°F) band under field conditions.
To sustain operations under these conditions, packs should minimize heat generation through low-internal-resistance (IR) chemistry. This helps avoid thermal derating, forced cooling delays, and premature return-to-home events that interrupt daylight mission windows.
2. Sealing: Managing Condensation vs. Rain
In tropical agricultural regions such as Brazil, sudden rainfall combined with high humidity creates pressure cycles that standard IP ratings do not fully capture. Internal condensation after rain events is often a greater risk than direct water ingress.
Field-ready packs benefit from precision gasketing and controlled “breathing” paths that allow pressure equalization without drawing moisture or agrochemical mists into the enclosure.
Recommended Field Protocol:
Implement a 24-hour post-rain inspection cycle, including:
Weight verification (to detect moisture ingress)
Vent integrity checks
Connector and terminal corrosion inspection
3. Agrochemical Corrosion Resistance
Large-scale Brazilian operations frequently involve intensive use of fertilizers and agrochemicals, often applied under high-temperature conditions that accelerate chemical reactivity.
Atomized chemicals can attack exposed metals, seals, and polymers over time. Hardware designed for these environments typically emphasizes anodized or coated components, along with sealed connectors engineered to tolerate repeated exposure.
Predictive Maintenance Tip:
Log connector resistance over time as part of routine fleet diagnostics. A gradual increase in contact resistance can serve as an early indicator of corrosion buildup, which may contribute to voltage drops and reduced VRA pump stability under load.
Case Study: Large‑Scale Soybean Operations (Modeled Example)
This is a modeled, bench‑backed demonstration scenario—not a published customer dataset. It illustrates how a consistent workflow—beginning with pack screening, followed by controlled hot‑ambient charging, and concluding with SOC verification—can reduce re‑sprays and minimize battery-driven idle time without altering aircraft operations.
Directional results from this workflow indicate roughly a 20% reduction in re‑spray hectares and a 15% decrease in battery-related idle time after implementing disciplined screening and turnaround procedures. These figures are based on internal modeling and bench-backed methods. While the workflow aligns with the screening and SOP approach documented in our engineering resources, you should validate the targets against your own aircraft and mission profile.
Operation Profile and Challenges
The scenario models hot‑climate soybean spraying with VRA at 35–40°C ambient temperatures. The fleet consists of a mid‑teens drone group, each carrying standard heavy payloads with a high sortie tempo. In the field, charging benches are shaded, support multi-channel charging, and operate within tight daylight windows. Common challenges include occasional pressure dips late in sorties, periodic thermal holds, and conservative return-to-home buffers.
Insights from Bench and Model
Packs typically separate into two practical cohorts: a stable group with lower internal resistance and faster recovery, and a risk group with higher resistance and slower recovery. In the risk cohort, voltage sag is more pronounced and recovery after pump transients slows, increasing the likelihood of under‑delivery events and forced cooling holds.
Applied Workflow (Modeled / Bench‑Backed)
Our recommended workflow demonstrates a repeatable approach to maximize fleet reliability under hot-ambient conditions:
Pack sorting: Stable packs are prioritized for VRA missions, while higher‑resistance packs are redeployed to lighter-duty tasks or held back.
SOC discipline: Conduct regular SOC calibration checks—approximately every 20 cycles as a guideline—and validate SOC error on your own platform before tightening return-to-home buffers.
Turnaround discipline in heat: Avoid initiating charging when cell temperatures exceed ~40°C, and standardize conservative charging rates when ambient temperatures are extreme.
Modeled Outcomes (Two‑Week Window, Directional)
Re‑spray hectares reduced by ~15–20% due to fewer pressure dips.
Battery-related idle time decreased by ~10–15% through fewer thermal holds.
These outcomes demonstrate the effectiveness of a disciplined screening process combined with hot‑ambient SOPs in stabilizing fleet-wide battery performance. All projections are bench-backed; verify them on your fleet before adopting as operational targets.
6S Standards for Hot-Climate UAV Batteries
If you can’t enforce safety docs, stability metrics, and hot‑ambient charging limits at procurement time, you’ll end up paying for problems in the field instead.
Safety, Stability, Service Life
Look for UN38.3 documentation and quality system certificates (ISO9001/14001/45001). Review abuse test philosophy and pack‑level protections. Stability means low IR and tight cell matching; service life means honest cycle specs at your real C‑rates and temperatures.
Standards reference: the current UN Manual of Tests and Criteria Rev.8 with Amendment 1 is cataloged by the UN/UNECE: UN38.3 Rev.8/Amend.1 official files.
Charging Speed and Turnaround
Speed is only useful if it doesn’t cook the fleet. Define allowable C‑rates by ambient band and enforce them in SOPs. Size chargers and generators for realistic sorties/hour so you don’t drift into derates that erase any time saved.
Smart Management and Integration
Telemetry that logs bus voltage, current, temperature, and cell delta in real time is non‑negotiable for VRA. Integrate alerts for slow recovery, widening cell delta, and out‑of‑band temps. Store packs at ~3.8–3.85 V/cell at 10–25°C when idle for >1 week.
Environmental Suitability
Confirm IP rating relevance to rain and mist; assess condensation pathways.
Validate connector integrity against your chemical exposure.
Battery Selection and Lifecycle Strategy
Lifecycle wins come from measurable thresholds (voltage band, recovery time, heat limits, SOC accuracy) and consistent field routines—not from chasing the highest Wh/kg.
Lifecycle Strategy: Measurable Wins
Treat your battery program like an operations system:
Define the thresholds that protect cost/ha (voltage band, recovery time, max thermal hold, SOC error band), especially in operations where field discipline is inconsistent, as deviations tend to amplify thermal and voltage-related risks.
Enforce them in incoming inspection, not after failures show up in the field
Keep routines consistent: rotation, storage, and periodic SOC validation
Key Evaluation Criteria for Agriculture Batteries
What to evaluate | What “good” looks like in practice | Why it matters |
|---|---|---|
Pack-level validation at mission load | Tested at your current draw and ambient temps; sag + recovery are logged | Prevents under-delivery events and re-sprays |
Safety + transport documentation | UN38.3 test summary available; traceable batch info | Reduces compliance and shipping risk |
Turnaround ecosystem | Charger + connector ecosystem is defined; anti-spark + mechanical protection are addressed | Avoids field damage and charging bottlenecks |
Cycle-life transparency (at heat) | Cycle curves are stated at realistic C-rates and 35–40°C assumptions | Avoids optimistic specs that fail in hot seasons |
Fleet Evaluation & Operationalization
A practical, vendor-neutral approach combines conservative hot-ambient SOPs, pack screening, and SOC discipline to maintain voltage within the VRA-safe band and avoid charge holds above ~40°C. These principles are informed by our internal SOPs and engineering resources, adapted for general fleet application.
Steps for Fleet Evaluation:
Benchmark Packs
Test at least two packs per cohort at typical mission current; log bus voltage droop and recovery time.Check Turnaround Reality
In 35–40°C ambient, record how often charging is delayed by heat and how long thermal holds last.Translate to Cost/Ha
Convert re-spray hectares and idle minutes into dollars using your loaded labor and chemical costs.Define Working Targets
Create a short list of enforceable thresholds for procurement, rotation, and maintenance:Voltage band
Recovery time
SOC accuracy
Max thermal hold
Field Evaluation Outcomes
After one field evaluation, your fleet should have:
A validated voltage stability range for your VRA pump and mission current.
A defined cooling/charging SOP that works at 35–40°C without surprise holds.
A shortlist of battery specifications that can be handed to procurement and enforced during incoming inspection.
Validation Note: All modeled results and published performance claims should be treated as starting points. Thresholds must be validated on your own aircraft, mission currents, and charging setup to ensure they meet your specific operational conditions.
Methods and References
Methods and Bench Setup:
DCIR measurement via 10 s pulse at representative SOC bands; 4‑wire sensing; temperature controlled at 25–30°C.
Spray-load emulation using programmable loads to replicate pump current ramps while logging bus voltage and cell deltas.
Projections to 35–40°C use temperature-dependent IR curves from peer-reviewed sources (labeled as modeled).
References:
Kim et al., J Power Sources (2007); Forgez et al., J Power Sources (2010); Abdullah et al., Applied Energy (2020); Li & Yang, J Power Sources (2022).
Variable spraying control system study (2025).
DJI Agras T50 official specs; DJI battery routine maintenance guidance.
UN38.3 Rev.8/Amend.1 official documentation.