


If you select industrial UAV batteries the same way you selected hobby packs, you’ll see the same symptoms in the field: unstable thrust under load, early low-voltage warnings, hot packs during continuous sorties, and batteries that age out far sooner than the lab cycle-life line on the datasheet.
Those failures rarely come from a single “bad spec.” They come from a system that can’t hold its electrical and thermal margins across your mission profile.
Built for engineering, operations, and procurement teams, this guide focuses on what actually constrains industrial UAV performance beyond mAh and C-rating—and how to turn those constraints into selection criteria you can defend in a design review or an audit.
The 5 things that decide real-world performance
If you only have 60 seconds, these are the takeaways that prevent most field failures:
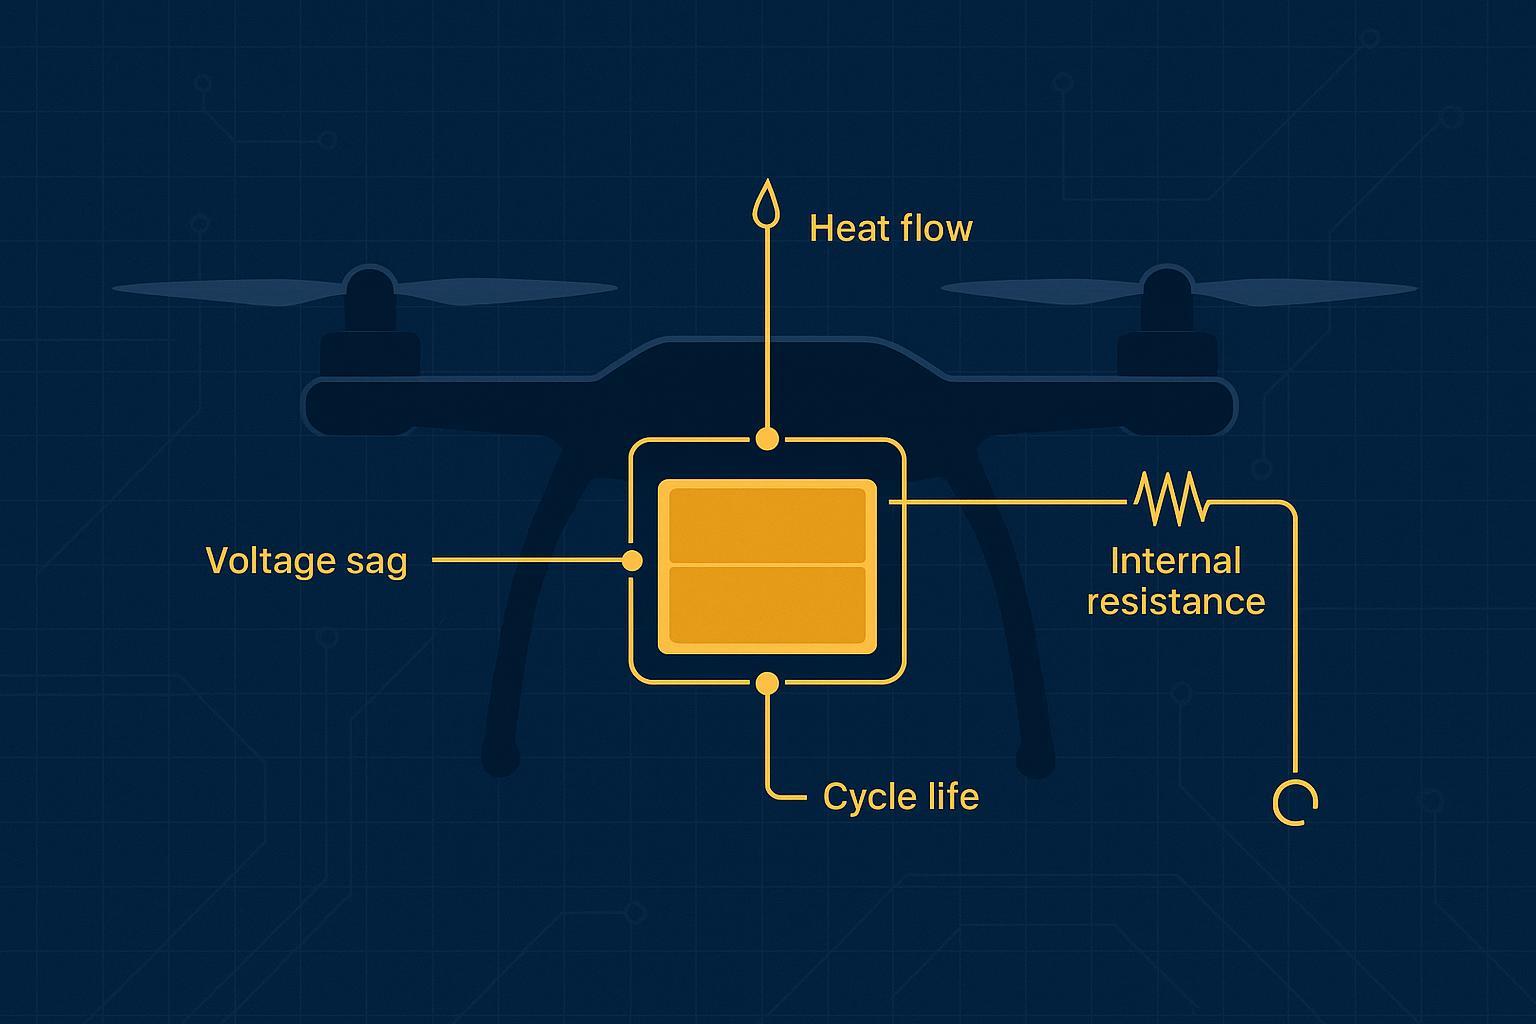
Voltage stability beats capacity: usable power is limited by voltage under load, not mAh at rest.
DCIR is the real “power spec”: higher resistance → more sag → more heat → earlier cutoff.
Thermal rise is a lifecycle limiter: repeated sorties stack heat and accelerate resistance growth.
Cell consistency protects usable capacity: imbalance forces early cutoff even when the pack “looks full.”
BMS behavior defines reliability: protection logic + balancing + telemetry determine whether the pack derates predictably or fails “randomly.”
If mission aborts, payload exposure, or fleet downtime carry real cost in your operation, use the decision matrix first—then validate supplier claims with the deep-dive sections and the evidence checklists.
If you’re short on time, start with DCIR, Thermal Behavior, and Battery Management System. If you run frequent sorties, review Charge C-rate next—because without evidence and margin in these areas, the rest of the datasheet won’t hold up in the field.
The 9 metrics you should verify in every UAV battery datasheet
The sections below cover these nine practical metrics. Use this list as a quick checklist during vendor comparison and qualification.
Voltage system (cell voltages + series count) — compatibility and under-load cutoff margin.
Energy density (Wh/kg) — usable energy per kg from average discharge voltage.
Cycle life (to 80% SOH) — cycles under your duty cycle and temperature.
Charge C-rate — turnaround speed, limits, and charge profile.
DCIR (internal resistance) — method, conditions, and distribution (not “typical”).
Cell consistency — OCV/capacity/DCIR deltas + lot acceptance rules.
Thermal behavior — temperature rise at continuous load + cooldown rule.
BMS behavior — thresholds, balancing current, and exportable logs.
Weight + mechanical fit — net weight, dimensions, connectors, and airflow.
If a supplier can’t provide evidence for items 5–8 (DCIR, consistency, thermal, BMS), treat that as a qualification risk—not a documentation gap.
Industrial UAV battery selection logic: a simplified decision matrix
Use this to get from “consideration” to a defensible recommendation quickly.
Mission type | Typical priority | What to ask suppliers for (proof, not promises) |
|---|---|---|
Heavy lift / logistics | DCIR + thermal stability + voltage sag margin | Sag curve at your peak & continuous current, temperature rise over time, DCIR distribution report |
Inspection / patrol fleets | Cycle life + consistency + predictable derating | Cycles to 80% SOH under your duty cycle, cell-to-cell delta thresholds, balancing strategy & current |
Survey / mapping endurance | Wh/kg + weight + stable average voltage | Discharge curve at your cruise load, pack mass & dimensions, thermal behavior at sustained mid-load |
High-burst / racing-style profiles | Peak current + sag behavior + connector/ESC limits | Pulse load sag data, connector heating tests, protection behavior during spikes |
If your use case spans multiple mission types, size the pack to the worst electrical/thermal segment (often takeoff + climb), then optimize endurance second.
Why Industrial UAV Batteries Fail in Real Operations
Reject packs that can’t hold voltage and temperature margins in your real mission profile. In day-to-day operations, failures usually show up first as voltage sag under load และ cumulative heat—operators feel it as inconsistent climb, extra throttle, and earlier low-voltage warnings even when the pack isn’t “empty.” Before qualification, require sag curves and temperature-rise data at both peak and sustained loads, and align life expectations to field conditions rather than lab-only cycle-life headlines (many teams use 80% SOH as a practical end-of-life threshold, as BioLogic explains in its primer on SOC and SOH).
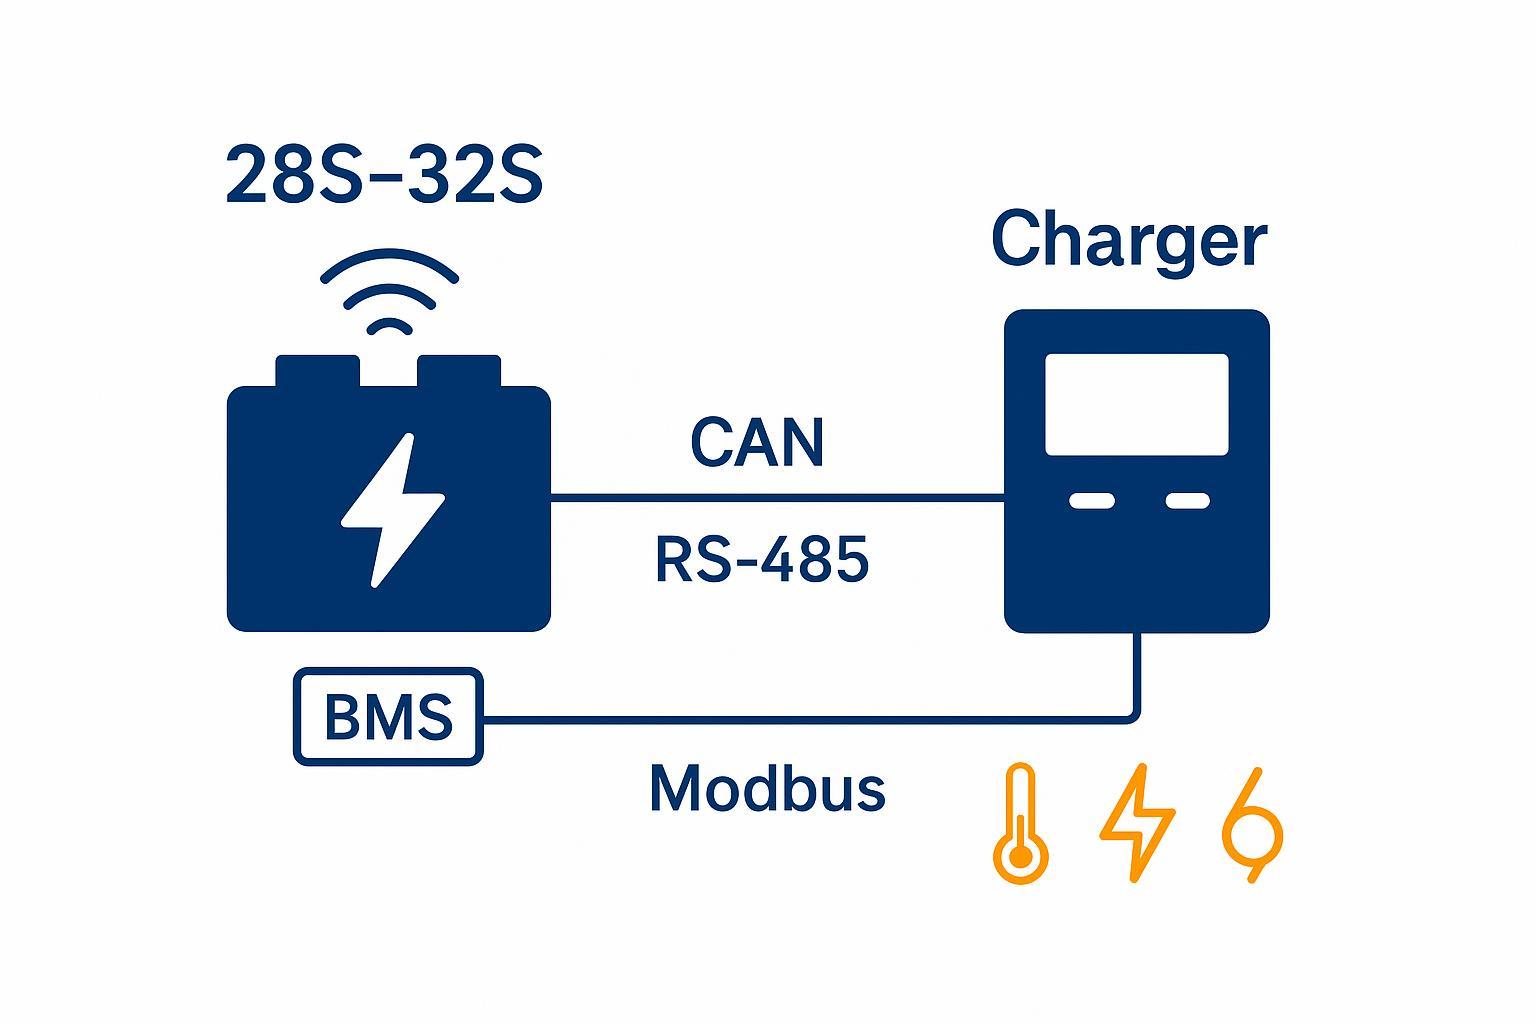
Voltage System: The Foundation of UAV Power Stability
Choose a voltage system that stays inside your ESC window under peak load, because under-load voltage—not resting voltage—drives cutoff behavior and control stability. As a quick numeric anchor, many Li-ion/LiPo packs are discussed around ~4.2V/cell at full charge and ~3.0V/cell as a common cutoff boundary (exact limits depend on the cell, BMS, and your safety policy). To validate fit, ask suppliers for a discharge curve at your actual current and temperature, and define a reserve margin as a written requirement rather than an operator habit.
At the spec level, you only need a few voltage anchors (full-charge, nominal label, and cutoff boundary) plus clear system constraints: ESC voltage window, allowable sag during takeoff/climb, and whether the system should soft-derate or hard-cut off when limits are reached. If you’re changing series count (e.g., 3S/4S/6S and beyond), treat it as a current-management decision and confirm charger/connector/BMS compatibility early, because the goal is reducing electrical and thermal stress—not chasing a marketing number.
Here’s a quick reference for common series counts:
Pack (LiPo/Li-ion) | Nominal voltage (3.7V/cell) | Full charge (4.2V/cell) |
|---|---|---|
3S | 11.1V | 12.6V |
4S | 14.8V | 16.8V |
6S | 22.2V | 25.2V |
Use these as label anchors only—what matters for control stability is the discharge curve under your peak and continuous loads.
Energy Density (Wh/kg): Balancing Endurance and Payload
Optimize Wh/kg only after you’ve proven electrical and thermal stability in your most demanding flight segment, because added battery mass usually increases current draw, voltage sag, and heat in the real aircraft. For clean comparisons, use Wh/kg = Ah × average discharge V ÷ pack mass (kg), where “average V” should come from the discharge curve at your load and “pack mass” should be the net pack weight (ideally excluding external leads/connectors if you’re standardizing measurements). Compare vendors using cruise-load discharge curves plus pack mass and dimensions, and treat mAh as incomplete—usable energy depends heavily on voltage under load.
In practice, Wh/kg is as much a payload economics variable as an endurance variable: extra battery weight either displaces payload or forces more thrust, which can erase the headline advantage. Two packs with similar nominal specs can still deliver different flight time if one holds voltage better at your cruise current, so ask for the curve at your load/temperature and confirm what BMS telemetry you can export for verification in the field.
Cycle Life: The Real Driver of Fleet Operating Cost
Cycle life isn’t a single number—it’s the result of temperature, depth of discharge, and charge/discharge rates under your duty cycle, and it directly drives fleet replacement planning. As a quick rule of thumb, 1C charging is roughly a 1-hour charge (2C ≈ 30 minutes, 3C ≈ 20 minutes), but “rated charge C” should be treated as a safe operating claim that needs evidence under repeat use. For routine operations, many fleets default to 0.5C–1C charging and reserve higher C-rates for schedule-critical turns, because higher charge current tends to show up first as rising resistance and shorter usable life.
In qualification, ask for the charge profile (current vs time), temperature limits during charge, and the BMS behavior that enforces them, then align acceptance criteria (DoD, temperature, charge rate, and end-of-life definition such as 80% SOH) to how the packs will actually be used in the field.
DCIR (Internal Resistance): The Hidden Cause of Power Loss
DCIR is the pack’s real power constraint because it drives both voltage sag และ I²R heating under load, and inconsistency in DCIR is a common reason fleets feel “uneven” even with identical airframes. Practically, DCIR is the effective internal resistance you see during a defined load pulse (often reported in mΩ), and a rising DCIR trend is frequently an early signature of aging even before operators notice a clear capacity drop. For procurement, DCIR is only meaningful when it’s specified like an engineering parameter—measurement method + test conditions + distribution—so require those documents up front and validate sag and heating at your actual current levels.
If you need a shared definition across teams, NEWARE’s explainer on DCIR testing principles and methods is a practical reference for aligning pulse length, SOC, and temperature conditions.
Cell Consistency: Why Pack Stability Matters More Than Cell Specs
Cell-to-cell deltas in open-circuit voltage (OCV), capacity, and DCIR determine whether a series pack uses most of its energy or hits limits early, so lots that exceed your tolerance should be downgraded or rejected. The operational symptom is familiar: the pack still charges to “full,” but flight time becomes uneven and cutoff arrives early because one group reaches its limit first. Require a consistency report (spread across OCV/capacity/DCIR) and define clear lot acceptance rules before qualification, because fleet reliability depends more on distribution than on a single “best cell” number.
Mismatch is also a lifecycle and safety problem: higher-resistance groups run hotter under the same current, age faster, and push the pack toward earlier cutoff and wider performance spread over time. For a deeper experimental discussion of resistance mismatch effects, see Gogoana et al. (MIT) in the Journal of Power Sources on internal resistance matching for parallel-connected lithium-ion cells.
Thermal Behavior: The Limiting Factor for Repeatable Performance
Thermal rise is often the hard ceiling on repeatable performance, so derate any pack that can’t control temperature across repeated sorties. Require temperature-rise vs time data at sustained load and define cooldown-before-charge rules that match your sortie cadence, because stacked heat accelerates resistance growth and shortens usable life even when the pack “looks fine” on a single flight. Operationally, set pack-specific thresholds (maximum end-of-discharge temperature, allowable temperature rise, and peak limit) and treat exceedances as a trigger to reduce load, extend cooldown, or pull packs from the most demanding missions.
If you want a compact reference on why heat couples with degradation, the open-access review on heat generation and degradation mechanisms of lithium-ion batteries is a useful baseline.
Battery Management System (BMS): The Safety Control Layer
Treat “smart battery” claims as unverified unless you can export and audit the telemetry, because without logs, protection events look random and root-cause analysis stalls. The BMS defines your real operating envelope—protection thresholds, derating behavior, and balancing—so your spec should explicitly require the log fields you need (cell voltages, temperatures, current, fault codes), the export method, and whether protection is a predictable soft derate or a hard cutoff. As a practical reference point, many lithium packs discuss overcharge protection around the 4.20–4.25V/cell range and overdischarge protection around ~2.8–3.0V/cell, but the correct thresholds are cell- and BMS-dependent and should be verified against your supplier’s compliance package.
Balancing matters because mismatch grows over time, and weak balancing capability makes fleets drift further apart. For a concise explanation of why balancing protects usable capacity in series strings, see Mouser’s note on using cell balancing to maximize capacity (and TI’s brief on cell balancing buying extra run time and battery life).
Weight and Mechanical Fit: Structural Constraints in UAV Design
Mechanical fit is an electrical and thermal variable in UAVs, not an afterthought: blocked airflow and connector strain quickly turn into hotter packs, intermittent power, and accelerated wear. Validate integration during qualification, and keep the checks simple: confirm battery bay fit, mounting security, center of gravity, airflow around the pack, and connector/cable strain under vibration.
Weight is part of the same equation—extra mass increases thrust demand, which increases current, which increases sag and heat—so treat dimensions and net weight as explicit acceptance items when comparing vendors, not informal “it fits” assumptions.
How to Use This Industrial UAV Battery Specification Guide to Select the Right Battery
Selection should feel like a qualification process, not a shopping comparison.
Step 1: Define mission profile and load conditions
Write down:
peak power events (takeoff, climb, gust recovery)
sustained load duration
ambient temperature range
turnaround time between sorties
payload sensitivity (sensor data integrity, mission abort cost)
Step 2: Match electrical system parameters (V, C-rate, DCIR)
Do not let C-rating stand alone.
Match:
series voltage system to ESC/motor/controller limits
DCIR and sag behavior to your peak-current envelope
continuous current capability to sustained mission segments
A useful supplier question:
“Show me sag and temperature rise at our continuous current, not just burst current.”
Step 3: Evaluate lifecycle cost (TCO-based selection)
To compare packs fairly, treat cost as total usable work delivered, not price per pack. A simple way to do that is to estimate capex per usable cycle (pack price divided by cycles to your end-of-life threshold under your duty cycle), then layer in the operational impact of failures and delays by estimating downtime exposure (events per month × hours per event × cost per hour). This keeps procurement discussions grounded: two packs that look similar on mAh and C-rating can have very different cost outcomes once DCIR growth, thermal stacking, and lot consistency are accounted for.
Step 4: Validate safety margins and thermal constraints
Ask for data that maps to your risk.
A procurement-friendly way to formalize this is to request the same “evidence pack” from every shortlisted vendor so you can compare apples to apples:
sag curve at peak and continuous current (test temperature stated)
temperature-rise vs time at continuous load + cooldown-before-charge rule
discharge curve at relevant load and temperature (include the curve data, not just a screenshot)
DCIR measurement method + test conditions + distribution (cells and packs)
cell-to-cell delta report (OCV/capacity/DCIR) + lot acceptance thresholds
BMS behavior document (thresholds, soft-derate vs hard cutoff) + balancing current
telemetry/log export sample (fields + format) for post-flight auditing
compliance + traceability package (UN38.3, CE/UL where applicable, serial/lot mapping)
If you need a general orientation on industrial selection criteria and documentation expectations, Herewin’s industrial drone battery buyer’s guide 2026 can serve as additional reading.
From Specifications to Engineering Decision-Making
mAh and C-rating can both be “true” and still fail in the field, because real performance is constrained by voltage stability, DCIR-driven sag and heat, thermal stacking across sorties, pack consistency, and BMS behavior you can actually audit. The practical rule is simple: no curve data, no qualification—insist on sag curves, temperature-rise curves, DCIR method + distribution, and exportable logs before you approve a vendor. Once you have those, selection becomes an engineering decision you can defend in a review: define your margins, validate them at your real loads, and write the acceptance criteria into procurement.
If you’d like a supplier to co-define those acceptance criteria (test conditions, lot acceptance rules, telemetry fields) and lock them into an ODM/OEM agreement, Herewin can support that qualification-driven approach. If you want, share your mission profile, peak/continuous current, ambient temperature range, and turnaround targets—and we’ll suggest a qualification checklist and the specific evidence pack items to request before you commit to a build.