










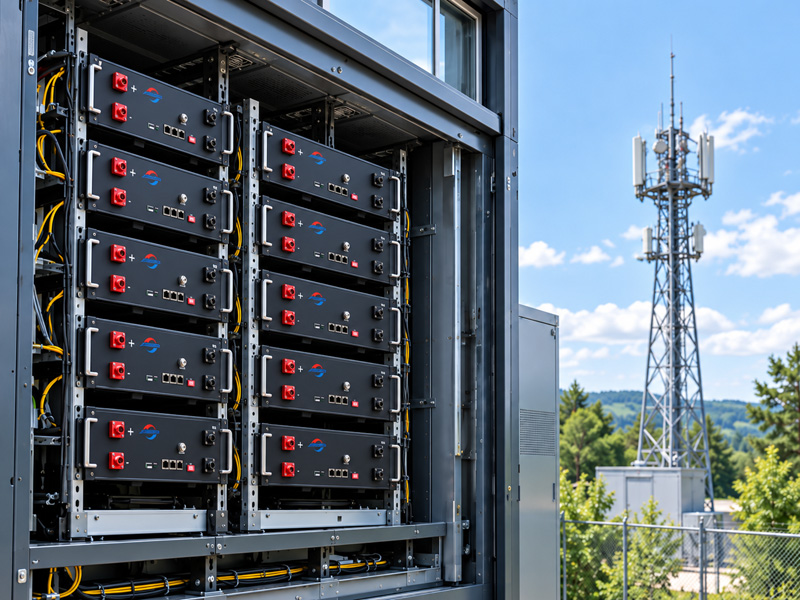




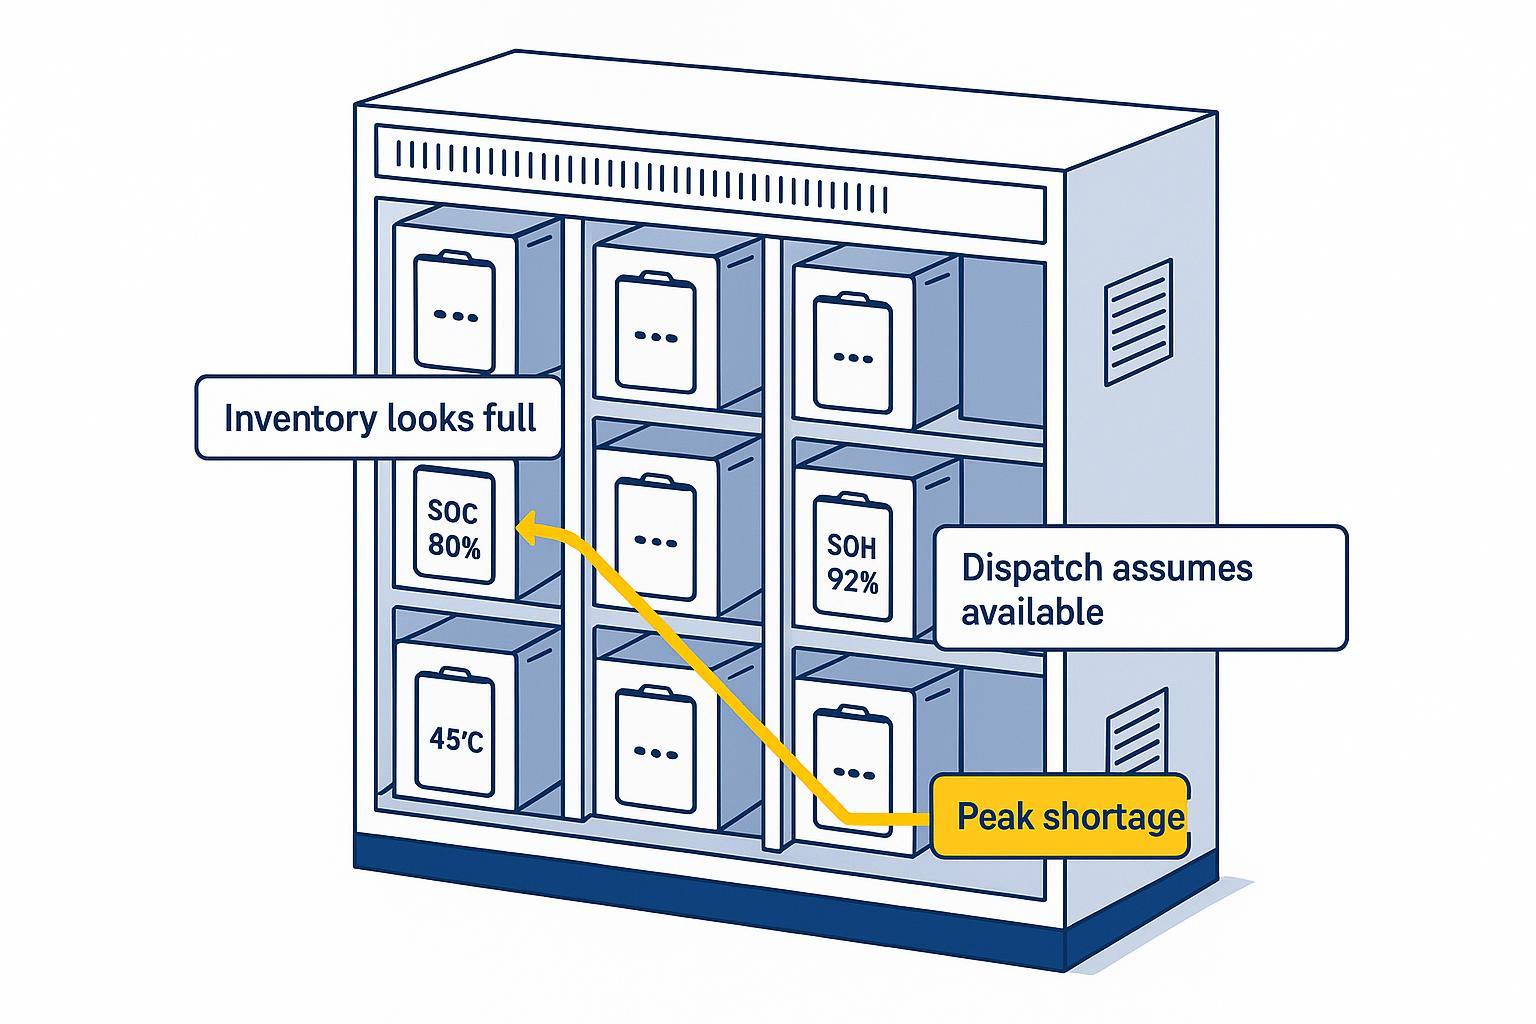
If you run swap stations long enough, you’ll see a familiar pattern: the dashboard shows plenty of inventory, dispatch keeps sending riders, and then peak hour arrives—and the station suddenly “runs out” of usable batteries. Queues grow, bays sit empty, and service levels slip.
Most teams blame the obvious: more stations, more batteries, faster charging. Sometimes that’s true—but it’s rarely the first thing to test.
The more common root cause is quieter and more expensive: the station didn’t run out of batteries—it ran out of correctly classified usable batteries.
When “pool looks full,” dispatch assumes capacity. Peak demand exposes the gap: usable packs were overestimated, and service is forced to degrade.
That’s why the question isn’t “How many packs are in the cabinet?” It’s: “How many packs can deliver the required current right now without derating or protective cutoffs?”
The Inventory Illusion: Why “Full Cabinets” Still Lead to Peak Failures
This is where peak-hour collapse actually starts: the dashboard looks healthy, but the station is already running out of usable packs.
Most swap ops dashboards are built on two easily counted variables:
Inventory count (packs physically present in cabinets / charging racks)
SOC (state of charge)
Those are useful. They’re also the wrong proxy for service capability.
Operationally, you have at least three classes of packs sitting “in inventory”:
Ready-now packs: within temperature limits, healthy enough, allowed to discharge at the required current.
Not-ready packs: charging, cooling, warming, balancing, or waiting on a recovery condition.
Should-not-dispatch packs: flagged by faults, abnormal behavior, or degraded health.
Inventory dashboards usually count all three. Dispatch logic often treats the total as capacity.
But swap operations aren’t a warehouse problem. They’re a service system with constraints. If your definition of “available” is based on presence and SOC alone, the dashboard will still look healthy while usable supply is already collapsing.
Why SOC-Based Dispatch Fails in Swap Operations
SOC isn’t a direct measurement. It’s an estimate produced by the BMS using current/voltage/temperature models. And it’s usually “good enough”—until the moment you care most: peak demand.
As packs age, SOC error tends to compound: drift increases and the pack’s real capacity shifts, so SOC can look stable while usable energy and power capability slide.
Recurrent’s explainer on SOC estimation drift makes the point simply: a gauge reading “100%” tells you a pack is fully charged relative to its current estimate—it does not guarantee the original usable capacity is still there, and it does not prove the pack will hold voltage under load.
Here’s the operational trap: SOC doesn’t fail you on a quiet Tuesday. It fails at peak current.
Under load, delivered voltage drops with internal resistance (voltage sag). As packs age—and as thermal stress accumulates—impedance rises, and the ability to sustain power falls (Heat generation and degradation mechanism of lithium-ion batteries, PMC, 2022).
Finally, derating turns “capacity” into conditional capacity.
You may have energy in the pack.
The pack may be in the station.
The system may label it “available.”
Yet the BMS may restrict output and prevent it from delivering the required power.
That’s how SOC-based dispatch creates “inventory looks full” failures in the exact hours when reliability matters most.
The Real Constraint: Pool Health Is a Distribution Problem, Not an Average
This is the signal operators usually miss: service reliability is governed by the tail of the pool, not the average.
Here’s the core turn: pool health is a distribution, not an average.
Even if two stations each show “120 packs in inventory,” they can have radically different usable capacity if the pool’s health distribution is different.
In a swap network, three variables commonly shape that distribution:
SOH decline (capacity is overestimated)
temperature differences (usability becomes tiered)
cycle / historical behavior (hidden degradation is not uniform)
SOH (state of health) tells you how much capacity the pack can still hold compared to its rated capacity.
In practice, peak-hour failures usually come from a small tail of degraded packs that keep failing readiness gates (cooldown, balancing, fault flags, low-voltage under load) while still showing up as “inventory.”
Three Hidden Signals That Actually Decide Usable Capacity
Most teams already log these signals. The failure is that they’re treated as maintenance artifacts—not dispatch variables.
Temperature history
Many systems use temperature only as a protection limit. From a dispatch perspective, temperature history predicts both immediate derating risk and near-term degradation trajectory.
Record temperature as both a snapshot (right now) and a history (time-above-band). Snapshot protects safety; history protects predictability.
Degradation pattern, not just a health number
Even when SOH is stored, it’s often tracked as a single fleet average.
Dispatch needs station-level distribution (bands/histogram) aligned to demand windows—because peak operations are governed by the tail.
Alarm recurrence behavior
Repeat faults aren’t just maintenance tickets. They’re leading indicators of future usability.
In a pool model, alarm history should contribute to a pack-level dispatch risk score, because packs that repeatedly trigger protective behavior are most likely to fail at peak load or require longer recovery time.
Once these signals are treated as dispatch inputs (not maintenance noise), segmentation becomes straightforward.
How to Manage Swap Pool Health as a Dispatch System
If you want to prevent peak-hour collapse, change one core definition:
Stop managing packs as individuals and start managing the pool as a health distribution.
A practical operational definition looks like this:
In-stock: physically present.
Available: can be dispatched now.
Usable: can sustain the expected current draw without derating/cutoff inside the service window.
Then segment health so dispatch isn’t binary.
A simple, explainable scheme uses three axes:
SOH band (capacity health)
temperature suitability (current temperature + recent thermal stress)
event score (fault/alarm history weighted by recency and severity)
This gives you “Tier A/B/C” packs that match real operations:
Tier A: peak-capable
Tier B: normal duty
Tier C: restricted duty / quarantine candidates
Dispatch becomes straightforward:
assign Tier A packs to peak windows and high-demand corridors
protect Tier B packs from repeated peak stress
route Tier C packs away from critical demand and into controlled recovery/inspection
If you’re building or upgrading a swap network, the non-negotiables are: pack-level telemetry you can trust, an auditable health model, and a dispatch layer that uses health distribution—especially across mixed pack variants.
Our role can be helpful here as an ODM/OEM battery partner, because the “solution” is rarely just cells. What typically matters is whether the pack, BMS, data interface, and lifecycle policy are designed as one operational system your team can actually run and audit (see Herewin and Low-Speed EV Battery Solutions for context).
Operational KPIs for Swap Station Pool Health
If you want to know whether your pool model is improving, track metrics that expose the “inventory looks full” illusion—and tie each one to a dispatch or maintenance action.
KPI / Input | How to measure (operator-friendly) | Why it matters | Where it plugs into decisions |
|---|---|---|---|
Usable availability rate | usable-ready packs ÷ in-stock packs (per station, per hour) | Shows the real battery availability problem | dispatch routing + restocking thresholds |
Stockout probability (peak window) | frequency of “no usable pack” events during peaks | Measures customer-facing failure directly | buffer sizing + peak policies |
Queue / wait time | median and p95 swap wait time | Turns misclassification into a rider cost | cabinet capacity + staffing |
SOH distribution by station | histogram / bands, not just average | Reveals station-specific tail risk | cross-station rebalancing |
Thermal stress markers | time-above-policy temperature band, thermal gradient flags | Predicts derating risk and faster aging | tiering + charge profile changes |
Alarm recurrence score | weighted count of critical alarms per pack | Flags packs that will fail again under load | tier downgrade + quarantine triggers |
Charge-to-ready time variance | variance and p95 time-to-ready | Captures slow recovery that breaks peak buffers | buffer sizing + charging policy |
When a swap station “runs out” at peak while inventory looks full, the first question shouldn’t be “How many batteries do we have?”
It should be:
Are we incorrectly labeling marginal packs as usable?
Are we dispatching based on count and SOC instead of health-distributed usable capacity?
Because in swapping, the constraint is rarely battery quantity. It’s the accuracy of your pool-health model.
If your station frequently runs out of usable packs while inventory looks full, the first system change is not adding batteries—it is redefining availability as a health-weighted dispatch variable, then routing peak demand to packs that are actually peak-capable.






 Nederlands
  English
  Español
  한국어
한국어  Deutsch
  Français
  日本語
日本語  Русский
  Bahasa Indonesia
  ไทย
ไทย  العربية
  Português do Brasil
  Italiano