












When an OEM team sits down to choose between a fixed-wing, a VTOL, or a hybrid VTOL fixed-wing platform, the conversation usually starts with aerodynamic layout and a spec sheet of theoretical endurance. Those matter. But there’s a third variable that quietly decides whether the delivered endurance actually shows up in the field.
The same “60-minute endurance” headline means little on its own, because the three architectures hand you different battery discharge curves. My argument here is straightforward: buried inside every architecture choice is a battery problem that is routinely underestimated — which discharge curve your pack has to survive. If the pack doesn’t fit that curve, the gap between theoretical and delivered endurance widens, and it tends to widen most on hybrids, which stack a hover spike, a transition transient, and a cruise sustain into a single mission. The most easily overlooked moment in that stack is the hover-to-cruise transition.
This isn’t a debate about which airframe “wins.” It’s an argument about how to pick the power system before you lock the airframe.
The Industry Consensus and the Assumption It Leaves Unquestioned
Across OEMs and market analysts, the direction is pretty settled: hybrid VTOL fixed-wing is becoming the mainstream answer for long-endurance industrial missions. The fixed-wing VTOL UAV market is growing steadily, and market analysts broadly expect the hybrid fixed-wing VTOL drone segment to keep expanding at double-digit rates through the early 2030s.
The physics behind the consensus is straightforward: a fixed-wing gets lift from its airfoil, so cruise is efficient and low-load; a multirotor fights gravity continuously through its rotors, so hover is expensive. Hybrid platforms take off vertically like a multirotor, then transition to efficient forward flight like a fixed-wing — buying you runway-free deployment and endurance.
None of that is controversial. The hidden assumption beneath most comparisons, however, is worth questioning: decide the architecture first, then adapt the battery to it. I’d argue the order should be reversed — let the discharge curve guide the battery choice from the start rather than the other way around.
The Question Everyone Skips: It’s Not the Airframe, It’s the Power Profile
Once you accept that framing, “long-endurance” stops being a single headline and becomes a demand on the pack that varies with the airframe behind it:
A fixed-wing spends its mission in steady, moderate cruise.
A VTOL must clear a short, violent vertical phase, then sustain.
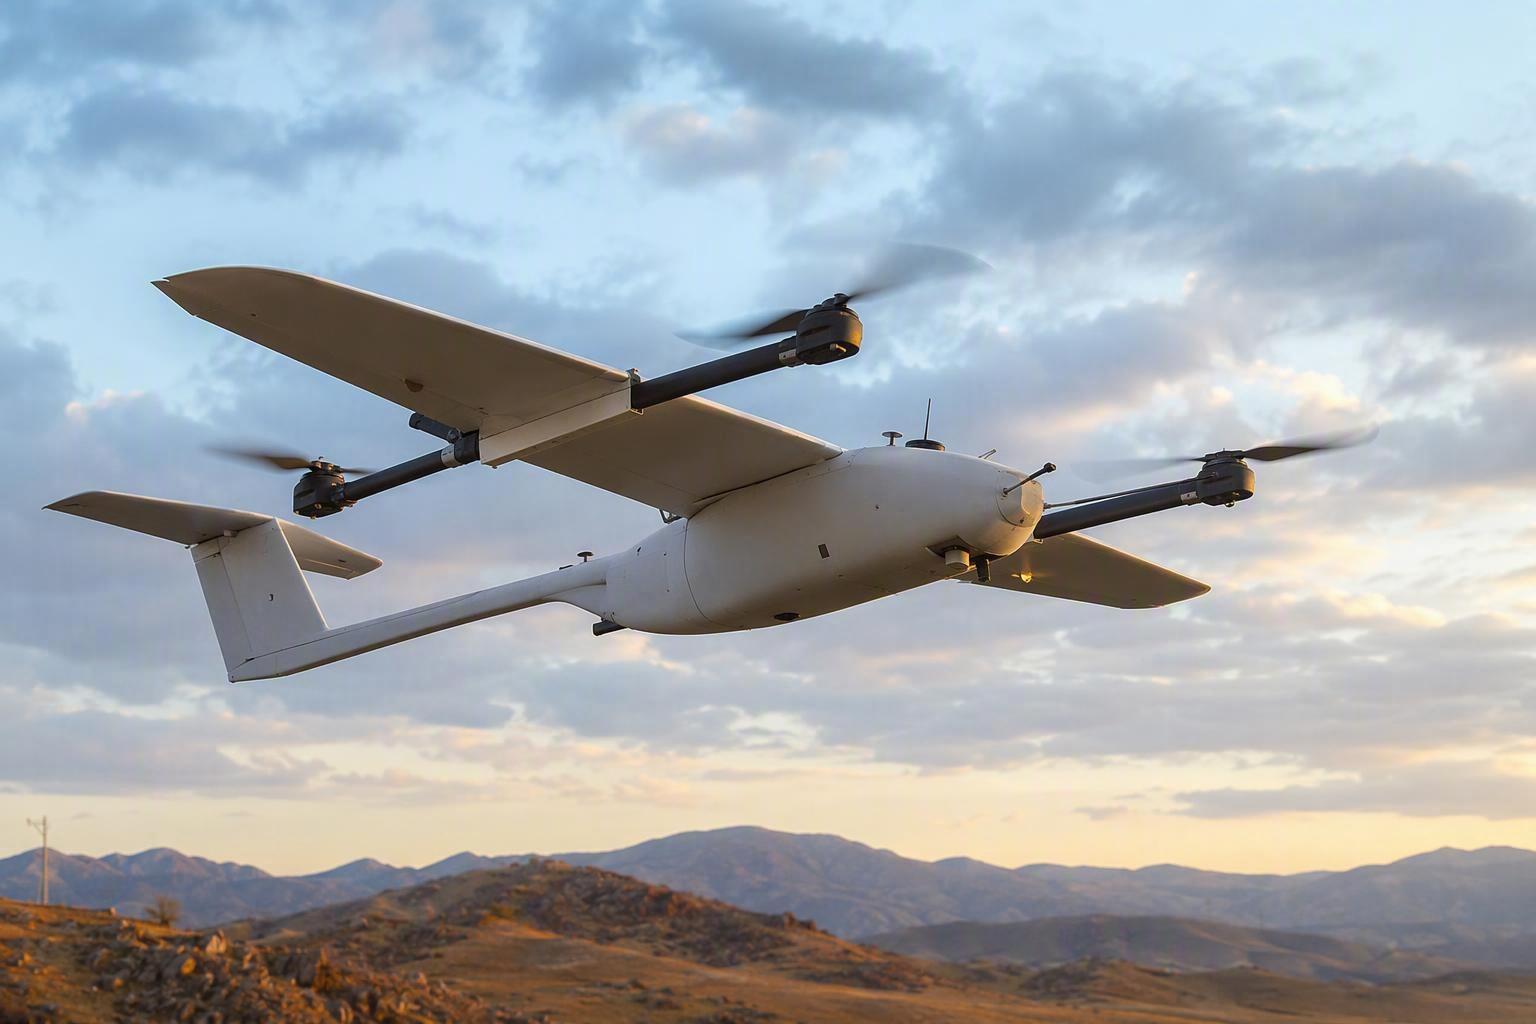
A hybrid does both — plus a transition in between.
The most common mistake in newer OEM programs is locking the aerodynamic layout first, then treating the battery as the last module “stuffed in” once the weight budget is set. That ordering is hard to defend once you view the discharge curve as a hard engineering constraint: it should drive the battery architecture from the start, not the other way around.
Three architectures, three different battery-engineering problems.
Fixed-Wing’s Power Profile: Steady-State Efficiency
A fixed-wing’s battery mostly does one job: deliver a low, steady current during cruise, with a bit more during climb. There’s no hover phase draining the pack, which is why task C-rate and usable Wh/kg behave differently here than on a rotary platform.
The dominant engineering lever is energy density. Because cruise is a roughly linear power demand over a long time, every 1 Wh/kg you add translates almost directly into endurance. Fixed-wing endurance commonly lands in the 60–150 minute band across commercial platforms, and the market has pushed toward higher-specific-energy cells specifically for this reason.
That “steady-state” label hides a secondary subtlety: even a flat cruise still taxes the battery. As the pack drains over the flight, terminal voltage drifts downward and motor efficiency shifts with it. That’s why a high-density pack that holds a flatter voltage curve through the discharge delivers more than one that sags early — even at the same rated capacity. In other words, “steady” does not mean “easy”: the battery design is dominated by one clean optimization — pack more usable energy into the fixed weight budget, and keep the voltage curve stable all the way to the end.
This is the architecture where high-energy-density cells (including semi-solid chemistries in the 300+ Wh/kg class) deliver their value most directly.
VTOL’s Power Profile: Peak-Then-Sustain
A VTOL asks the battery to do two opposite things. Vertical takeoff is a short, high-current event — rotors directly fighting gravity. Then the platform shifts into a gentler hover/cruise sustain. Those two phases are not optional extras; they’re the defining shape of the load.
A 2018 Carnegie Mellon study in ACS Energy Letters put the economics in plain terms: the battery must supply roughly 4C at takeoff and nearly 5C at landing — the landing figure is higher because the battery is at lower state of charge, where voltage is already sagging and internal resistance is higher. So the requirement is both a high burst C-rate for the vertical phases and enough energy density to carry the cruise time.
Those two goals pull in opposite directions at the cell level. A cell tuned for high discharge rate usually gives up some energy density, and a high-density cell usually can’t sustain the same burst. That makes VTOL battery selection a trade-off optimization, not a single-metric game like fixed-wing.
Because of that, the BMS and packaging engineering — thermal management, current-path resistance, discharge-curve control — often matter more than the cell chemistry family alone. This is why treating VTOL battery selection as a mission-profile problem — solving the peak and the sustain together rather than separately — has become a recognized design discipline in its own right.
The Transition Penalty Nobody Sizes For
Here’s the moment I’d argue is among the most under-appreciated in this whole decision — and the one most likely to bite in design review.
A hybrid’s power profile isn’t just hover peak, then cruise sustain. Between them sits a third state: the transition — and its current draw can approach or even exceed the hover peak.
When the aircraft moves from hover into forward flight, the rotors don’t stop the instant the wing takes over. For a short window, both systems work at once: the rotors still push against gravity while the wing builds up its share. In a quadplane, ArduPilot’s documentation notes this can run all motors at very high levels. That surge is enough to push a LiPo pack below about 3.0 V per cell, risking battery damage or even a crash.
The transition current isn’t the hover peak, and it isn’t the cruise sustain. It’s a separate transient spike — and it happens low to the ground, exactly where a voltage sag does the most harm. Treating voltage sag as a measurable reliability criterion is one approach some fleet programs use to catch the problem before it reaches the field. It’s common for OEM sizing exercises to rely on just two numbers — hover peak current and cruise sustain current — and back-calculate capacity from them, without measuring the transition current curve on the actual airframe. In many cases it’s simply assumed to stay below the hover peak.
That assumption is where theoretical endurance parts ways with real endurance — and where voltage collapse, low-voltage failsafes, or a hard cutoff show up in the most critical seconds of the flight.
There’s a natural question every OEM engineer should be posing by the end of this section: has your battery supplier actually measured your platform’s transition current curve, or are they estimating it from hover and cruise numbers?
What This Means for Battery Selection
Once you treat the discharge curve as a first-order constraint in architecture choice, the practical next step is to compare suppliers on measured behavior rather than headline parameters. The evaluation table below is a question checklist, not a spec sheet.
Architecture | Dominant current demand | What to ask the supplier |
|---|---|---|
Fixed-wing | Sustained, moderate-load cruise | What is the usable energy density at your real cruise speed and payload — not the peak-capacity headline? What does the full-discharge voltage curve look like (not just the start-of-flight voltage)? |
VTOL / multirotor | Peak burst at takeoff/landing + moderate sustain | Are continuous and peak discharge rates separated on the datasheet? What is the thermal behavior across repeated takeoff/landing cycles at the target ambient temperature? |
Hybrid VTOL fixed-wing | Peak (hover) → transition spike → sustain (cruise) | Do you have measured transition-stage current data on a comparable platform — not a modeled estimate? Does your capacity sizing cover the worst-case transition duration at low state of charge? |
The third row is the one most OEMs skip, and it is the one that protects against the transition penalty above. It also connects to a recurring lesson: a headline C-rating alone doesn’t tell you whether a pack survives a transition-shaped load step — a point discussed further in a note on high C-ratings for missions with transient peaks.
Matching Architecture to Mission
The right architecture is a function of the mission, not a preference:
Large-area mapping, agriculture, long-distance inspection → fixed-wing (or hybrid when the site has no runway). The lever is energy density; the pack is a straight endurance optimization.
Urban, dense-obstacle, close-range detailed inspection → pure VTOL / multirotor. The lever is high-current capability and thermal management; agility and hovering precision matter more than raw range.
Mixed missions needing long-distance transit with no runway conditions (remote-area inspection, emergency response, runway-less survey) → hybrid VTOL fixed-wing. Here the battery must serve a three-phase discharge curve, which makes it the most demanding of the three to solve well — and the one where underestimating the transition is costliest.
FAQ
Is a hybrid VTOL fixed-wing drone likely to need a bigger battery than a pure fixed-wing with the same endurance?
Generally yes. Although the vertical phases are short — typically well under 10% of mission time — they consume energy disproportionately to their duration, because hover draws far more power than cruise. That energy has to be reserved in the pack even though the aircraft spends most of its flight in efficient forward flight. On top of that, the transition demands burst power capability, which can push you toward a pack with more headroom than pure cruise endurance would suggest.
Can the same battery pack be reused across a fixed-wing and a VTOL model?
Usually not without accepting a performance compromise. The two architectures impose different discharge-curve requirements — energy-density-led for the fixed-wing, peak-then-sustain for the VTOL. A pack optimized for one profile will typically be mismatched — over-provisioned in an area you don’t need, and under-provisioned where the mission actually stresses it — on the other platform. Reuse is possible only when both profiles happen to be benign enough that the compromise is affordable.
What’s one of the most common battery mistakes OEMs make during architecture selection?
Sizing the pack by back-calculating capacity from two isolated numbers — hover peak current and cruise sustain current — without measuring the transition stage’s real current curve on the airframe. The transition transient isn’t captured by either number, and it lands at the low-altitude, worst-moment of the flight where voltage sag is most dangerous. It’s the point where theoretical and delivered endurance diverge, and it’s the exact gap a supplier should be asked to close with measured data, not a model estimate.
Next Steps
If you’re an engineering or product lead midway through an architecture decision, the highest-value move is to treat the battery pack as a first-order part of the design, not the last item on the BOM.
Bring your real mission physics to the table instead of a generic spec sheet: load-current profile, peak currents, mission envelope, and BMS telemetry requirements. Any supplier you shortlist — Herewin included — should be expected to validate the pack against your measured discharge curve, including the transition stage you may not have quantified yet. Measured data, not a modeled estimate, is the level of rigor the decision deserves.



 Nederlands
  English
  Español
  한국어
한국어  Deutsch
  Français
  日本語
日本語  Русский
  Bahasa Indonesia
  ไทย
ไทย  العربية
  Português do Brasil
  Italiano