







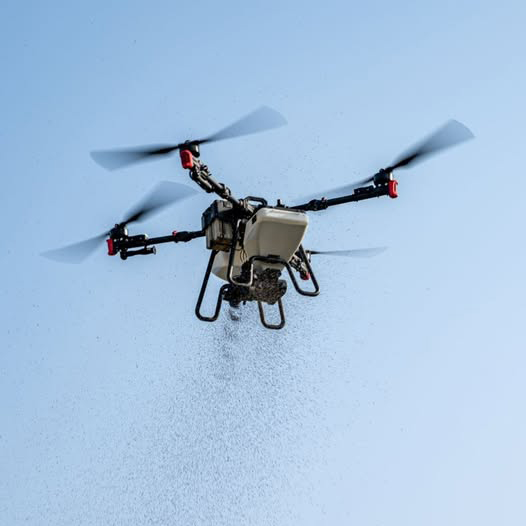

If you manage spray drones long enough, you’ll see a pattern: the first optimization instinct is usually “increase endurance.” More flight minutes should mean more hectares sprayed.
A spray operation doesn’t win the day by stacking single-flight records. It wins by stacking completed cycles—the repeatable rhythm of launch → spray → land → reload/refill → get a safe battery back on the aircraft → launch again.
That’s why daily productivity is closer to:
Completed missions × field output,
than it is to:
Flight time × battery capacity.
The difference is what happens when the drone is on the ground.
Ground time isn’t just an inconvenience. In a constrained work window—heat, wind, crew availability, client deadlines—ground time becomes a throughput bottleneck that quietly dictates how many cycles you can complete, which hectares you can deliver, and what your battery investment actually returns.
For fleet owners, the real loss isn’t only idle battery time—it’s paying for pilots, support crew, and aircraft that aren’t producing billable hectares. When that happens, revenue per day and asset utilization drop even if your daily costs barely move.
Here we’ll take the next step: how ground time translates directly into cost per hectare, and how to evaluate battery systems based on ROI, not specs.
Why longer flight time does not always improve agricultural drone battery ROI
The most common mental model looks like this:
More minutes in the air = more hectares covered.
But field operations are bounded by a day. You don’t get infinite sorties. You get a window.
Imagine an 8-hour application window. You’re not “running the battery.” You’re running a cycle.
A cycle includes:
flying and spraying
landing
battery handling (swap, checks, connector management)
cooling (if needed)
charging (if possible)
waiting in line (often the real killer)
If a drone can fly longer but the system can’t turn the next pack around in time, your operation doesn’t gain cycles. It gains a new bottleneck.
This is how operators accidentally optimize the wrong variable:
They buy longer endurance packs.
Those packs take longer to cool, longer to charge, or require more power headroom.
The field infrastructure (chargers, generator capacity, crew capacity, safe staging) can’t support the new cadence.
The outcome is predictable: your airborne minutes per sortie rise, but your total completed sorties per day may stay flat—or drop.
The right question is not “How long can it fly?” It’s:
Can the system reliably deliver a repeatable turnaround for the entire operating window?
Because ROI is driven by repeatable output—not best-case flight time.
The hidden cost of ground time in spray drone operations
Ground time is the “dark matter” in agricultural drone ROI discussions. It’s hard to see on a spec sheet, but it changes everything in the field.
When ground time grows, three things happen:
You lose cycles (fewer takeoffs per day).
You lose hectares (lower completed area).
Your costs concentrate onto fewer hectares (cost/ha rises even if spending stays the same).
Below are the three most common sources of ground time that show up in real spray operations.
Battery swap delays
This is primarily a process bottleneck: labels, staging, checks, and connector handling decide whether the next takeoff happens on time.
Battery swapping sounds trivial—until you scale.
On a busy day, the swap itself isn’t the only time loss. It’s the micro-delays around it:
finding the right pack (SoC unknown, label missing, packs mixed)
waiting for a pack to cool enough to handle safely
connector and latch issues (wear, contamination, misalignment)
quick safety checks (temperature, swelling, physical damage, terminal condition)
These delays don’t show up as “charger minutes,” but they kill output the same way: they block the next takeoff.
A useful way to think about it:
Every extra minute per turnaround doesn’t just cost a minute.
It risks losing a full cycle later, because it pushes the whole cadence closer to the edge of the work window.
In high-utilization operations, “small” swap delays compound into lost cycles. Cycle time includes waiting time, not just active work.
The most ROI-relevant swap metric is not “swap time in isolation,” but:
swap time under pressure (heat, dust, wet chemical residue, rushed crews)
swap time with consistent safety checks (no shortcuts)
swap time that remains stable across the season (no degradation due to corrosion or connector wear)
If swap time isn’t deterministic, output won’t be either.
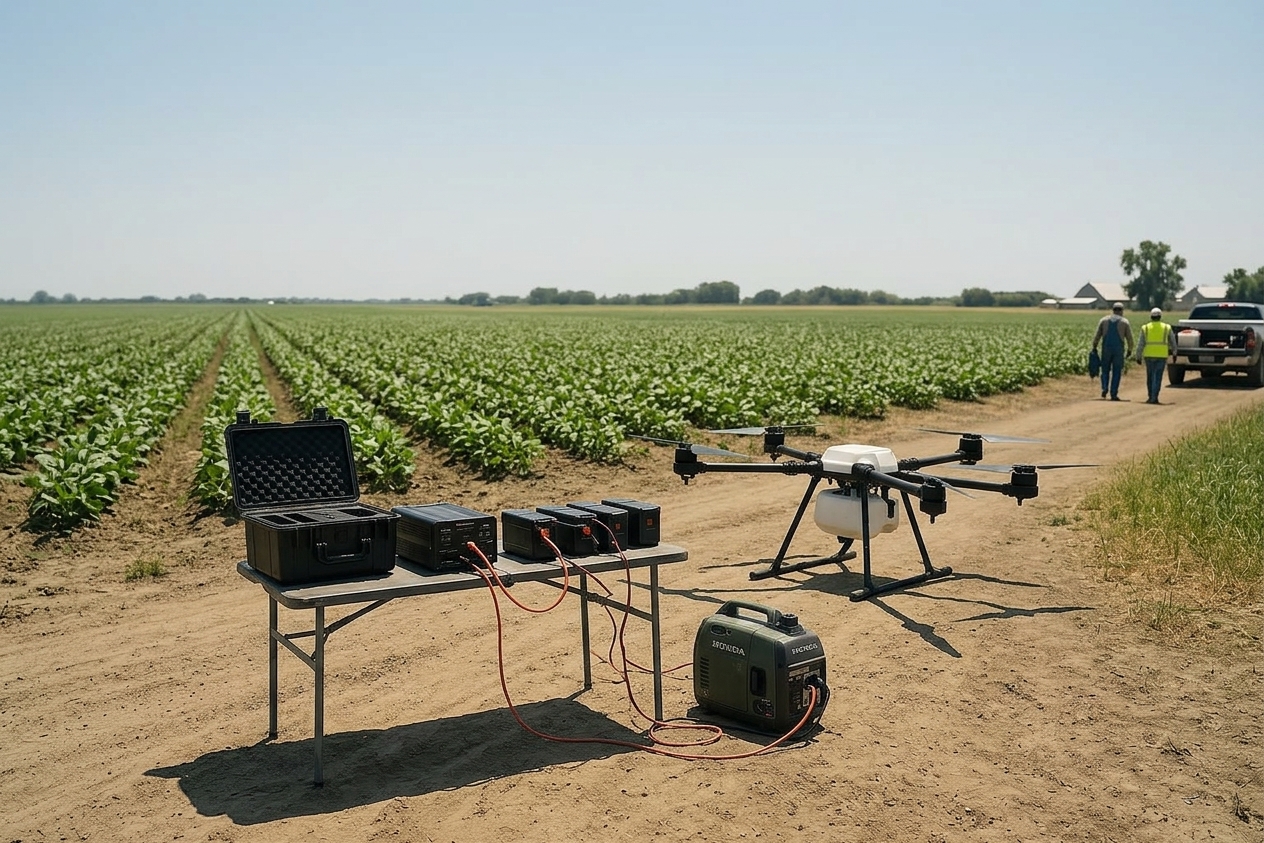
Charging queue and power constraints
This is primarily an infrastructure bottleneck: chargers and generator capacity determine whether packs become “ready,” not just “charged.”
Most operators understand charging time. Fewer operators model charging queues.
In the field, the constraint is rarely the charger’s marketing spec. It’s the reality that:
multiple drones share limited chargers
chargers share limited generator output
packs arrive for charging in bursts (not evenly)
That’s why the metric that matters is not charge time—it’s ready time.
Ready time is when a battery is actually safe and eligible to fly:
cooled to an acceptable temperature
charged to the target SoC
balanced if required
passes quick inspection
staged in the “ready” zone (not still on the charger, not still hot)
In other words: ready time includes the waiting line.
This is also where ROI gets distorted by “spec thinking.” A faster-charging pack can still create worse ROI if it:
requires higher peak power than your generator can provide
throttles charge current due to temperature limits
increases operational handling complexity (more gating rules, more failure modes)
The charger can be “fast.” The operation can still be slow.
In spray operations, the slowest step is often not airborne work—it’s battery availability.
Thermal recovery time
This is primarily a battery-behavior bottleneck: temperature limits when a pack can safely accept charge and return to the rotation.
Thermal recovery is where agriculture behaves differently from many “lab” scenarios.
On hot days, you can have a battery that is:
electrically capable
mechanically intact
…but still not eligible for fast charging—or not eligible for charging at all—until it cools.
Two realities collide:
Spray drones draw high power under load (payload, climb, wind).
Field conditions can be punishing (high ambient temperature, heat soak, limited shade).
If the pack comes down hot and goes straight to the charger, the system may throttle charge current or pause charging to protect the cells. That’s not a “charger issue.” It’s a physics and safety issue.
Fast charging is limited by electrochemistry and safety risks such as lithium plating; under non-ideal heat and load, charge acceptance can become the limiting factor (see Wiley’s review, Fast Charging of Lithium‑Ion Batteries).
For operators, the practical takeaway is simple: Even if your charger is available, the pack may need time before it can accept current safely.
That thermal recovery time is pure ground time.
And it has a nasty characteristic: it tends to show up exactly when you most need productivity—during peak hours.
How ground time changes cost per hectare
Once you accept that ground time governs completed cycles, cost becomes easier to understand.
The core equation is: Cost per hectare = Total operating cost / Completed hectares
Battery cost is part of total operating cost, but it’s rarely the only driver. Ground time hits you from both sides:
It can increase costs (more labor hours, more generator fuel, more idle equipment time).
It can reduce completed hectares (your denominator shrinks).
That’s why two operators with similar battery prices can experience very different ROI.
What belongs in “total operating cost”
To keep this formula usable without inventing numbers, treat total cost as a set of inputs you can measure:
Labor: crew time during the operating window (including waiting and handling)
エネルギー: generator fuel or electricity used for charging
Battery depreciation / replacement: the cost of packs spread over usable lifecycle
Downtime: minutes lost to charging queues, cooling, inspections, connector issues
Equipment utilization: drone asset time idle vs productive
Maintenance and consumables: connectors, harnesses, cleaning supplies, replacement parts
Agricultural extension cost models also show that drone operating cost is determined by total ownership and operating factors—not battery price alone (see the University of Missouri Extension’s 2025 tool, Economics of Drone Ownership for Agricultural Spray Applications).
Our focus here is the denominator: completed hectares. That denominator is where battery systems usually win or lose.
When ground time increases, hectares/day drops. If your labor and equipment costs are roughly fixed for the day, cost per hectare rises.
The ROI chain that operators should actually track
Battery ROI isn’t driven by the biggest spec on paper—it’s driven by what your system can reliably deliver in the field.
When ground time increases, you lose cycles. Lose cycles, and you lose hectares. And once completed hectares drop, your cost per hectare goes up.
That’s the shift to make: stop treating lost minutes as “minor.” Treat them as lost cycles.
A battery system that protects cycle cadence—even with modest per-flight endurance—often delivers better ROI than a longer-endurance pack that adds waiting, heat constraints, or charging queues.
A better way to evaluate agricultural drone battery investment
If you’re buying or upgrading batteries for a fleet, you can build a procurement conversation that matches field reality.
Don’t ask:
❌ How long can it fly?
Ask:
✅ How many hectares can this battery system support per day in my operating conditions?
To answer that, you need metrics that expose ground time.
Evaluation metrics that reflect ROI
Daily productive cycles
How many complete “spray cycles” per aircraft per day are realistic in your operation?
Ready battery availability
At any moment, how many packs are staged as “ready-to-fly” versus “cooling,” “charging,” or “unknown”?
Downtime percentage
What share of the operating window is lost to battery-related ground time?
Cost per hectare
Use the core equation. Don’t argue about endurance specs until you understand the denominator.
A practical input table
Use this table as a fill-in model for your operation.
カテゴリー | Input you measure | Why it matters for ROI |
|---|---|---|
Work window | spray hours available per day | caps maximum cycles |
Field output | hectares per sortie (your average) | converts cycles to hectares |
Swap process | average swap + check time | creates ground-time tax |
Cooling | average cool-down before charging | delays readiness |
Charging capacity | chargers per drone + power source limits | creates queues |
Ready-time discipline | staging rules (ready/reserve/cool-down) | prevents “lost packs” |
Battery lifecycle | usable cycles before retirement (your definition) | spreads capex across hectares |
Failure modes | connector corrosion, swelling, imbalance, BMS faults | unexpected downtime risk |
This table also clarifies what a supplier should help you validate during evaluation:
pack temperature behavior under your duty cycle
the charger + field power setup required to keep batteries “ready-to-fly” on schedule
Choosing battery systems based on ROI, not specs
A battery supplier that only talks about Wh/kg is selling a spec. A battery partner that understands ROI talks about the system:
How many packs per aircraft are required for your duty cycle?
What charger topology prevents queue formation?
How does the operating environment (heat, dust, chemical residue) change maintenance and availability?
What lifecycle expectation is realistic under high-rate cycling—and what operating rules protect it?
This is the core procurement reality: battery ROI is a system design problem.
If you’re working with an ODM/OEM partner, the value is not just cell selection. It’s matching the whole architecture—pack quantity, mechanical interfaces, charging strategy, and field constraints—so the operation delivers predictable cycles.
If you want, we can help you validate the full system—pack quantity, interfaces, charging strategy, and field constraints—before you commit. You can learn more about us at ヘレウィン.
Next steps
If you want to evaluate a battery upgrade without guessing:
map your turnaround cycle (what happens after landing)
measure where time is lost (swap delays, queueing, cooling)
translate lost minutes into lost cycles and lost hectares
Then size the battery + charger system around the real bottleneck—not around a single-flight endurance number.
 日本語
日本語  English
  Español
  한국어
한국어  Deutsch
  Français
  Русский
  Bahasa Indonesia
  ไทย
ไทย  العربية
  Português do Brasil
  Italiano
  Nederlands