







Take two cells built to the same specification, from the same material lots, on the same line. One might still hold its capacity at a thousand cycles; the other may show measurable drift by three hundred. Nothing was added or removed between them — that span is what batch-to-batch variation looks like when process windows are wide or loosely held.
That is because a lithium-ion cell is not assembled so much as accumulated: dozens of process steps each leave a physical trace on the electrode stack. A perfect coating on a poorly dispersed slurry carries its non-uniformity forward. A flawless assembly with a high-resistance tab weld becomes a hot spot under load. A clean stack with residual moisture becomes a gassing and capacity-fade problem months later.
This guide follows the sequence in the order material moves through the factory, explains what each step is trying to achieve and what happens when it drifts, and turns that into questions a buyer can put to a supplier. The emphasis is on where variation enters and how it is controlled.
What Goes into a Lithium-Ion Battery Cell?
A lithium-ion cell contains four functional components plus the hardware that holds them together. Each serves one of three jobs: let lithium ions move back and forth easily, let electrons travel to and from the tabs with low loss, and keep the electrode–electrolyte interface stable across thousands of cycles. Every downstream step exists to preserve those three properties.
Cathode materials
The cathode hosts lithium and largely determines cell voltage, energy density and cost. Commercial families include lithium cobalt oxide (LCO), nickel manganese cobalt oxide (NCM) in various ratios, and lithium iron phosphate (LFP). The choice trades energy density against rate capability, cycle life and cost: LCO packs the most energy per unit volume, NCM balances energy against power and longevity by shifting its nickel-to-cobalt ratio, and LFP trades energy density for long cycle life and thermal stability. The cathode is coated onto aluminium foil.
Anode materials
Graphite is the dominant anode material, with silicon blending used to raise capacity at the cost of more pronounced expansion during cycling. The anode hosts lithium during charge and is coated onto copper foil, which is why it must be protected from corrosion at low voltage during the first charge.
Separator and electrolyte
The separator is a porous membrane that physically separates anode and cathode while allowing lithium ions to pass; its coverage of the electrode edges is safety-critical geometry, not a formality. The electrolyte — a lithium salt such as LiPF6 in organic solvents — is the medium ions travel through, and the component most sensitive to moisture. That is why filling happens in a dry environment and why wetting is a controlled step rather than a simple pour.
Current collectors and cell casing
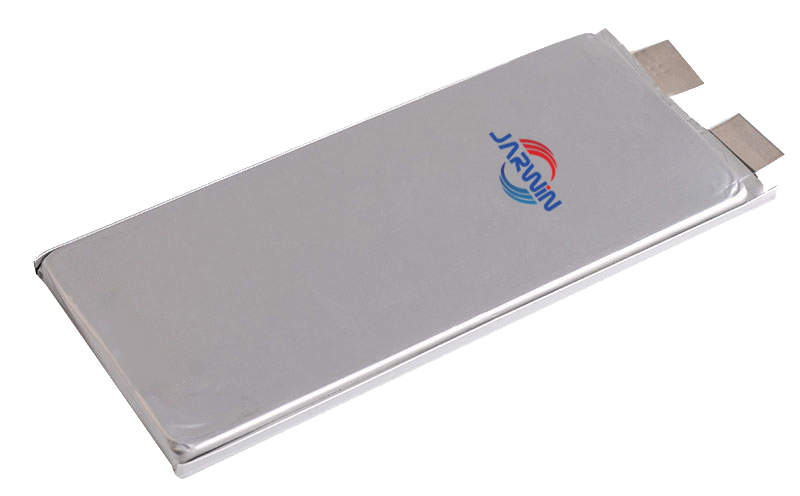
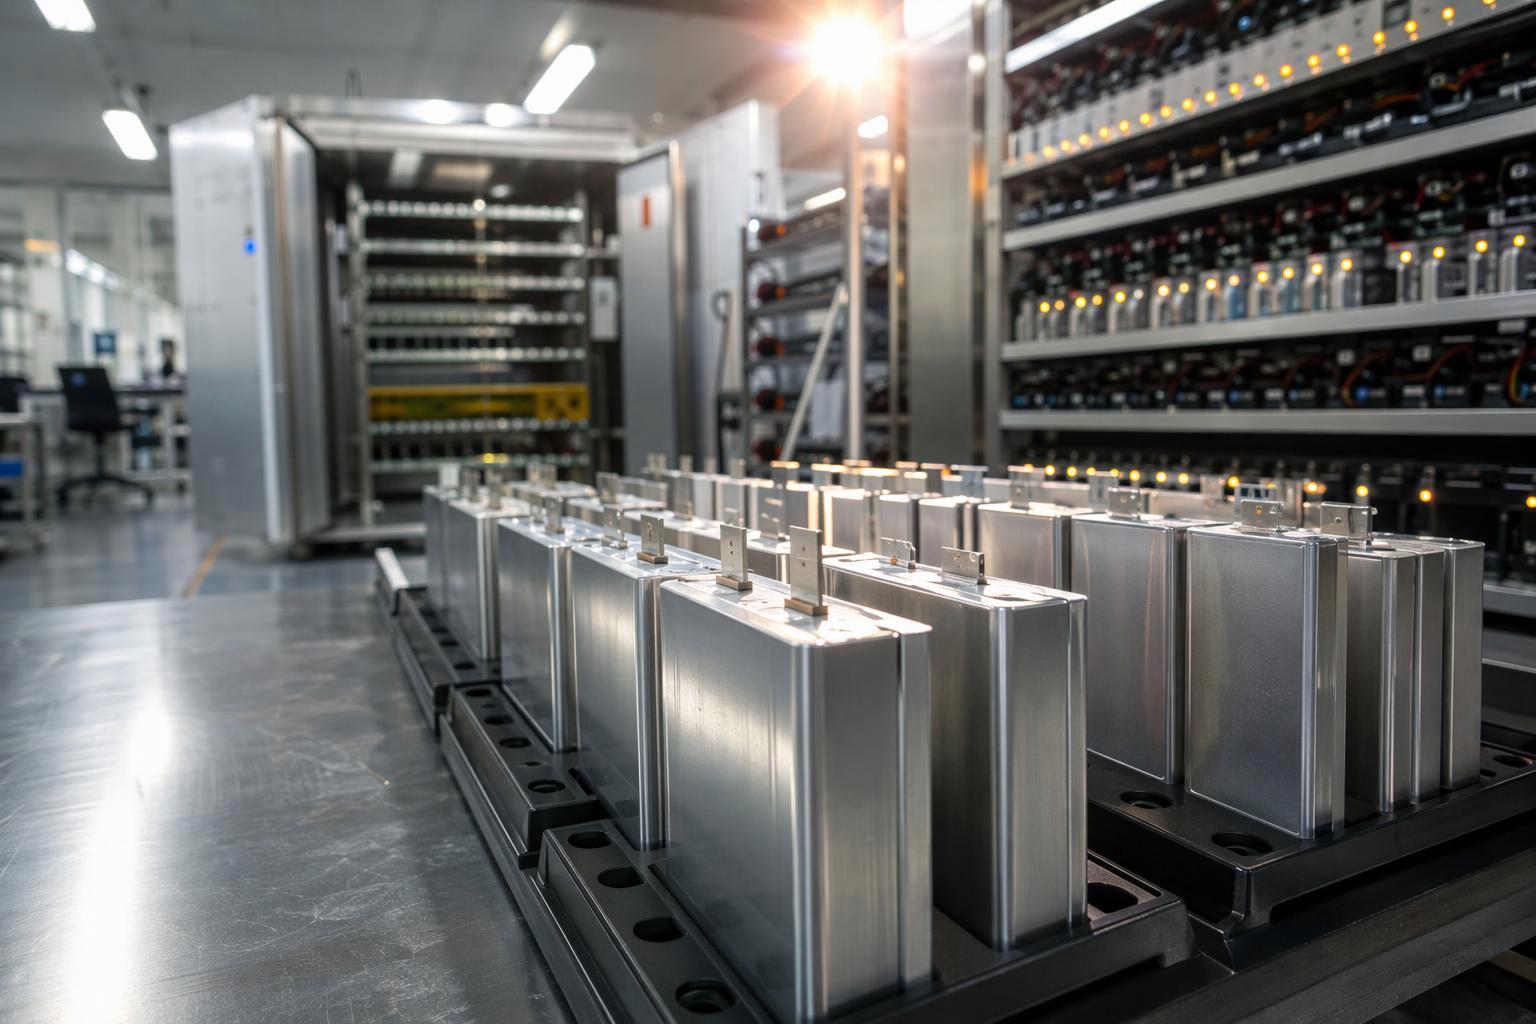
The current collectors are the metal foils that carry electrons from the coated electrode to the tab. The casing — a hard case or an aluminium laminate pouch — seals the stack from the atmosphere and provides mechanical constraint. The enclosure format is not standardized; each manufacturer selects it for the intended application.
Stage One: Electrode Manufacturing
Electrode manufacturing turns powders into a coated, densified, cut foil roll. It is the stage where the largest share of a cell’s eventual consistency is decided, because the properties established here — loading, uniformity, density, porosity, moisture — are largely locked in by the time the roll leaves the slitting machine.
Slurry Mixing: Creating a Uniform Electrode Mixture
Active material, conductive additive and binder are combined with a solvent. Cathode slurries typically use NMP with PVDF binder; anode slurries commonly use water with SBR and CMC. Mixing is usually done in a planetary vacuum mixer that performs dry mixing, staged solvent addition and high-speed dispersion, with vacuum applied to remove entrained air.
The purpose is dispersion: every particle of conductive additive should be distributed so that no region of the finished electrode is starved of electronic pathways. That requires a controlled balance between dispersion and mechanical stress. Too little shear leaves conductive additive agglomerated, which breaks up the electronic network and creates localized high-resistance regions that polarize more heavily during charge — a condition associated with lithium plating under high charge rate or low temperature. Too much shear damages the binder network and the active particles. A review of lithium-ion manufacturing cites one mixer-design study in which a 3D mixer reached uniform mixing within two hours and delivered a 10 mAh/g capacity gain for an NMC cathode over conventional Rushton turbine mixing — a single study on one chemistry, not an industry benchmark, but enough to show that slurry homogeneity is not cosmetic (PMC8050716). Factories control the step with in-line viscometers, particle-size analysis, solids-content tolerances, gel-particle checks and filtration ahead of the coater.
Coating and Drying: Controlling Electrode Loading and Uniformity
The slurry is pumped through a slot die and coated onto both sides of the current collector, then dried to evaporate the solvent. The key variable is areal loading — the mass of dried coating per unit area, usually in mg/cm². Battery Design calls it “the single manufacturing variable with the most direct influence on a cell’s areal capacity,” a fair description of its role, though it is one practitioner’s framing rather than a settled industry ranking (Battery Design). Loading sets the starting point for areal capacity; calendering, porosity, electrode design and the chemistry of both electrodes shape the outcome from there.
Coating control means three things at once: absolute loading, its uniformity across web width and length, and the absence of edge build-up (“fat edges”) that would cause local compression differences during calendering. Drying must remove solvent without cracking the coating or migrating binder to the surface, and foil moisture is monitored because the current collector itself can carry water into the dry room.
Loading drift shows up most directly in the N/P ratio. If cathode loading creeps high relative to the anode, the anode becomes the limiting electrode under fast charge — a condition associated with lithium plating rather than simple capacity loss. The same imbalance can come from the anode side, which is why both electrodes’ loading data matter.
Calendering and Slitting: Adjusting Density and Electrode Dimensions
Calendering passes the coated electrode between rollers to compress it to a target thickness, raising compaction density and improving particle-to-particle contact. The parameter of interest is compaction density (also called electrode density):
compaction density = areal loading ÷ coating thickness
The formula is only meaningful once the measurement basis is stated. Areal loading and thickness must be measured on the same basis — single-side coating versus double-side total, with or without the current collector thickness subtracted. A density quoted for a double-side coating with the foil included is a different quantity from one quoted for the coating alone, so when a supplier reports a density, the useful follow-up is: which basis?
Density also trades off against porosity. Pressing too hard closes the pores the electrolyte needs to penetrate, which raises ionic resistance and can hurt rate capability even as it improves electronic contact. The same review describes a two-step roll-pressing approach on graphite anodes that reduced swelling after 25 cycles from 5% to 4.47% and raised capacity retention from 82.77% to 85.83% after 200 cycles — results from that specific cell build, not a transferable gain.
Slitting then cuts the roll to the electrode width the format requires. It is fast and cheap — under 3% of total manufacturing cost in one published cost breakdown, with web speeds of 80–150 m/min — but its failure mode is serious: burrs and dross at the cut edge can penetrate the separator and create an internal short. Laser cutting offers cleaner edges, and green-laser sources can hold clearance width under 20 µm at much lower speed than infrared fiber lasers. That is why edge inspection and a stated burr acceptance criterion belong in any supplier review.
Vacuum Drying: Controlling Residual Moisture
Oven drying removes the bulk of the process solvent, but that is not the same as meeting the moisture budget later stages require. A web that leaves the oven dry to the touch can still carry enough residual moisture to matter once sealed inside a cell.
Vacuum drying appears at two distinct points. The first sits at the end of electrode manufacturing, where calendered and slit rolls go into batch vacuum ovens or continuous equipment with controlled temperature and dew point zones before entering the dry room. The second is drying of the assembled cell, where the enclosed stack or pouch is baked under reduced pressure after tab welding and before electrolyte filling. These are separate steps with separate equipment, specifications and validation, and treating them as one “drying” step is a common source of confusion. What matters to a buyer is not the equipment list but whether each sequence is validated against a stated residual-moisture target.
The reason to take it seriously is the electrolyte. A lithium salt such as LiPF6 reacts with water, and the hydrolysis pathway can generate hydrogen fluoride, which attacks cathode surfaces, current collectors and the interface the cell depends on. Water is therefore a slow-acting contaminant rather than an immediate fault: it does not stop a cell from working, it changes how long the cell works. These effects rarely show up in routine capacity and resistance checks at end of line, so passing initial electrical tests is not evidence that moisture control has been validated.
Two measurement tools are often confused. Dew point monitoring tracks the humidity of the environment — a dry room, an oven atmosphere, a glovebox — and is a continuous process condition. Karl Fischer titration measures the water content of a sample, such as an electrode, separator or electrolyte batch, and is an analytical result. A supplier that can show both is showing two different kinds of evidence.
These four properties — loading, compaction density, edge quality and residual moisture — travel with the roll into the dry room, where geometry rather than chemistry takes over as the dominant source of variation.
Stage Two: Cell Assembly
Assembly takes the finished electrode rolls and builds the internal cell structure: electrodes and separator interleaved, tabs joined, the stack enclosed and sealed. The dry room is the setting for all of it, because every surface exposed here can absorb moisture that will later react inside the sealed cell.
Winding vs. Stacking: Two Ways to Build the Cell Structure
Winding rolls a cathode, separator and anode together around a mandrel. Stacking places discrete electrode sheets into alternating folds of separator, most commonly by continuous Z-folding, in which an uncut separator web is folded back and forth and electrodes are placed into the folds by vacuum pick-and-place. Paddle-wheel, shingle and roll-to-sheet variants exist mainly to close the throughput gap with winding.
The two routes are not ranked; they suit different constraints. Winding is faster — a mandrel can run at web speeds of several metres per second, whereas a folding arm must complete a full accelerate-place-decelerate stroke for every layer — and suits formats whose geometry allows a continuous roll. Stacking carries higher capital cost and tighter alignment requirements, and suits formats with flat, rectangular electrode layers, which avoid the curved geometry found at the corners of wound jelly rolls.
Neither route removes separator tension as a process variable. A Z-folding line still controls web tension, and a wandering web shows up as fold misalignment, wrinkles and overhang defects; wound cells control tension across the whole roll in the same way.
Whichever route is used, two geometric controls dominate quality. Electrode alignment keeps cathode, anode and separator registered layer by layer, and secondary vision positioning is one way to manage cumulative error. Overhang refers mainly to the geometric margin of the anode relative to the cathode, while separator coverage adds an insulation margin. Abnormal overhang — from electrode dimensional deviation, cumulative offset or separator wandering — is a high-risk defect that can lead to short circuit, leakage, lithium plating and reduced thermal stability. Which route a manufacturer picks depends on cell dimensions, format, throughput targets, placement accuracy and application requirements, so any claim that one architecture cycles better than the other is context-dependent.
Tab Welding and Electrical Connections
Aluminium tabs are welded to the cathode current collector and copper or nickel tabs to the anode. Ultrasonic welding is the most common method, with resistance welding used by some manufacturers depending on cell design.
Welding is a small share of cost — the review cited above puts it at roughly 7.34% of manufacturing cost and under 2% of energy consumption for the cell design it models — but its failure mode is disproportionate. The relevant quantity is contact resistance at the joint, and power dissipated at that resistance follows:
P = I²R
where P is heat in watts, I is current in amperes and R is contact resistance in ohms. The squared current term is what matters: at high discharge or fast-charge currents, a joint with modestly elevated resistance dissipates far more heat than at low current. That local heating raises resistance further, and repeated thermal expansion fatigues the joint. The cited analysis notes that cell temperatures up to 80°C combined with high charging currents can increase connection resistance and lead to tab joint damage.
Cell Insertion and Sealing
The stack is inserted into its enclosure — pouch, hard case or another format matched to the application — and sealed, with the electrolyte fill opening left for the next stage. The seal must hold electrolyte in and atmosphere out for the life of the cell, and casing or seal failure is one of the root causes in the safety-event category of battery failure (PMC11725600). For pouch formats, cup formation must avoid die inclusions that would create thin spots in the aluminium laminate.
Stage Three: Electrolyte Filling and Cell Activation
A sealed cell with no electrolyte is electrochemically inert. Activation is the sequence that turns it into a working product and, in the same sequence, screens out the units that will not behave.
Electrolyte Filling, Wetting and Sealing
Electrolyte goes in under partial vacuum, so it spreads through the porous stack instead of pooling at the fill port. From there, three things have to go right, and each fails in its own way: the right amount goes in, it actually reaches the pores, and the enclosure closes properly afterwards.
Fill quantity. Fill weight determines how much electrolyte is available to wet the electrodes and to cover the consumption that SEI formation and ageing set in motion. How sensitive the cell is to a given deviation depends on its design — electrode porosity, cell dimensions, design fill quantity, and therefore how much electrolyte margin the design carries. Run it short and parts of the stack stay under-supplied; run it heavy and you create handling problems and internal pressure. Gravimetric control covers both: cells are weighed before and after filling and the difference is logged per cell.
Wetting. A filled cell is not a wetted cell. Electrolyte still has to work into the pores of both electrodes and the separator, which takes time at a controlled temperature. The rest period after filling is therefore a specified process step with its own duration and conditions, not buffer time squeezed into the schedule. Skip it and dry regions cannot deliver their share of capacity, so the cell behaves as if it were smaller than it is and ages unevenly.
Seal integrity. Sealing defects rarely stay isolated to one cell. A worn sealing tool, a mis-set welding recipe or a contaminated sealing surface hits every unit that passes through it, which is why these problems show up in batches rather than one at a time.
Detection follows the same logic. Fill weight records confirm the quantity delivered. Wetting rest time and temperature are process records rather than test results and should appear in the routing the supplier can produce. Seal quality is checked by leak testing — pressure-decay or a comparable method matched to the enclosure format — plus, for pouch cells, weighing before and after filling and sealing. Either way, the weighing points and acceptance criteria have to be stated before the numbers mean anything.
Electrolyte is also the moisture carrier in this stage. A study of residual moisture in graphite/NMC622 cells found that the electrolyte’s share of total cell water content was significant and rose with increasing dew point, leading the authors to recommend rigorous moisture management for all steps involving electrolyte handling, including filling and degassing (J. Electrochem. Soc.).
Formation: Establishing the Initial Electrode Interface
Formation is the controlled electrochemical activation performed after assembly and sealing. It begins with an initial charge and may include further charge–discharge steps depending on cell design and process. During that first charge, electrolyte reacts at the anode surface to build the solid-electrolyte interphase (SEI), a nanometre-scale layer that conducts lithium ions but blocks electrons. A stable SEI limits continued electrolyte decomposition while allowing ions through, and its quality influences long-term interfacial stability — although lithium plating during fast charging also depends on temperature, charging rate, electrode design and cell condition.
The formation protocol is a process recipe, not a formality. A typical sequence charges to a low voltage — around 1.5 V is cited — to protect the copper current collector from corrosion, rests for electrolyte wetting, then charges and discharges at a low rate such as C/20 with the rate gradually increased to build a stable SEI. Gas generated during formation must be vented or removed before final sealing. Formation is also one of the most time-consuming steps, competing for rack capacity rather than just electricity: one published cost model for a hypothetical German plant assumes about 8 hours per cell in racks holding up to 800 cells, a figure belonging to that case study rather than to the industry (PMC11532491).
A formation protocol that works in a prototype build does not automatically transfer to production scale, where rack capacity, cycle time and cell-to-cell consistency come into play.
Aging and Initial Cell Evaluation
After formation and degassing, cells are aged under controlled conditions while open-circuit voltage (OCV) is measured to characterize self-discharge. The same cost model assumes 10 days for that step; real routes vary from a few days to a couple of weeks depending on chemistry, format and how tightly the supplier wants to screen (PMC11532491). Aging is a screening window, not idle time. Cells with internal defects or abnormal self-discharge may show faster-than-expected voltage decline, and the rate of that decline (the K-value) flags them for separate evaluation. OCV changes must be interpreted under controlled conditions, since voltage relaxation and other electrochemical effects also influence the measurement — which is why K-value is a screening indicator rather than a diagnosis. Separating normal relaxation from abnormal leakage is the harder part of the step, and it depends as much on test conditions — storage temperature, rest time, measurement resolution — as on the value itself. For a closer look at that distinction, see our guide to normal voltage drop versus abnormal cell leakage.
Cells then go through final inspection and acceptance testing: visual and dimensional checks, weight, seal or appearance checks for pouch formats, OCV, internal resistance, capacity and other specified tests. Cells that pass move on to grading and pack matching; those that do not are quarantined rather than shipped. Each accepted cell now carries its first full electrical characterization — capacity, OCV, AC or DC internal resistance — which becomes the input to the grading system below.
How Manufacturers Control Quality During Cell Production
Quality control in cell manufacturing is not a department at the end of the line. It is a set of measurements distributed across the process: slurry viscosity before the coater, the loading trend across a coating run, tension logs on a folding line, weld resistance records, dry-room dew point history, per-channel formation data. What matters to a buyer is not whether a manufacturer has QC but how those measurements are organized into a system.
Process monitoring and statistical process control
Statistical process control (SPC) treats each critical parameter as a distribution to be held inside specification limits, not a value checked once. The parameters that matter are the ones established earlier: slurry viscosity and solids content, areal loading and coating thickness, compaction density, electrode width and edge quality, alignment and overhang, weld resistance, fill weight and dry-room dew point.
A useful framework comes from the battery-quality literature, which models a metric such as electrode overhang as a Gaussian distribution bounded by specification limits and identifies four levers: expanding the limits, shifting the mean, tightening the distribution, or improving inspection (PMC11725600). Tightening the distribution improves consistency and better inspection improves detection; expanding limits or shifting the mean does not, by itself, improve quality. The same source notes that test location is a trade-off: an upstream test minimizes wasted material and time because problems are caught near their source, while a downstream test maximizes detectability because some defects only appear after formation.
Digital infrastructure supports this. Traceability systems record production parameters throughout manufacturing and map them to specific batches, electrode sheets or cells, while predictive-maintenance sensors on mixers and formation racks flag deviations before they become failures (Fraunhofer FFB whitepaper). Without it, a field failure is an anecdote; with it, it is a data point traceable to a coating run or a weld recipe.
Electrical testing and cell grading
Grading assigns every cell to a bin based on measured performance, and matching places cells of similar characteristics into the same pack. Each parameter reveals a different part of the picture:
Parameter | How it is measured | What it reveals |
|---|---|---|
Discharge capacity (Ah) and energy (Wh) | Full CC-CV charge, then constant-current discharge at a defined rate and temperature | Usable charge; sets string capacity in series configurations |
DC internal resistance (DCIR) | Voltage response to a current pulse of defined amplitude and duration at a defined state of charge, temperature and pulse profile | Power capability and heat generation; a starting point for estimating current sharing in parallel groups, which also depends on connection resistance, state of charge, temperature and how dynamic the load is |
AC internal resistance (ACIR) | Impedance at a single frequency, typically 1 kHz | Fast screening of ohmic resistance; does not capture charge-transfer or diffusion effects |
Open-circuit voltage (OCV) | Rested terminal voltage under controlled temperature | State-of-charge consistency before assembly |
Self-discharge rate (K-value) | Change in OCV over a controlled storage period | Abnormal self-discharge, a screening signal that points to further investigation rather than a specific defect |
Coulombic efficiency | Ratio of discharge to charge capacity | Side reactions and parasitic losses; an early indicator of ageing |
This table draws on Arbin’s guide to cell grading and matching.
Measurement precision sets the limit on how finely cells can be graded, and the arithmetic is checkable on any bench. In one laboratory demonstration reported by Arbin, a tester with ±2 mV accuracy on a 10 V span means two channels reading the same voltage can differ by up to 4 mV, so a spread of 2–4 mV is within measurement capability and does not establish that cells differ. Under parallel load in that setup, readings differed by about 9 mV, which the author attributes to connection-path resistance rather than to the cells — 9 mV at 0.67 A is roughly 13 mΩ of path resistance, about half the cells’ internal resistance. Those numbers belong to that arrangement; the transferable point is procedural. A grading specification tighter than the tester’s own resolution is not a real specification.
Coulombic efficiency is worth keeping as a concept regardless of formula, because it is always reported against a defined cycle and test condition. A cell that returns 99.5% of what it received behaves differently from one that returns 99.0%, and the difference compounds over hundreds of cycles.
Manufacturing traceability and batch consistency
Traceability is the ability to connect a finished cell back to the material lots, process parameters and inspection records that produced it — the foundation underneath every question a buyer can ask later.
Batch consistency is the aggregate outcome, measured as the spread of capacity, resistance and self-discharge across a production lot, most often expressed as the coefficient of variation:
CV = (σ ÷ μ) × 100%
where σ is the sample standard deviation and μ is the sample mean of the measured parameter. CV is used rather than a mean alone because two lots can share an average and differ completely in how tightly they are held:
Metric | Batch A | Batch B |
|---|---|---|
Mean capacity | 20 Ah | 20 Ah |
Standard deviation | 0.10 Ah | 0.30 Ah |
CV | 0.5% | 1.5% |
Both lots center on the same capacity, but Batch B is three times as dispersed. These numbers are hypothetical, used to explain the statistic; they are not industry benchmarks or supplier data.
CV has to be read with discipline. It is not a single quality score and should not be compared across different attributes as if the numbers were commensurate. Capacity, DCIR and self-discharge each warrant their own CV, and any comparison is only meaningful when sample size, test temperature, state of charge, test method and statistical scope are stated alongside it. CV is also no substitute for specification limits, outlier checks or process capability analysis: a lot containing a few badly deviant cells can still show an acceptable CV, so the tail has to be inspected separately.
How Manufacturing Variations Affect Battery Cell Performance
The table below connects process drift to the performance consequence a buyer would eventually observe. The relationships are conditional: a drift outside the control window creates exposure, but the magnitude depends on cell design, the severity and duration of the drift, and how the pack uses the cell.
Process variation | Immediate physical effect | Downstream performance consequence | What to verify |
|---|---|---|---|
Incomplete slurry dispersion | Conductive additive agglomerates; localized high-resistance regions | Higher internal resistance; uneven current distribution; under demanding charge conditions, a higher risk of lithium plating | In-line viscosity and particle-size data; filter and gel-particle checks |
Areal loading drift or cross-web non-uniformity | Local capacity imbalance; N/P ratio shift | Capacity spread within batch; anode-limited fast charge; a contributing factor in cycle-life loss | Loading measurement method and sampling frequency; single- vs double-side basis |
Excessive calendering (over-densification) | Porosity reduced below target | Higher ionic resistance; degraded rate capability; electrolyte wetting difficulty | Compaction density target with stated thickness basis; porosity spec |
Slitting burrs or dross | Edge defects on electrode | Potential separator penetration and internal short; self-discharge outliers | Edge inspection method; burr acceptance criteria |
Layer misalignment or insufficient overhang | Reduced separator/anode margin | Insulation margin loss, short-circuit risk, leakage, reduced thermal stability | Vision alignment data; overhang distribution against spec limits |
High-resistance tab weld | Elevated contact resistance at joint | Local heating under high current (P = I²R); thermal fatigue; weld failure | Weld resistance monitoring; pull-test or inspection records |
Residual moisture in stack or electrolyte | Water reacts inside the sealed cell | Gas generation, SEI degradation, capacity fade, swelling | Dry-room dew point logs; electrolyte handling protocol; moisture specs |
Incomplete electrolyte wetting | Dry regions in electrode pores | Localized current concentration; uneven ageing; capacity shortfall | Fill weight records; wetting rest time in process routing |
Seal integrity deviation | Marginal weld or heat-seal; reduced gas-tightness | Electrolyte leakage or moisture ingress; a common-cause failure that can affect a production block | Leak-test method and acceptance criteria; seal parameter records; weighing points for pouch formats |
Formation recipe deviation | Non-uniform or incomplete SEI | May contribute to elevated self-discharge, reduced cycle life or less stable fast-charge behavior, depending on cell design and the formation process | Formation current/voltage/temperature records; per-cell process data |
Two cautions apply. First, several rows describe risks that are managed routinely; their presence here is not evidence that a given supplier suffers from them. Second, the rows interact: moisture and over-densification together are worse than either alone, because poor wetting in a low-porosity electrode leaves dry regions that concentrate current. Process control is a system property, which is why a single impressive datasheet figure says little about batch consistency.
What Should Battery Buyers Look for in a Cell Manufacturer?
The questions below are written to elicit evidence rather than assurances. A supplier with a real process control system can answer them with data; a supplier without one tends to answer with adjectives.
How are electrode loading and coating uniformity controlled?
Look for the measurement method (beta gauge, X-ray or gravimetric), the sampling frequency across web width and length, the stated tolerance, and whether the reported basis is single-side or double-side with or without foil thickness. Ask for a capability figure — the spread of loading against specification — rather than a nominal value.
How does the manufacturer monitor moisture?
The relevant evidence is dry-room dew point logs, incoming material moisture checks, electrolyte handling protocol and the moisture specification applied before filling. Ask which parameters are checked on every cell and which are sampled by lot.
What inspection methods are used for alignment and welding?
For alignment, ask about vision systems, how cumulative layer error is managed, and the overhang specification and its distribution. For welds, ask about weld resistance monitoring, pull testing, acceptance criteria, and whether weld data is recorded per cell.
How are capacity and internal resistance graded?
Ask for the grading parameters, test conditions (rate, temperature, pulse duration for DCIR, frequency for ACIR), bin widths and the measurement precision of the equipment. A bin width narrower than the tester’s resolution is not a meaningful grade.
Can records be traced to individual cells or batches?
Ask what is recorded, at which steps, and how far back the linkage goes — to a coating run, an electrode sheet, a formation channel, a specific cell. Ask how a field failure would be investigated and what the typical turnaround is.
From Cell Manufacturing Quality to Battery Pack Reliability
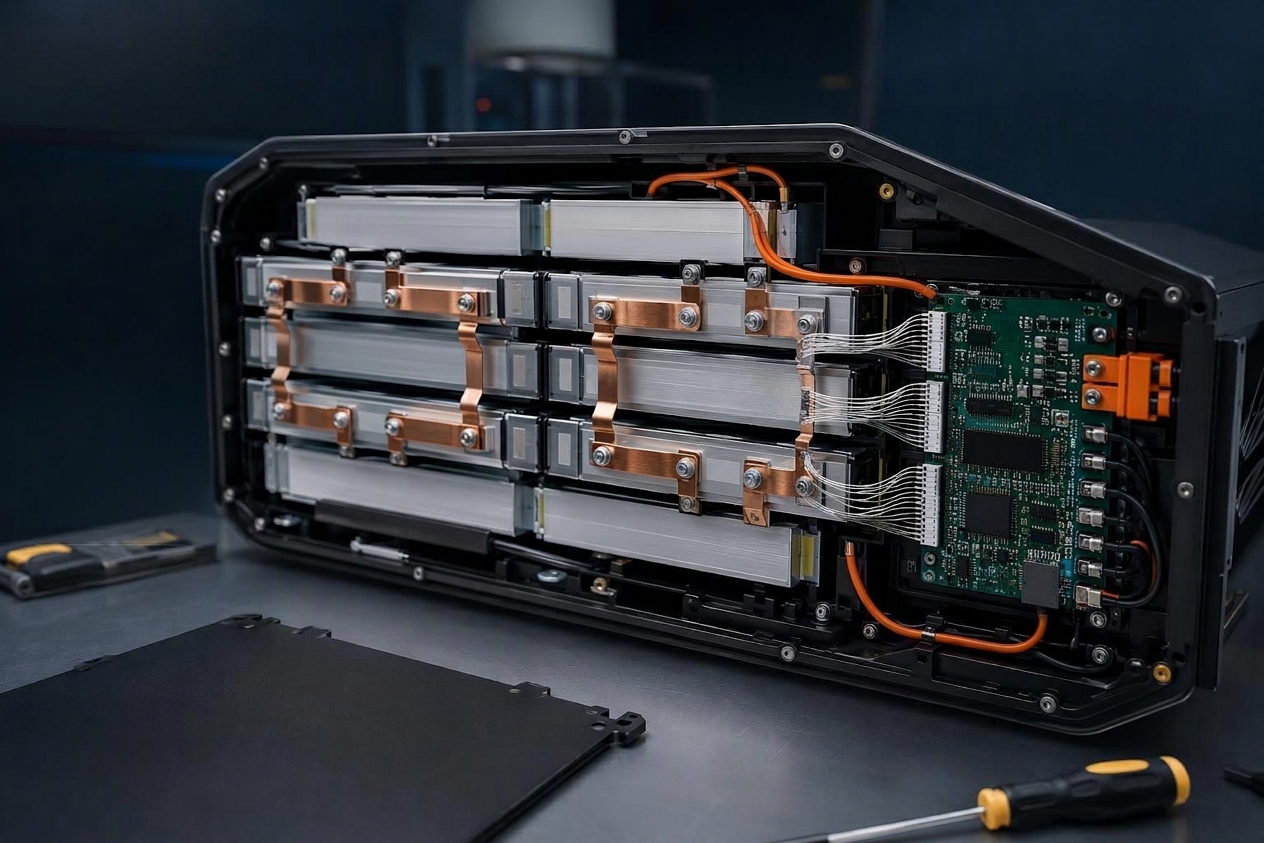
A pack is a system of cells that has to behave as one, and cell differences make that harder. In a series string, cell-to-cell differences can limit usable capacity and power, particularly when one cell reaches its voltage or temperature limit first. BMS balancing and pack-level design help manage those differences but cannot fully compensate for fundamental variation in cell characteristics. A 2026 analysis in Nature Energy puts numbers behind this for road vehicles: working from more than three years of operational data on 116 passenger EVs with NMC packs and 17 electric buses with LFP packs, the authors estimate each cell’s capacity and resistance and derive pack-level metrics. Their fleet-average result is that roughly 6% of otherwise accessible pack health is unavailable because of the weakest cells in passenger cars, with a larger penalty for buses; the same work notes that raw-material quality, manufacturing variability and improper cell grouping create cell-to-cell variation before a pack is ever used (Nature Energy). Two boundaries matter: the study is observational, so its indicators mix intrinsic degradation with usage and thermal history, and its dataset is EV fleets, not drone or industrial packs.
The mechanisms run through four channels:
Capacity consistency. Cells in series carry the same current, so usable capacity is limited once the weakest cell hits its voltage limit, and a wide spread pushes usable pack energy below the sum of nameplate ratings.
Internal resistance. Parallel cells share current according to the impedance of the whole path — cell plus busbar and connection resistance — so a high-resistance branch carries less current and dissipates more heat for what it carries.
Temperature rise. Resistance heterogeneity produces uneven heat, and uneven heat accelerates uneven ageing — a feedback loop unless the thermal design contains it.
BMS balancing load. Balancing can only move charge within its current and time limits, so a wide initial spread consumes headroom otherwise available for in-service drift.
For high-power applications such as UAVs, cell quality is necessary but not sufficient. A drone pack operates at high discharge rates, in a structure whose thermal path and mechanical constraint are designed by the pack builder, under mission profiles with specific burst and cruise demands. A cell with excellent grading data can still underperform in a pack whose busbar resistance, cooling path or discharge-rate margin is mismatched to it. The right evaluation combines cell-level evidence with pack-level design and system-level duty cycle; when cells are sourced externally, the buyer should also understand how incoming quality is verified before assembly. For the distinction that matters most when comparing specifications, see cell-level versus pack-level energy density.
Consistency Is Built into Every Manufacturing Step
Consistency is not a step that can be added at the end of a line. It is the cumulative result of dozens of decisions — how long the slurry is mixed, how tightly loading is held across the web, how much the electrode is compressed, how well the layers are registered, how clean the weld is, how dry the room is, how precisely formation current is delivered, and how honestly grading data is reported. Each step solves a specific problem; each one, uncontrolled, creates a specific exposure.
For buyers, the practical translation is that the question worth asking is not “what are your specifications” but “what evidence can you show me that you hold them.” Specifications describe intent; distributions, inspection records, traceability links and life-cycle validation describe capability.
The next practical step is to take the questions above into a supplier conversation and ask for the data behind each answer — loading distributions, dew point logs, bin widths against tester resolution, and traceability that reaches a specific cell.



 Italiano
 English
 Español
 한국어
 Deutsch
 Français
 日本語
 Русский
 Bahasa Indonesia
 ไทย
 العربية
 Português do Brasil
 Nederlands