

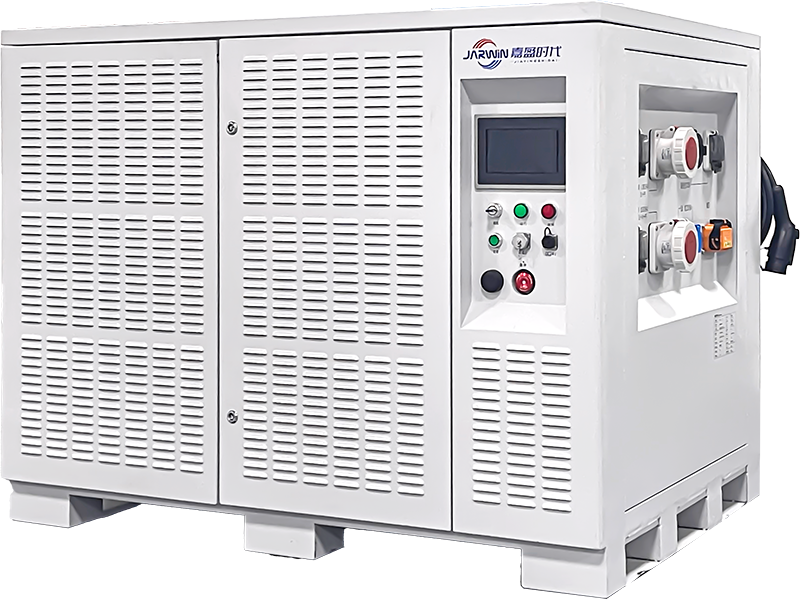





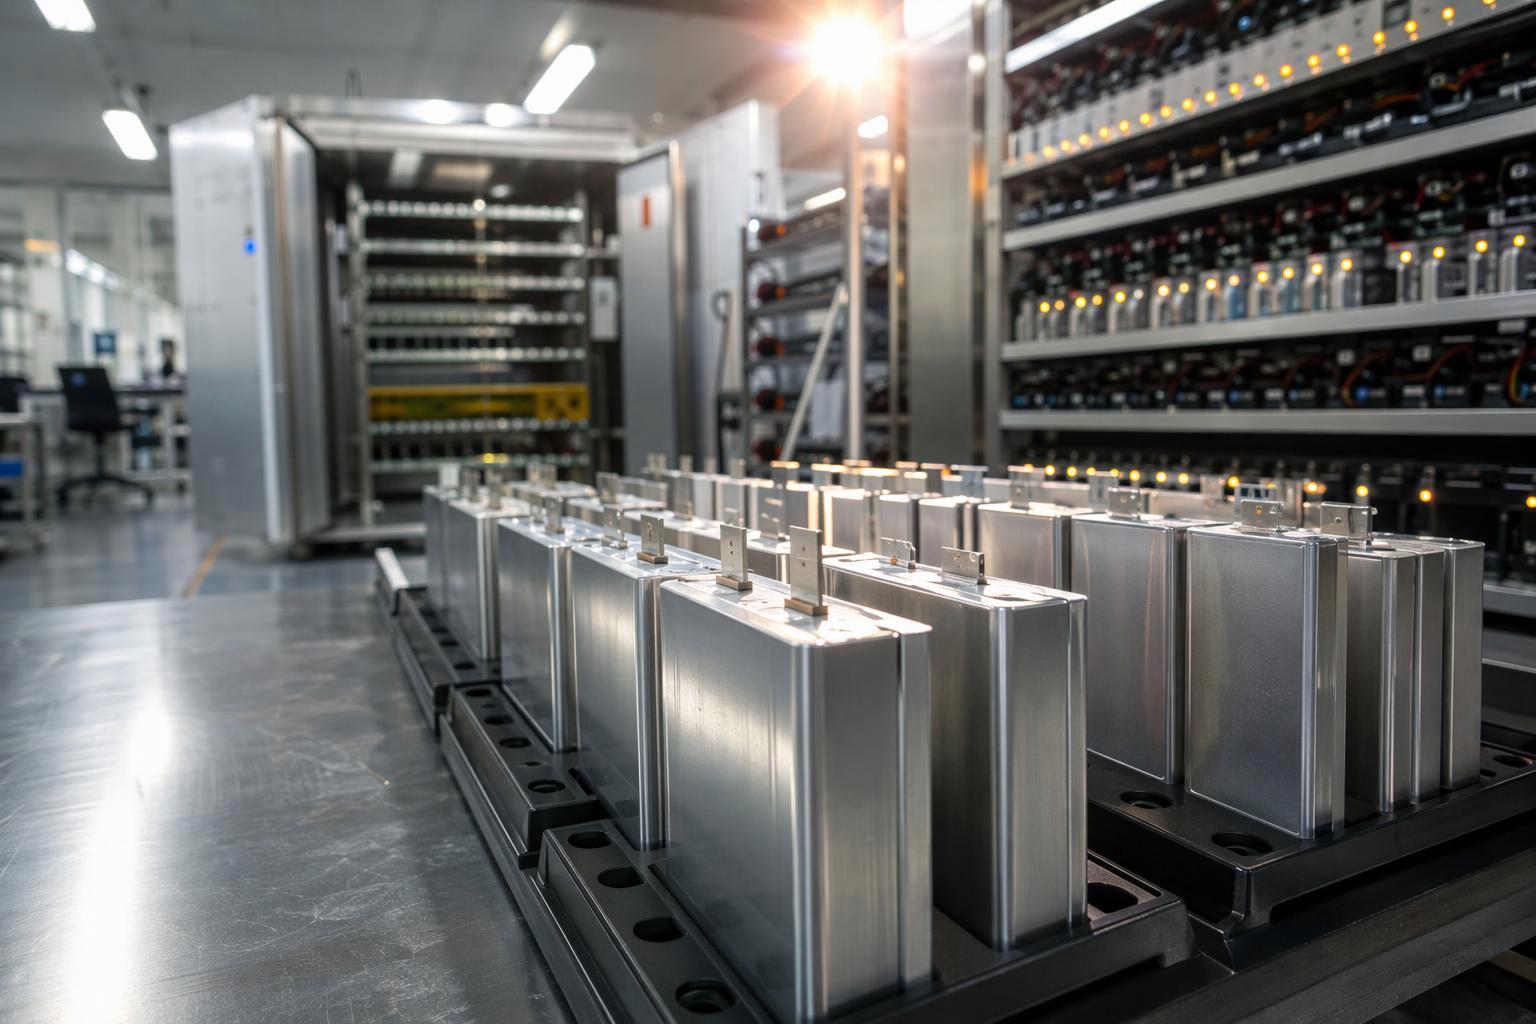
Walk into a lithium-ion plant and you will see cells that already look finished — sealed, welded, terminals in place — sitting in racks before disappearing into a temperature-controlled room for days. They are being formed and aged, and that delay is where much of a cell’s eventual reliability is decided.
Assembly gives a cell the right geometry and the right materials in the right places, but not yet a defined electrochemical interface. Formation builds that interface, as the controlled first charge grows a passivation layer on the anode. Aging then lets the cell settle and measures whether the settled state holds, so abnormal cells can be caught before they disappear into a pack.
Formation sets initial performance; aging and testing reveal whether that performance survives. Both matter beyond the cell factory, because a pack inherits whatever consistency — or inconsistency — its cells bring to it. This article follows that chain from the formation rack to the aircraft, and closes with the questions worth putting to any cell supplier.
What Is Battery Cell Formation?
Formation is the controlled electrochemical activation process performed after a cell has been assembled and sealed. It typically involves an initial charging sequence and may include additional charge–discharge cycles, depending on the cell design and manufacturing process.
Before formation, the cell is a physical assembly: electrodes, separator, electrolyte, and hardware, with no established working interface between the electrolyte and the active materials. Formation is the process step that turns that assembly into an electrochemically defined product.
It is not a capacity test and it is not a quality inspection. It is a manufacturing operation with its own recipe — current levels, voltage limits, temperature, mechanical pressure, and rest periods — and the shape of that recipe determines what kind of interface the cell ends up with.
How Formation Works
Formation proceeds through a sequence rather than a single charge:
Initial charging. The cell is charged for the first time, usually slowly and in stages. Current is kept low at the start because the reactions at the anode surface are still being established and are sensitive to how fast charge is delivered.
Electrochemical reactions at the interface. As lithium moves from the cathode to the anode, electrolyte components react at the anode surface. Those reactions spend a little lithium and electrolyte to build a solid layer on the anode.
Controlled formation cycles. Instead of one charge, formation usually runs a defined series of charge and discharge steps, sometimes with rests in between, so the layer builds gradually rather than in a single abrupt event.
Post-formation checks. After the formation sequence, cells may undergo controlled rest periods and initial electrical checks. These provide a baseline for subsequent aging, capacity testing, and quality evaluation.
Formation is a process with parameters, not a fixed procedure. A 2024 review of lithium-ion cell formation in Energy & Environmental Science treats formation as a coupled design problem, in which current profile, voltage limits, temperature, stack pressure, degassing, and rest periods all interact with the electrode and electrolyte design of the cell — and notes that a protocol suitable for one chemistry does not transfer directly to another. Battery Design’s overview of formation and aging makes the same point at a smaller scale: the temporal shape of the current during the first charge measurably affects how uniform and stable the resulting film is, so the same average current delivered differently over time produces different thickness and coverage.
Why SEI Layer Formation Matters
The layer built during formation is the solid electrolyte interphase, or SEI. It is a nanometer-scale film that grows between the anode and the electrolyte — a protective skin the cell grows for itself, thin, self-forming, and difficult to replace once it goes wrong.
The SEI is a passivation layer, meaning it is electronically insulating but ionically conducting. It has to block electrons, or the electrolyte would keep decomposing against the anode. It also has to let lithium ions through, or the cell could not function. The description traces back to Peled’s 1979 model of a solid electrolyte interphase acting as a solid electrolyte between electrode and electrolyte, as summarized in computational reviews of SEI modeling.
During the first charging steps, electrolyte components are reduced at the anode surface. That reaction produces a mixture of inorganic and organic compounds, and together they build up into the film. What ends up on the anode depends partly on the cell chemistry and partly on the formation conditions it was exposed to.
A well-formed SEI separates the electrolyte from the anode and limits further decomposition. A defective or porous film does neither. Electrolyte keeps being consumed, the film keeps growing and patching itself, and the cell loses cyclable lithium in the process.
Repair also has a mechanical cost. Graphite expands and contracts on every cycle, so the film has to survive movement, not just chemistry. Once it cracks, fresh anode surface meets the electrolyte and the film is rebuilt at the price of more lithium. A review of SEI characterisation in Electrochimica Acta describes the layer in these terms — a protecting film formed mainly during the first cycle, whose composition and morphology decide how well it protects. The 2024 formation review adds the process angle: SEI and CEI composition, gas generation, irreversible capacity loss, impedance, and rate capability all respond to how the first cycles are run.
Then comes the numbers on the datasheet. The first charge never reverses completely. Some lithium goes into building the film and shows up as initial capacity loss — normal, expected, and not a defect. What does vary is how much is lost, and how stable the film stays afterwards. Too thick, and the film adds ionic resistance and pulls down rate capability. Too thin or incomplete, and the interface stays exposed. Because the film keeps growing and repairing itself through cycling, its condition is one of the main reasons two cells of the same design fade at different rates — one that coasts for thousands of cycles, another that loses capacity noticeably within a few hundred. The distinction is worth checking on paper too, which is why a cycle life test report is only meaningful when the test conditions are spelled out.
For a pack designer, the first charge is a process decision with downstream effects. Current level, temperature, and applied pressure are the levers a cell maker uses to influence film uniformity, and pressure is the least discussed of the three. Cells are held under constant clamp pressure during formation for a physical reason: good contact between the electrode stack and the electrolyte is what lets the film grow evenly rather than patchily, and a conformable clamp keeps that contact consistent from the first cell of a batch to the last. A line that applies pressure loosely, or that doesn’t record it, has given up control of one of its three main levers.
How repeatably those levers are applied is where suppliers actually differ. The stronger ones keep the formation recipe as a stored, versioned process library per product instead of a setting an operator dials in at the start of a shift, and their cells hold tighter distributions on capacity, impedance, and cycle life.
Gas Generation and Degassing
Formation is not a clean process. The same reduction reactions that build the SEI also release gas — mostly CO₂, H₂, CO, and a mix of light hydrocarbons from electrolyte decomposition. Traces of moisture in the electrode stack or the electrolyte push the volume up further, because water reacts on the anode surface as well.
Trapped gas causes three problems. Bubbles sitting against the electrode block electrolyte wetting, so the local region forms an incomplete, uneven film. Accumulated gas can also distend the cell and stress the internal structure. And gas left inside the cell keeps taking part in side reactions afterwards, which is a slow drag on interface stability.
That is why most lines degas as they form rather than after. A pouch cell is held in a formation clamp while the gas is pulled out under vacuum through a gas pocket that is still open, and the pocket is sealed only once formation is done. Prismatic and cylindrical cells vent through the fill port and are closed afterwards. Moisture control in the formation room covers the other half of the problem, since less water means less gas to remove. Experienced lines also log the pressure and volume change during formation: a cell that gases more than its neighbors signals an interface problem.
What Happens During Battery Cell Aging?
Following formation, cells may undergo a controlled aging period during which their electrochemical behavior is allowed to stabilize and their voltage characteristics can be monitored. This period also provides an opportunity to identify abnormal self-discharge or other early-stage defects. It is sometimes described as resting, which understates it: aging is an active evaluation window in which the cell either settles or shows that it will not.
Why Cells Need an Aging Period
The period does three separable jobs.
The first is that the cell settles. A cell straight off formation is not in equilibrium: voltage relaxes, local lithium distribution evens out, and interfaces continue to converge. A measurement taken immediately after formation is therefore not yet a stable reading. These changes do not come from one mechanism, so it is more accurate to say the cell is settling than to credit any single process. Battery Design describes aging as a period of repeated cycles at different rates and rest times, run to stabilize electrochemical performance and make the voltage reading more accurate.
The second is a usable signal. Once the cell is at rest, its terminal voltage becomes readable. Under controlled conditions, abnormal self-discharge shows up as a faster-than-expected OCV decline next to other cells from the same batch. Most factories read it as a distribution to be ranked, not a pass mark to be met. The catch is timing: right after formation, voltage relaxation and other electrochemical effects still distort the number. Aging creates the window where a fair comparison is possible.
The third is defect exposure. Internal micro-shorts, contamination, and other manufacturing-related defects may not be apparent immediately after formation. Some become detectable through abnormal voltage behavior during aging, such as a cell losing voltage faster than its neighbors while sitting idle.
One caveat belongs here. A freshly formed cell is still settling, and early transients can distort a self-discharge reading. Work by Roth and colleagues at TU Munich, cited in Battery Design’s self-discharge test procedure, compared voltage-decay, voltage-hold, and capacity-loss methods and found that early transients die away within hours, but slow lithium redistribution across the anode overhang continued to skew every electrical method for weeks. A self-discharge figure taken too soon after formation can overstate the real rate, so the aging period has to be long enough to get past that effect, not merely long enough to fill a schedule.
How Temperature and Storage Conditions Affect Aging
Aging results are only comparable when the conditions are, and three variables decide whether they are. First, though, a distinction worth making: manufacturing aging is the in-plant step used to stabilize cells and screen them, while calendar aging is the slow degradation a cell accumulates in storage or in service. They’re related through the same underlying chemistry, but a screening result is not a prediction of shelf life, and this section is about the first of the two.
Temperature is the first. Self-discharge generally accelerates as temperature increases, though how much depends on chemistry, design, and storage conditions. That is also why elevated-temperature aging works as a shortcut: it speeds up the reactions that expose latent defects. The catch is that a hot-chamber result applies to the hot chamber. It is not a direct stand-in for what the same cell does at room temperature. Storage studies show the same sensitivity — Keil et al. found that capacity fade over months of storage depended strongly on both temperature and state of charge — though that work covers calendar aging, so it is background here rather than the point.
State of charge is the second, and it works through the anode. Higher storage state of charge means a higher anode potential and a harsher condition for the cell to sit in. One aged at high state of charge is not directly comparable to one aged mid-range, even when both land inside the same acceptance window.
Rest time is the variable people forget. The measured voltage drop depends on how long the cell has been resting, so a K-value or self-discharge figure means nothing without its interval. A 48-hour reading and a 7-day reading are two different quantities, not a fast and a slow version of the same one.
This article deliberately gives no fixed aging duration or temperature range. Different cell chemistries, formats, and process routes use different aging regimes, and a number lifted from one product line would be misleading applied to another. What a buyer should confirm is that the supplier’s aging conditions are defined, controlled, and recorded — not that they match a particular number.
How Manufacturers Monitor Cell Quality During Aging
During aging, the cell is not being cycled, so the measurable signals are electrical and slow. Manufacturers watch a small number of them closely.
Open-Circuit Voltage (OCV) Monitoring
Open-circuit voltage is the terminal voltage of a cell with no load connected. It reflects the cell’s state of charge and, over time, its rate of self-discharge.
OCV is useful during aging because it is simple, non-destructive, and sensitive. Hioki’s technical note on OCV testing explains the logic: a battery with an internal defect self-discharges faster, so its OCV falls beyond a defined limit and the cell can be excluded. The same note makes two points that matter for interpreting any OCV-based claim. First, during aging, OCV should be measured at a constant time interval with high accuracy, because the change being detected is small. Second, temperature sensitivity is significant — a change of just 1°C at the time of measurement can shift OCV by several hundred microvolts. That is why OCV comparison across a batch requires a temperature-controlled environment, and why instruments with temperature compensation convert readings to a reference temperature.
As one example, Hioki indicates that OCV-based defect screening may require approximately 100–400 hours under its described testing approach. Actual aging and screening durations depend on the cell design, chemistry, detection criteria, and manufacturing process. The figure is useful for understanding the order of magnitude — days to weeks rather than hours — and not for setting a schedule.
Self-Discharge and K-Value Evaluation
Self-discharge is the slow loss of stored charge in a cell with no load connected. It comes from parasitic side reactions inside the cell and from leakage paths through the electrolyte, separator, or contamination; a micro-short makes it worse. Battery Design puts the practical stakes simply: the rate affects shelf life, how long a pack can sit before it needs a top-up, and its usefulness in production as a screen for faulty cells. Self-discharge is a characteristic of the chemistry rather than a manufacturing defect in itself, though poor fabrication and handling can increase it, and a quality manufacturer checks the self-discharge of each cell and rejects those outside tolerance.
K-value is the production metric derived from this. It’s the rate of OCV decay across a defined rest interval:
K = (OCV₁ − OCV₂) / (t₂ − t₁)
Here OCV₁ is the open-circuit voltage at the first measurement, OCV₂ is the open-circuit voltage at the second, and t₂ − t₁ is the rest time between them. The result is normally expressed in mV/h. A larger K-value indicates a faster OCV decline under the defined test conditions and may flag abnormal self-discharge behavior. It is a screening indicator rather than a standalone diagnosis of an internal defect.
Two cautions belong with the concept, and they are the reason this article does not quote a threshold:
K-value is an OCV-decay indicator, not a direct measurement of capacity self-discharge. The same voltage drop can correspond to different capacity loss depending on where the cell sits on its OCV-SoC curve, and the conversion is especially weak on chemistries with a flat OCV curve, such as LFP. Our guide to normal voltage drop versus abnormal cell leakage covers how that distinction plays out in practice, and Roth’s comparison of self-discharge test methods shows why the reading itself depends so heavily on when it is taken.
There is no universal K-value threshold applicable to all cells. The acceptable rate depends on chemistry, format, state of charge, temperature, and rest interval. A limit that is strict for one product family may be meaningless for another. What can be evaluated is whether a supplier has defined its own limits for its own product, and whether those limits are applied consistently.
Identifying Abnormal Cells
Screening is not a single test but a set of signals that trigger investigation. In practice, a cell may be flagged when:
its OCV falls outside the batch distribution after a defined rest interval;
its K-value exceeds the supplier’s limit for that product;
its voltage behavior is inconsistent between measurement points;
its capacity or internal resistance, measured at the end of the line, falls outside its grade.
That third signal deserves its own note. A cell that looks normal early and deteriorates as aging continues is the slow-leak pattern a single end-point check tends to miss, which is why some factories track the change in K-value between successive intervals rather than the final number alone: a rising trend says more about a slow leak than any single reading.
What happens next is the part buyers rarely see. A flagged cell is not simply discarded; it is a signal about the process. Abnormal cells may be pulled for electrical diagnostics, imaging, or material analysis, and the test result should trace back to a plausible manufacturing cause and feed back into the line.
Worth keeping in mind: no single metric covers everything. An abnormal K-value names no cause — it only tells you the cell should not go into a pack.
Cell Grading: From Individual Cell Testing to Pack Consistency
Cell grading assigns every cell to a category based on measured performance, so that cells with similar behavior can be built into the same pack. Every cell gets graded, usually at the end of cell production and again at incoming inspection by the pack assembler, as research on capacity grading for second-life applications describes. It is distinct from life-cycle testing, which is a long, destructive test on a statistical sample used to validate that the grading criteria actually predict how cells will age.
Under simplified assumptions, a three-cell series string containing cells rated at 3.00 Ah, 3.00 Ah, and 2.50 Ah may deliver only about 2.50 Ah before the lowest-capacity cell reaches its discharge limit, leaving roughly 0.5 Ah unused in each stronger cell. The simplified model is:
Q_string ≈ min(Q₁ … Qₙ)
That expression describes the ideal case. Real usable capacity also depends on initial state of charge, cutoff voltages, temperature, discharge rate, BMS behavior, and how much the cells have aged — which is why the formula is a starting point for thinking about mismatch, not a complete calculation for an actual pack.
Key Parameters Used in Cell Grading
Grading combines several measurements because each reveals a different aspect of cell quality:
Capacity. Measured by a full charge followed by a constant-current discharge at a defined rate and temperature. Capacity sets the usable charge of a series string, since the weakest cell limits the group.
DC internal resistance (DCIR). Measured from the voltage response to a current pulse of defined amplitude and duration at a defined state of charge. It provides an indication of power capability and resistive losses. In parallel configurations, differences in internal resistance can contribute to uneven current sharing between cells.
Open-circuit voltage. Measured at rest under controlled temperature. It indicates state-of-charge consistency before assembly.
Self-discharge behavior. Measured as OCV change over a controlled storage period, and associated with internal micro-shorts, incomplete formation, or contamination.
Capacity alone is not a sufficient grading criterion. Two cells with identical capacity can still differ in resistance and in self-discharge, and those differences determine how they behave together in a pack.
Why Cell Matching Matters for Battery Packs
The reason grading exists is that a pack is not a collection of independent cells. In a series string, the same current flows through every cell, so the group’s behavior is set by its weakest member. Our breakdown of series and parallel pack configurations puts the capacity case plainly, and it’s the most direct one: the weakest cell determines overall pack capacity. It reaches full charge first and, on the way down, hits cutoff first, so the pack shuts down on undervoltage while the stronger cells still hold charge they cannot deliver.
Resistance mismatch plays out differently, and it bites hardest in parallel. Cells sharing a parallel group split current according to their resistance, so the lower-resistance cell carries more of the load. How much heat that produces depends on current magnitude, pulse duration, state of charge, temperature, and polarization — but the direction is fixed. The harder-worked cell ages faster, and the spread widens.
Voltage imbalance compounds both. Published measurements put a scale on it: manufactured cells are usually matched within 3% on capacity, but drop poorly matched or long-stored cells into a series string and a 150 mV spread at full charge becomes possible — a spread associated with a 13–18% loss of pack capacity. Treat that figure for what it is. Its inputs are narrow: suboptimal or long-stored cells entering a series string. It describes capacity made unusable because one cell hits a limit before the others, not a degradation rate, and not a law that holds for every pack. Read that way, it shows why matching tolerances are a commercial decision rather than a technical nicety.
The feedback loop is what makes mismatch expensive: over many cycles the weakest cell degrades faster than its neighbors, so the gap widens with use. Work on series–parallel packs, such as this study of individual cell parameter differences, looks at how capacity, resistance, and self-discharge spread affect pack energy utilization, and the pattern repeats: variation cuts usable pack energy and pushes some cells harder than others.
The practical consequence is that a cell can be entirely acceptable on its own and still be the wrong cell for a given pack, if its parameters do not match its neighbors.
How Formation, Aging, and Cell Grading Work Together
The three processes are sequential and complementary, and each produces a different kind of information.
Process | Main purpose | Key controls | What is measured | Abnormal signal |
|---|---|---|---|---|
Formation | Establish the initial electrochemical interface | Current profile, temperature, clamp pressure, gas removal | Formation capacity, voltage curve, pressure and gas volume | Low capacity, distorted curve, excess gas |
Aging | Let the cell settle and expose latent defects | Temperature uniformity, state of charge, rest duration, humidity | OCV, K-value, resistance drift | Fast voltage decay, wide drift across the batch |
Cell grading | Sort cells for consistency and reject outliers | Capacity test precision, bin boundaries | Capacity, DCIR, K-value, OCV | Low capacity, high resistance, out-of-limit K-value |
The dependency runs one way: without formation there is no defined interface to evaluate, without aging there is no window in which time-dependent defects appear, and without grading the differences that testing reveals never become a matching decision at pack assembly.
What Should Battery Buyers Look for in Cell Quality Control?
Everything above describes what good cell quality control looks like in principle — and all of it is invisible from the outside. The buyer’s problem is that most of it happens inside a factory, in processes no datasheet shows. The five questions below are answerable in a meeting.
1. Are the formation and aging procedures defined and documented?
Ask for the process specification, not a marketing description — the actual document. A defined procedure states the formation current profile, voltage limits, temperature, applied pressure where relevant, and the aging temperature, state of charge, and duration. Documentation means controlled documents with revision history, not operator knowledge. Then ask whether those parameters are recorded per cell or per batch, because a parameter nobody recorded can’t be traced to a result.
2. Are capacity and internal resistance measured under stated conditions?
Capacity and DCIR are only comparable if you know how they were measured: at what rate, at what temperature, and over what pulse duration. A capacity figure without a C-rate and temperature isn’t a specification — it’s a number. For DCIR, the state of charge at which the pulse is applied matters too.
3. How are abnormal self-discharge results identified and handled?
This one has two halves. The screening half: what rest interval, what temperature control, what K-value or OCV-decay limit applies to this product, and why that limit. The disposition half: what happens to a flagged cell, and does the result feed back into the process? A supplier that can walk you from a failed cell to a manufacturing cause is running a quality system. One that can only say cells are rejected is running a filter.
4. Are grading records traceable by batch?
Traceability means a pack can be tied back to the cells inside it and to the measurements those cells produced, which usually means grading data kept per cell with a batch identifier. Ask how long it is retained. This matters most after a field issue: without batch-level records you can’t bound the scope of a problem, and every unit in the field becomes a suspect.
5. How do cell consistency requirements reach pack assembly?
This is the question that connects cell making to pack building, because grading only creates value if the bins get used. Ask how cells are matched into packs — what tolerances on capacity, resistance, and voltage — and how incoming inspection at the assembler verifies the cell maker’s grades. Listen for whether the matching criteria came from the pack’s own requirements or were inherited from whatever the cell supplier happened to ship.
These five questions aren’t equally weighted, either: for a high-current UAV pack, the matching and self-discharge questions carry more consequence than for a low-rate application, because the cost of an outlier cell is paid under load.
From Cell Quality to UAV Battery Performance
Those buyer questions sit at one point in a longer chain. Cell-to-cell variation caps the consistency a pack can reach, and pack design and a good BMS can manage imbalance but not undo differences in capacity, resistance, or self-discharge. Formation, aging, and grading are therefore not production waiting time: they establish initial performance, observe stability, and control consistency — the three properties a pack inherits.
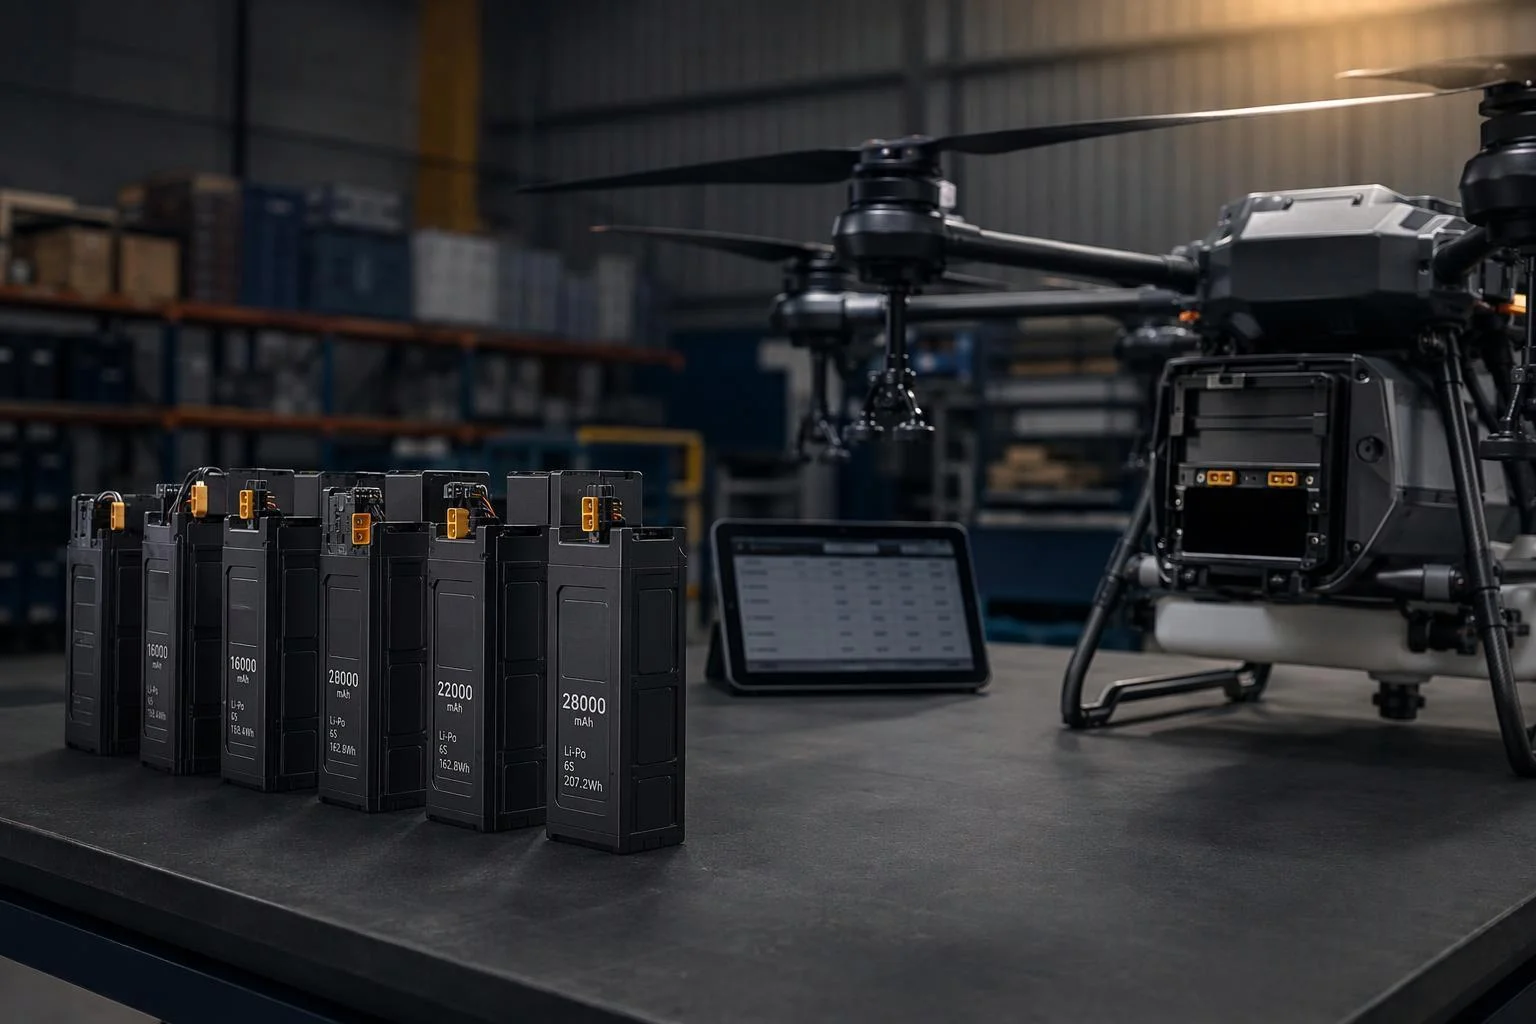
For UAV work, cell consistency is only one slice of battery performance. Pack configuration, current demands, BMS integration, and flight conditions all shape what the pack does in the air. So when you compare custom UAV battery options, look past the cell-level specs and at how selection, pack design, and system testing fit together — which is why the parameters worth defining before custom PACK development start with the load the pack will actually see.
Ask the five questions at the cell level, then follow the same logic one step downstream: how the supplier’s cell data turns into a matching decision, and how that decision is verified before the pack ships.



 Italiano
 English
 Español
 한국어
 Deutsch
 Français
 日本語
 Русский
 Bahasa Indonesia
 ไทย
 العربية
 Português do Brasil
 Nederlands