










Most electric motorcycle battery discussions—whether in a showroom or an OEM sourcing meeting—start with the same shortcut: How many amp-hours is the pack? Sometimes it’s framed as kilowatt-hours, sometimes as “range.” The assumption is always the same: more capacity = a better battery.
In real duty cycles, that shortcut breaks fast. Riders and fleets feel launch torque under load, hill-climb stamina, winter power drop, and whether performance stays consistent after months of heat, vibration, and daily charging. That’s why a “long-range” bike can still underperform: weak takeoff, abrupt power limiting mid-ride, cold-weather collapse, or early derating.
For sourcing teams, the distinction is simple: capacity is what’s stored; performance is what the motorcycle can actually deliver—repeatably, safely, and predictably across temperature and state of charge.
This article is for electric motorcycle OEM product managers, battery/system engineers, and procurement teams. The goal is practical: an evaluation framework you can drop into an RFQ or supplier scorecard. It is not safety certification or regulatory compliance advice; performance limits and acceptance criteria depend on chemistry, pack architecture, duty cycle, and test conditions.
Capacity vs performance: what actually limits a motorcycle
Capacity (Ah) tells you how much charge is stored. Energy (Wh) is capacity multiplied by voltage.
But motorcycles don’t run on “stored energy” in the abstract. They run on delivered power at the terminals, under the exact load your motor controller demands.
A pack can look great on nameplate energy and still disappoint riders in the moments they notice most:
hard launches and overtakes
long hill climbs
hot-weather stop-and-go
cold starts
In practice, the gap between “capacity on paper” and “performance in the vehicle” usually comes down to three system constraints:
Power delivery: internal resistance, voltage sag, current limits
Thermal limits: temperature rise, hot spots, cold constraints
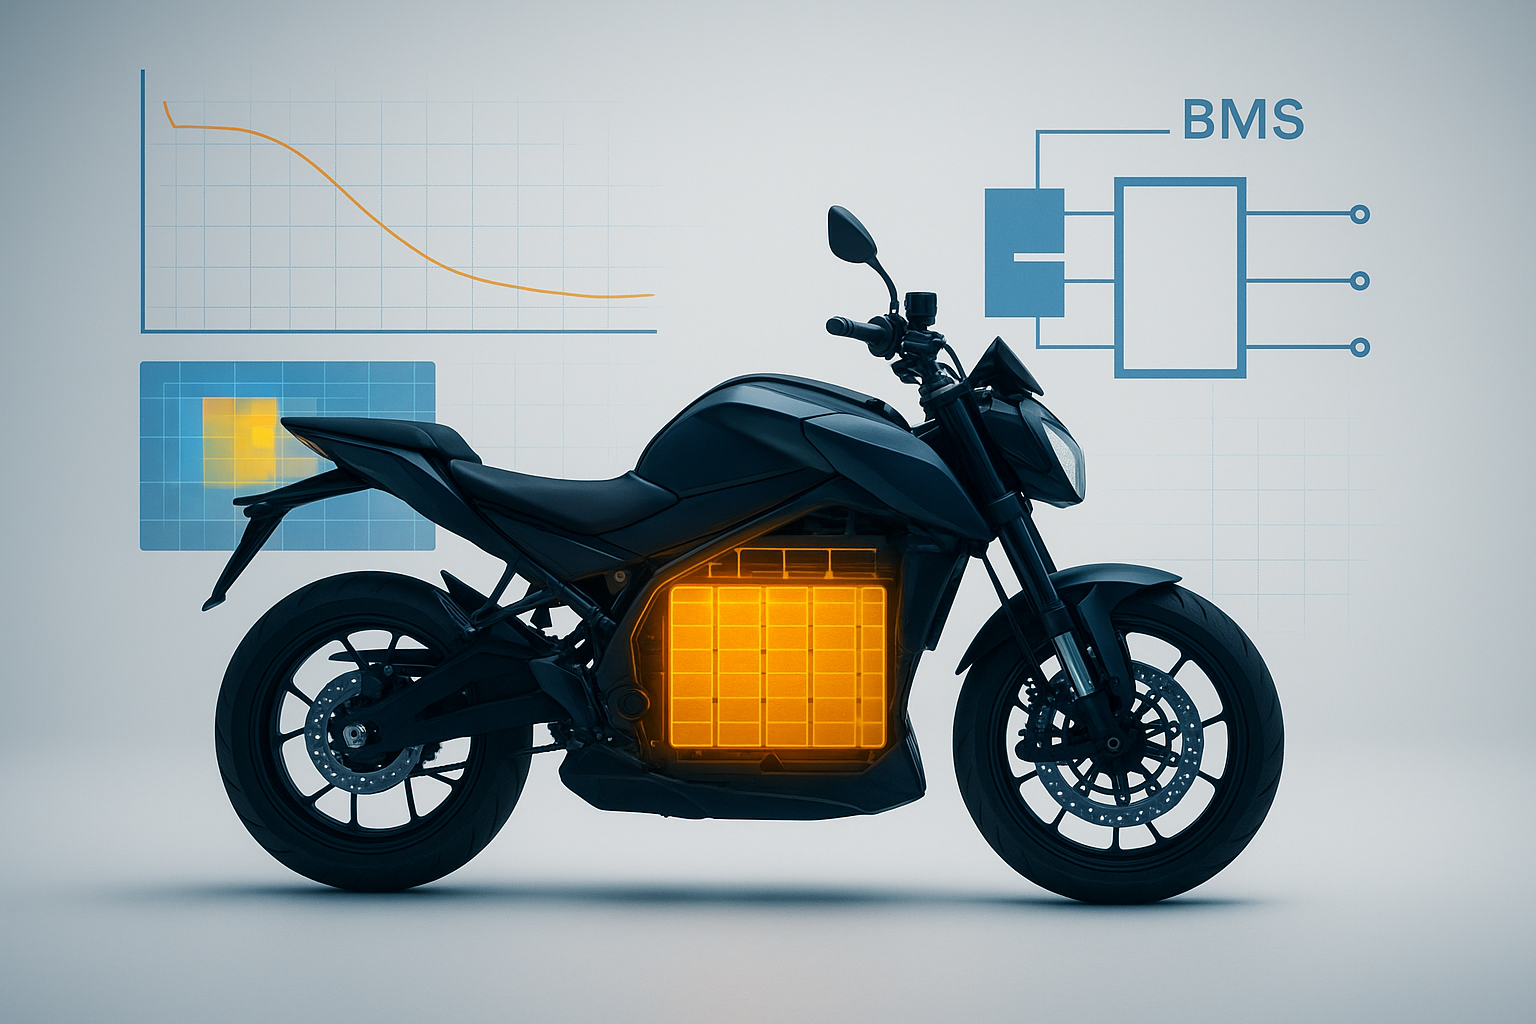
BMS behavior: derating logic, SOC accuracy, balancing, diagnostics
The procurement takeaway is straightforward: electric motorcycle battery performance is determined by the entire battery system—not battery capacity alone.
Power delivery: C-rate, voltage sag, and usable power
When an OEM says a bike feels “weak,” the root cause is often electrical, not capacity.
This matters most in real duty cycles that hit the battery repeatedly: delivery fleets with hundreds of stop-start events per day, scooters that climb long grades at partial SOC, or heavy-load two-wheelers where the rider expects the same launch torque at the end of a shift as at the beginning. In those programs, a “high-capacity” pack that can’t sustain pulse power without sag or early limiting will feel weak—even if the range number looks great on paper.
A useful way to explain it internally is this: capacity tells you how far the bike can go; C-rate tells you how hard the battery can push in the moments that create ride feel. At the pack level, however, C-rate claims are only comparable when the test definition is the same (pulse duration, SOC window, temperature, and cutoff voltage).
Pack C-rate: the missing test conditions
Most teams know the definition. The sourcing risk is how the rating is framed and measured.
At the pack level, you need two numbers—with conditions attached:
Continuous rating: what the pack can sustain without violating voltage, temperature, or life limits.
Peak rating: what the pack can deliver for short bursts, tied to acceleration feel.
If a supplier quotes a claimed “high C-rate” without stating duration, temperature, SOC window, and cutoff voltage, it is not a performance spec—it is marketing.
Just as important: cell ratings don’t automatically become vehicle performance. Connectors, busbars, fuses, wiring, and BMS current limits can reduce what the pack can actually deliver.
Voltage sag and internal resistance: why “same kWh” can feel weaker
Even if your cells can theoretically deliver high current, real vehicle performance is bounded by the pack’s effective resistance and the control limits of the system.
At high current, two things happen simultaneously:
Voltage drops at the terminals (voltage sag)
Heat rises fast (I²R losses)
The impact on the motorcycle is immediate:
Less terminal voltage = less power available to the inverter/controller
More heat = earlier derating, higher aging rate, and larger safety buffers
This is why “same kWh” does not mean “same performance.” Two packs with similar energy can have completely different peak-power capability and different sag behavior.
What matters in procurement is not an isolated “C” label, but the pack’s rate capability curves and the resulting usable power envelope.
Any pack-level number is only meaningful with test conditions attached (SOC window, temperature, pulse duration, cutoff voltage). For clarity, the specific evidence items to request are consolidated in the RFQ/supplier scorecard checklist below so you can compare bidders on the same basis.
Thermal management: the performance limiter you feel later
Even a battery with excellent power capability can’t sustain that performance without proper thermal management.
In practice, the harshest two-wheeler scenarios are often simple: hot soak (after the pack and enclosure have stabilized to a high ambient) plus stop-and-go traffic, repeated hill pulls, and cold starts or cold soak (after stabilization to a low ambient) where resistance spikes and voltage sag shows up immediately. Those are the conditions you want reflected in supplier test evidence—not just a mild ambient bench run.
Thermal management is often the limiter you don’t see until the bike is in riders’ hands. In supplier qualification terms, that’s a warning sign: if the pack can’t stay inside its thermal envelope in your duty cycle, the power you validated on a mild bench test won’t be the power customers experience in the field.
Here’s the chain that connects temperature to rider-perceived performance:
Temperature rise → higher internal resistance → more voltage sag → earlier derating → less usable power
That’s why thermal design isn’t a “reliability extra.” It directly defines the usable power envelope your rider experiences.
One helpful way to evaluate suppliers is to separate passive vs active thermal management at the pack level. Passive approaches rely on enclosure design, conduction paths, and airflow (including simple fan-assisted air cooling) to move heat out, but they have limited control authority. Active systems add closed-loop control—most commonly liquid cooling for heat rejection in high-load or fast-charge programs, and preheating (e.g., heaters or heat-pump integration) to reduce cold-start resistance and voltage sag. The right architecture depends on your duty cycle and ambient extremes, but the key is that each “tier” changes how predictable performance remains across seasons.
A review in the Royal Society of Chemistry discusses how inadequate thermal control can reduce efficiency, accelerate aging, and increase safety risk; see Thermal management challenges in lithium-ion batteries.
Hot and cold: different physics, same sourcing risk
High temperature and low temperature create different engineering problems, but the procurement risk is the same: performance becomes unpredictable.
In hot conditions, repeated high current raises cell temperature and speeds degradation.
In cold conditions, internal resistance rises, voltage sag gets worse, and the pack hits limits earlier—so the rider feels reduced torque and top speed.
Think of temperature as an invisible “multiplier” on resistance and aging. A system that feels fine in a mild lab test can behave very differently in summer heat soak or winter starts.
For two-wheelers, the common “bad surprise” is not catastrophic failure. It’s derating: the vehicle still runs, but it no longer meets the performance customers were sold.
Temperature uniformity and hot spots
Average pack temperature can look fine while a corner runs much hotter.
Hot spots matter because the hottest cells age fastest, imbalance grows, and the BMS has to protect the weakest group—reducing usable power for the whole pack.
To validate it, ask for:
module-level temperature mapping under sustained load
sensor placement vs predicted hot spots
the exact thresholds that trigger derating
What to validate as an OEM
Focus on system behavior and testability, not whether a pack has a fan or a plate. You’re trying to answer one question: will the pack stay inside its thermal envelope in your duty cycle?
The specific validation evidence to request (thermal mapping, sensor coverage, and derating logic proof) is consolidated in the RFQ/supplier scorecard checklist below.
If the vehicle program is targeting fast charging, thermal design becomes non-negotiable. Fast charging simply turns the thermal problem into a performance problem faster—because you’re stacking charge heat on top of discharge heat.
BMS behavior: how intelligence becomes usable power
Even if the electrical and thermal design are both strong, the vehicle’s usable performance is still defined by how the BMS manages those capabilities.
The BMS doesn’t create battery performance, but it determines how much of the battery’s real capability can actually be used.
Many OEM teams treat the BMS as a safety accessory. In reality, it’s also the system that shapes everyday ride feel: how smoothly torque ramps, whether power fades suddenly near mid-SOC, and whether the bike protects itself without jarring cutoffs.
A practical distinction is entry-level vs advanced BMS capability. Entry-level BMS designs typically focus on core protection (voltage, current, temperature) and may use simpler balancing strategies and less robust SOC estimation, which can widen the gap between “nameplate energy” and what riders can actually use day-to-day. More advanced BMS implementations usually improve usable performance through tighter balancing control, better SOC accuracy across temperature and aging, and broader fault coverage with clearer event logs—making both validation and field troubleshooting more repeatable.
For OEM teams, the point isn’t which label the BMS falls under. It’s whether the pack’s usable envelope stays consistent enough to support stable calibration, predictable warranty outcomes, and fast root-cause analysis when something goes wrong in the field.
Current limits and derating logic
Even if the cells can deliver the current, the BMS may cap it based on:
cell voltage limits
temperature limits
pack component ratings (wiring, connector, fuse)
fault history or diagnostic flags
This matters because the motorcycle’s delivered performance is not the cell’s theoretical capability—it’s the BMS-approved operating envelope.
If you want a simple baseline: the BMS watches cell voltage and temperature, estimates state, balances cells, and enforces current limits—those rules are what your controller ultimately “sees.”
SOC accuracy, balancing, and diagnostics
Two issues often get mislabeled as “range problems,” when they’re really system behavior:
SOC inaccuracy (early derating, unhappy riders)
Imbalance and weak-cell behavior (one group hits cutoff early, the whole pack limits power)
Balancing and state estimation directly affect usable energy, cutoff timing, and how stable performance stays over pack life.
In practice, a conservative or poorly-tuned BMS often shows up as rider complaints that sound “non-battery-related”: jerky acceleration, sudden power cuts near mid-SOC, or an SOC gauge that drops in big steps instead of smoothly.
What to request for validation and field support
For MOFU buyers, one of the highest-signal questions is: Can the supplier support validation and field debugging without guesswork?
Rather than duplicating request lists across sections, capture the required logs, reports, traceability, and process expectations once in the consolidated RFQ/supplier scorecard checklist below and in the “Next steps” section at the end.
1) Power delivery
Continuous discharge current at defined ambient and pack temperature
Peak discharge current with defined duration and recovery conditions
Voltage sag under defined pulse loads at multiple SOC points
DCIR method + distribution (measurement window/pulse definition, SOC point, temperature control, and rest time) + distribution (min/avg/max or percentile spread)
Cutoff strategy: undervoltage thresholds and how they map to derating
2) Thermal management
Temperature rise at continuous load (steady-state)
Module-to-module temperature delta under load (uniformity)
Cooling/heating strategy and control logic
Sensor coverage (where temperatures are measured vs where hot spots form)
If a supplier can’t provide pack-level curves and thermal mapping under defined conditions, you’re likely buying a “capacity number,” not a validated power system.
3) BMS behavior
Discharge and charge current limit curves vs SOC and temperature
SOC/SOH accuracy claims tied to method and validation evidence
Cell balancing method and thresholds
Diagnostics: what events are logged, and what the OEM can access
4) Mechanical and environmental robustness
Vibration and shock test coverage relevant to two-wheel duty
Ingress protection assumptions (what is sealed, what is vented)
Connector and harness ratings (thermal and current)
5) Documentation and compliance readiness
Transport compliance documentation (e.g., UN 38.3 where applicable)
Safety test evidence and what is certified at cell vs pack level
Revision control for pack design and firmware
Why better system design lowers warranty risk
Capacity-heavy purchasing can look good on paper (price per kWh), but it often shifts risk into warranty and service when real-world derating and early degradation show up.
Better system-level design—validated power delivery, thermal control, and BMS logic—usually means fewer performance complaints and fewer pack swaps.
Battery performance is a system engineering problem
At sourcing time, it’s tempting to evaluate cells, add up a pack, and call it “performance.” In the vehicle, performance shows up as a chain of constraints:
Cell capability → pack electrical design → thermal behavior → BMS limits → vehicle calibration → rider-perceived performance
That’s why capacity isn’t enough. A pack can look great in nameplate energy and still feel weak if voltage sag forces current limits, if temperature drives derating, or if the BMS has to protect the weakest cell group.
The better procurement question isn’t “How many Ah?” It’s: How much validated performance can this battery system deliver throughout its service life?
Next steps for OEMs: how to run a battery partner evaluation
If you’re sourcing beyond “capacity on a label,” the goal is to make supplier responses comparable and reduce downstream calibration and warranty risk.
Define your duty cycle (peak power, sustained power, ambient extremes, charging behavior). A pack that “looks good” at low-rate capacity tests may fail your actual load profile.
Use the RFQ/supplier scorecard checklist to request the same pack-level curves, derating limits, and thermal evidence from every bidder—under clearly defined conditions.
Lock change control early: agree on pack revision control and BMS firmware versioning so performance evidence remains valid from pilot to SOP.
A strong partner should be able to translate your duty cycle into measurable acceptance tests, deliver decision-grade evidence (not just cell datasheets), and support field debugging with clear logs and traceability as programs scale.






 Français
  English
  Español
  한국어
한국어  Deutsch
  日本語
日本語  Русский
  Bahasa Indonesia
  ไทย
ไทย  العربية
  Português do Brasil
  Italiano
  Nederlands