







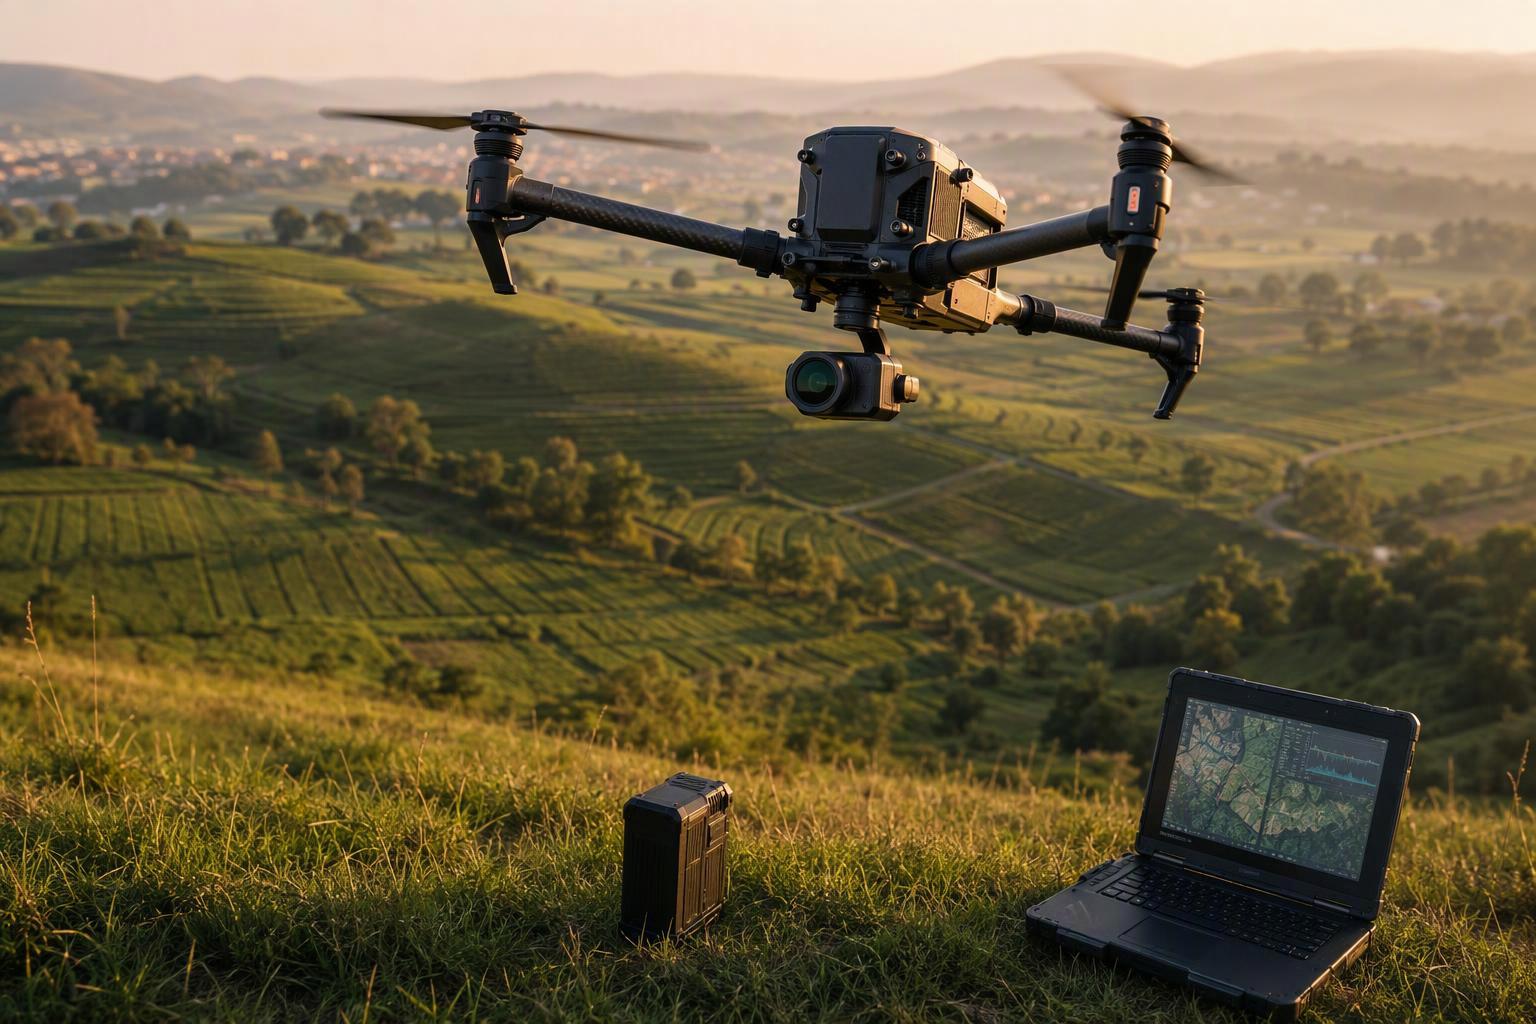
Drone survey coverage per battery is a calculation, not a spec sheet number. The calculation connects four measurable quantities: usable battery energy, average mission power, ground speed, and flight-line spacing. Work through them in order and you get a coverage figure you can defend in a flight plan. The same chain, run backwards, tells you the battery capacity a given mission actually requires.
Advertised endurance rarely survives contact with a real payload. Field guidance from SPH Engineering for a fully loaded DJI M350 RTK with a LiDAR payload, which draws roughly 30 to 35 minutes per battery, suggests planning for 25 minutes of productive survey time and expecting four to six battery swaps per mapping session. That gap between rated and productive time is the whole reason this guide exists.
The coverage estimates in this guide come from Herewin, a battery manufacturer founded in 2019 and run by a team with over two decades in the battery sector. We design and build our own lithium-ion polymer cells and packs, including the drone power products these estimates are based on.
Start With Usable Battery Energy, Not Rated Capacity
Coverage planning starts with one number: how much energy the aircraft can actually spend on the survey. That is not the figure printed on the pack label. Rated capacity in amp-hours describes charge, not work, and the two diverge the moment the aircraft lifts off.
Battery Capacity vs. Battery Energy
Capacity (Ah) and energy (Wh) are different quantities. The relationship is direct:
E = U × Q
where E is total energy in watt-hours, U is nominal voltage, and Q is nominal capacity in amp-hours. Energy is voltage multiplied by capacity, so a 6S pack at roughly 22.2 V nominal and 16 Ah carries about 355 Wh, while a 12S pack of the same 16 Ah carries roughly 710 Wh. Two packs can share an Ah rating and deliver very different usable battery energy for drone surveys. Always convert to watt-hours before comparing options or budgeting a mission.
Why Rated Energy Is Not Fully Usable in a Mission
Nameplate energy is a laboratory figure, not a flight figure. State of charge is a remaining-energy estimate, not a real-time measure of what the pack can safely deliver right now — which is why a pack reading 40% can still fold on the climb-out. Herewin’s engineering team makes this point in Beyond SOC: What Battery Data Does an Industrial UAV Flight Controller Really Need?, noting that voltage sag, thermal derating and aging all cut deliverable power before the percentage looks low.
Usable energy = nameplate energy × a usable-energy factor. Derive that factor from your own flight logs, not from the label.
Estimate Effective Survey Flight Time
Flight time is the bridge between the energy you have and the distance you can fly. Get it from two numbers: usable energy and the average power the aircraft actually draws over the sortie.
Flight Time = Usable Energy ÷ Average Power
Divide usable energy in watt-hours by average mission power in watts, and you get hours of flight. A 44.4 V, 16,000 mAh pack holds about 710 Wh nominal. At a 700 W average draw, that is about 61 minutes of theoretical endurance before accounting for usable-energy limits, reserve, and mission overhead.
Why Average Mission Power Matters More Than Peak Power
Endurance is an energy-balance problem, and a peer-reviewed study on UAV endurance is explicit that the time-integrated average power over the whole sortie governs duration, while short takeoff and climb peaks affect reserve margin and power-system sizing rather than total duration. A pack sized only for peak thrust can still end a mission early if the average draw is high.
Account for Takeoff, Turns, Return and Other Non-Survey Time
Not every second aloft collects data. The chain runs in one direction: total available flight time, minus the non-survey segments, gives productive survey time. Field guidance on mapping missions puts that overhead at roughly a minute, not ten: about 30 seconds for climb, GPS lock and transit to the first waypoint (add 30 seconds if the area of interest sits more than 100 m from launch), plus 30-60 seconds for return-to-home.
Time is only half the story, because the non-survey segments are also the most energy-intensive ones. Takeoff and vertical climb demand two to three times cruise power, and turning consumes roughly 25-35% more than straight-and-level cruise. Across a typical mission, takeoff and climb alone account for an estimated 8-12% of the pack’s total energy, and turn and attitude overhead can add a further 10% on complex terrain. None of that energy produces survey data, so the timing model and the energy model have to agree.
The key is to apply average power only to the segment being modelled. If your 700 W figure already averages the whole sortie including takeoff, climb and return, then subtracting overhead time again would double-count the same energy. Either keep the average power tied to the survey segment, or let total flight time absorb the whole sortie and subtract non-survey time once. Pick one convention and stay with it, because mixing the two is the most common way a coverage estimate drifts high. Get this right, and you have a defensible flight time to work from.
Convert Flight Time Into Survey Distance
Flight time becomes survey distance only after you separate airspeed from ground speed. A given flight time does not translate into a fixed number of kilometres; the distance depends on how fast the aircraft actually moves over the ground while the camera is running.
Ground Speed vs. Airspeed
Airspeed is speed through the air mass, while ground speed is speed over the ground. At constant throttle, airspeed holds steady as wind changes, but ground speed does not, as NASA’s primer on why ground speed is not airspeed explains. Plan survey distance from ground speed, because that is what the flight lines measure.
How Wind Changes Ground Speed and Energy Demand
Headwinds cut ground speed and raise energy consumed per mile; tailwinds do the reverse. The direction of the effect is straightforward: a fixed leg into a headwind takes longer and consumes more than the same leg in still air.
Wind also moves the power requirement itself. Holding a fixed airspeed into a headwind can raise motor power by roughly 30-50%, a tailwind can cut it by 15-25%, and a crosswind costs 20-30% as the aircraft spends power on lateral correction instead of forward progress. Those are directional ranges rather than fixed coefficients, but they are large enough that a plan built on still-air power will not survive a windy afternoon. With a realistic ground speed in hand, the last input you need is how far apart the flight lines sit.
Calculate Survey Coverage per Battery
Coverage is the product of two numbers you have already derived: the effective survey distance from the previous section, and the spacing between flight lines. Once effective survey distance and flight-line spacing are known, coverage is calculated by multiplying the two.
Flight-Line Spacing and Image Overlap
Side overlap determines how far apart the lines sit. Using the standard flight-line spacing formula used in photogrammetry teaching, line spacing equals swath width multiplied by (100 minus sidelap) divided by 100, and the number of lines is the site width divided by that spacing, plus one, always rounded up. Penn State’s Dutton Institute GEOG 892 course text also gives flying height as focal length times GSD divided by pixel size, so altitude and swath are linked before you ever choose an overlap figure.
How much overlap? For photogrammetric mapping, UgCS’s flight-planning team recommends 75–85% front overlap and 60–70% side overlap, rising above 80% for 3D modelling and vegetation.
Overlap never multiplies into the area formula directly. It acts only through line spacing. Multiplying by an overlap percentage double-counts the same geometry and inflates your coverage estimate.
Coverage Area = Effective Survey Distance × Line Spacing
Multiply the two. A 60 m line spacing over 18 km of effective survey distance yields 1.08 km².
Worked Example
Using the following illustrative assumptions: 680 Wh usable energy, 1,200 W average mission power, 10 m/s ground speed, roughly 30 minutes of survey time, and 60 m spacing. This is an illustrative calculation, not a performance claim for any specific aircraft.
Input | Value |
|---|---|
Usable energy | 680 Wh |
Average mission power | 1,200 W |
Effective survey time | ~30 min |
Ground speed | 10 m/s |
Effective survey distance | ~18 km |
Line spacing | 60 m |
Coverage per battery | ~1.08 km² |
18,000 m × 60 m = 1,080,000 m² = 1.08 km². The ~30 minutes of effective survey time already reflects the usable-energy factor, reserve and mission overhead applied to the nominal figure, so read it as a reduced figure, not a nameplate one.
Change any input and rerun the chain from usable energy forward. The sensitivity is worth seeing: hold everything else constant and raise ground speed from 10 to 12 m/s, and effective survey distance grows to about 21.6 km, lifting coverage to roughly 1.30 km². Tighten line spacing from 60 m to 40 m instead, and coverage falls to about 0.72 km² even though the aircraft flew exactly the same distance. Speed and spacing do not pull their weight equally.
Why the Same Battery Can Produce Different Coverage
The same pack can produce very different coverage on different airframes, and the same aircraft can also show significant variation as payload, wind and operating conditions change. Coverage is not a property of the battery. It is the output of a mission flown by a specific aircraft, and the battery only supplies the energy term.
Aircraft and Payload
Camera and altitude set the swath, and the swath sets how many flight lines a given area demands. The altitude-to-GSD relationship is fixed by sensor size and focal length, not by the airframe, so a heavier payload that forces a lower cruise altitude narrows every line and multiplies the number of passes needed to cover the same site.
Flight Speed
Faster cruise covers more ground per minute but shortens the time available before the reserve is touched. In practice, 2D orthomosaic work usually settles around 8-12 m/s and 3D oblique capture around 6-10 m/s, which balances image quality against energy draw. Push past that and the image interval stretches, overlap falls short, and air resistance rises faster than distance gained. Higher side overlap reduces flight-line spacing, which increases the number of passes and the total distance required to cover the same area. That can increase both mission time and energy demand.
Wind and Weather
Headwind on the outbound leg and tailwind on the return do not cancel out. The aircraft flies the same ground track at a higher power setting in one direction, and the energy budget absorbs the difference.
Battery Temperature and Aging
Cold cells raise internal resistance, which is why a pack reading 40% can still fold on the climb-out. Aging compounds the effect: as cells age, available capacity and power capability can decline, reducing the energy you can reliably budget for a mission.
Same pack, different coverage. Aircraft, speed, wind and cell condition each move the number, so quote coverage per mission profile, never per battery.
Battery Weight and Energy Density: The Trade-Off
Every kilogram added to the aircraft increases the energy required to keep it airborne over the mission, so the useful question is not how much energy a pack holds but how much of that energy survives the mass it brings.
More Energy Also Means More Mass
Cell-level energy density determines how much stored energy can be carried for a given cell mass, while the complete pack also includes structural components, wiring, connectors and thermal-management elements. A larger pack raises both sides of the mission energy budget: it carries more watt-hours, and it raises the power the aircraft needs to stay aloft. Depending on the airframe and propulsion system, the additional mass can eventually offset the endurance gained from the extra energy, so adding capacity can shorten the mission instead of extending it.
When Higher Energy Density Can Improve Coverage
For UAVs, cell energy density is only part of the equation. What matters at aircraft level is how much usable energy the complete battery pack adds for the mass it carries. Higher energy density helps when the airframe accepts the same mass and gains capacity, rather than accepting more mass for the same capacity.
Compare candidate packs on usable energy per kilogram of total aircraft mass, not on nameplate Wh per pack.
Chemistry Choices Behind the Number
Energy density is set by the cell chemistry inside the pack, and the main families trade capacity against discharge capability:
Chemistry | Energy density | Discharge rate | Best fit |
|---|---|---|---|
Li-Po (soft pouch) | 100-200 Wh/kg | 30-50C | Lightweight consumer / industrial airframes; strong transient power for takeoff and maneuvering, but weaker long-term stability |
High-density Li-ion | 250-500 Wh/kg | 10-20C | High-end industrial survey aircraft; more stored energy for the same weight, lower steady-cruise draw |
Semi-solid cells | ≥330 Wh/kg | Moderate | Wider temperature range and longer cycle life, reducing energy lost to environment and aging |
The trade is not “best chemistry wins.” A survey platform that cruises at a steady speed for long stretches cares about stored energy per kilogram, while a platform that needs aggressive climb and wind compensation cares about discharge rate. Match the chemistry to the mission profile before comparing numbers.
Why Battery Selection Must Be Aircraft-Specific
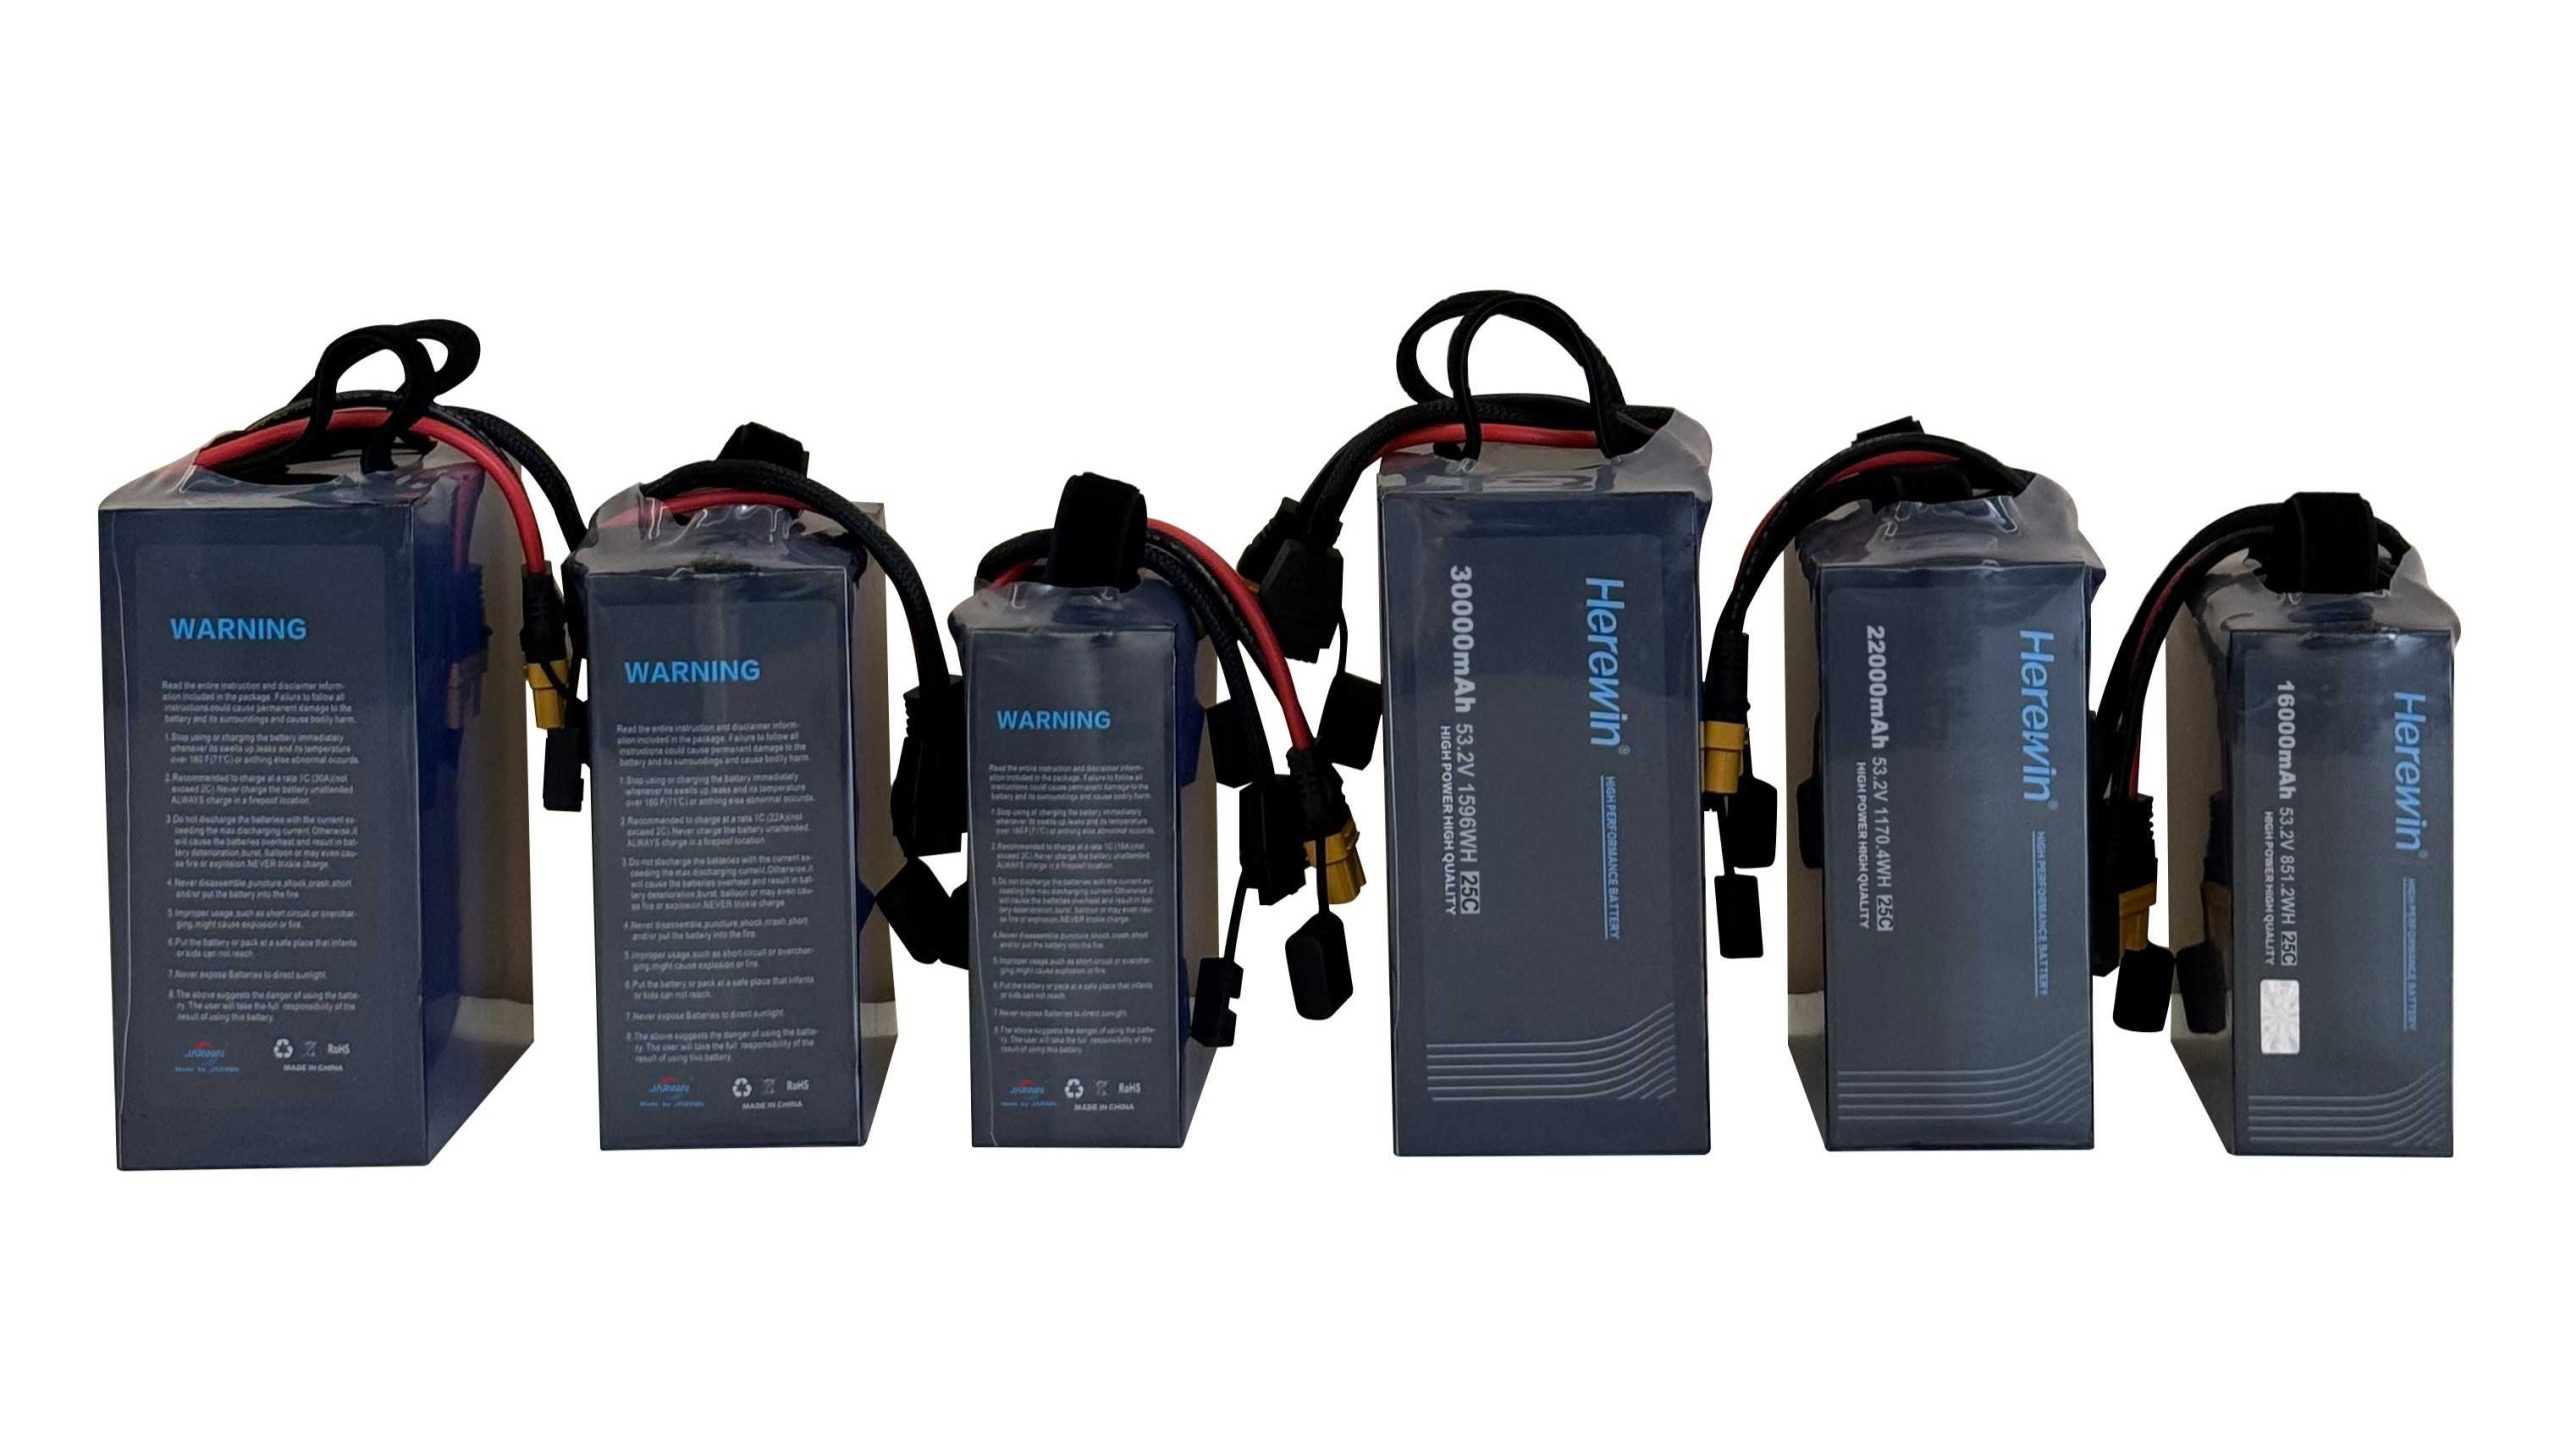
The same pack can be a gain on one airframe and a penalty on another, because the mass penalty depends on the aircraft’s own weight, rotor configuration and payload. It is therefore common for a manufacturer’s catalogue to segment packs by airframe class rather than by survey type — in Herewin’s case, for example, 0-20 L agricultural airframes take 12S/14S packs at 16,000-22,000 mAh, while heavy-duty classes at 62-206.8 kg take 14S/18S packs at 28,000-60,000 mAh. Match the pack to the airframe class first, then compare energy density within that class.
Include a Battery Reserve in Mission Planning
Reserve is not a percentage you look up. It is the energy the aircraft needs to get home from wherever the mission actually ends, and it has to be computed per flight.
Return-to-Home Energy
Return-to-home is a failsafe rather than a guaranteed return, and it should be treated as a fallback. In PX4’s return mode, the autopilot decides to come back using battery thresholds and an estimate of remaining flight time, and that estimate assumes ideal conditions. UAV Mission Control makes the same point from the operator’s side: a headwind on the return leg can double the energy and time needed to get back. Do not treat the RTH trigger as the point at which planned survey work should end. The reserve should cover the actual return leg plus the uncertainty appropriate to the mission.
Weather and Operational Uncertainty
Wind at altitude, not at the launch point, sets the return cost. Add the time the aircraft spends climbing to return altitude and holding before it commits to the route, which comes to roughly 30 to 60 seconds.
Reserve Should Be Based on Mission Conditions
Derive the reserve from return distance, the wind you expect on that leg, terrain and altitude, RTH behaviour, battery condition and your own risk tolerance. Two identical aircraft flying the same field on different days can need different reserves, which is why a fixed band is the wrong input.
How to Size a UAV Battery for a Survey Mission
Sizing runs the coverage calculation backwards. Instead of asking how much area a pack can cover, you start from the mission and solve for the energy it requires. The four quantities above form the core coverage calculation. Battery sizing then adds the aircraft and mission constraints needed to turn that calculation into a battery specification.
Aircraft Requirements
Record the airframe’s all-up weight limit, its maximum takeoff weight, the payload mass the survey sensor adds, and the cruise power the aircraft draws at your intended speed. Note the voltage range the power system accepts and the connector type, because a pack that meets the energy target but not the voltage window is not a candidate.
Mission Requirements
Define the area to be flown, the required ground sample distance, the flight-line spacing that GSD implies, and the total survey distance. Add the return-to-home distance and the reserve margin your conditions justify. The output is a required mission time in minutes, which is the number the next step consumes.
Calculate Required Battery Energy
Multiply average mission power by required mission time to get required usable energy. Then divide by the usable-energy factor you established from your state-of-charge window and thermal derating, which gives required nominal energy. A pack with less nominal energy than the calculated requirement would not meet the mission under those assumptions.
Check Voltage, Current, and Dimensions
Confirm the pack’s nominal voltage sits inside the aircraft’s accepted range, that its continuous C-rate covers average mission power and its peak rating covers takeoff, and that its mass and dimensions fit the bay without pushing the airframe past its weight limit. In practice, the challenge is often matching an available pack to the airframe rather than simply finding enough nominal capacity.
When a Custom UAV Battery Pack Makes Sense
“Just buy a bigger capacity pack” is the most common answer to a coverage shortfall, and it may solve the energy problem while creating a weight or payload problem. A larger pack adds mass, and added mass raises the power the aircraft needs to hold the same flight-line spacing and ground speed. Beyond some point, depending on the airframe, the extra watt-hours can buy less flight time than the weight costs.
Custom packs make sense when the constraint is not capacity but fit: an airframe whose bay, voltage or current ceiling rules out the off-the-shelf options, or a mission profile that needs a specific energy-to-mass ratio rather than more amp-hours.
Energy and Weight Constraints
Custom tooling is justified when no standard pack lands inside the aircraft’s maximum takeoff mass while still carrying the usable energy your reverse-sizing calculation returned. If the closest catalogue pack forces you to trade payload or reserve, the pack is the wrong shape for the mission, not the mission for the pack.
Voltage and Peak-Power Requirements
Match the pack to the airframe’s voltage window and its worst-case current draw, not its cruise draw. Takeoff, climb and wind compensation set the peak, and a pack that sags under that peak will derate or cut out mid-line. This is where configuration range matters: packs that span 6S to 28S with selectable continuous and peak C-rate grades give you room to match the specification rather than force a compromise.
Pack Dimensions, Connectors and Communication
Mechanical and electrical fit decide whether a pack is usable at all: bay dimensions, mounting, connector type, and whether the airframe expects a communication interface for state of charge and state of health. These are the constraints that most often rule out a catalogue pack before energy is even considered.
Validation Before Production
A custom specification is only as good as the process behind it. Look for a documented cell-to-pack build process with defined production steps, inspection stages and recognised certifications, then validate the finished pack against your own flight logs before committing to a production run.
A survey battery should be sized around the mission, not picked from an Ah number or an advertised flight-time figure. The chain runs in one direction: usable energy sets effective survey flight time, flight time at ground speed sets survey distance, and distance times flight-line spacing sets the coverage one pack can deliver. Change the payload, the wind, the altitude or the reserve you carry, and the same pack returns a different number.
Work the chain backwards for your own aircraft and you get a specification rather than a guess: the energy the mission needs, the voltage and continuous C-rate the airframe draws, and the mass and dimensions the bay will accept.
If you would like that turned into a pack specification, send us your aircraft voltage, average mission power, payload, target flight time, battery weight limit and available dimensions, and our engineers will size it with you.
 Français
  English
  Español
  한국어
한국어  Deutsch
  日本語
日本語  Русский
  Bahasa Indonesia
  ไทย
ไทย  العربية
  Português do Brasil
  Italiano
  Nederlands