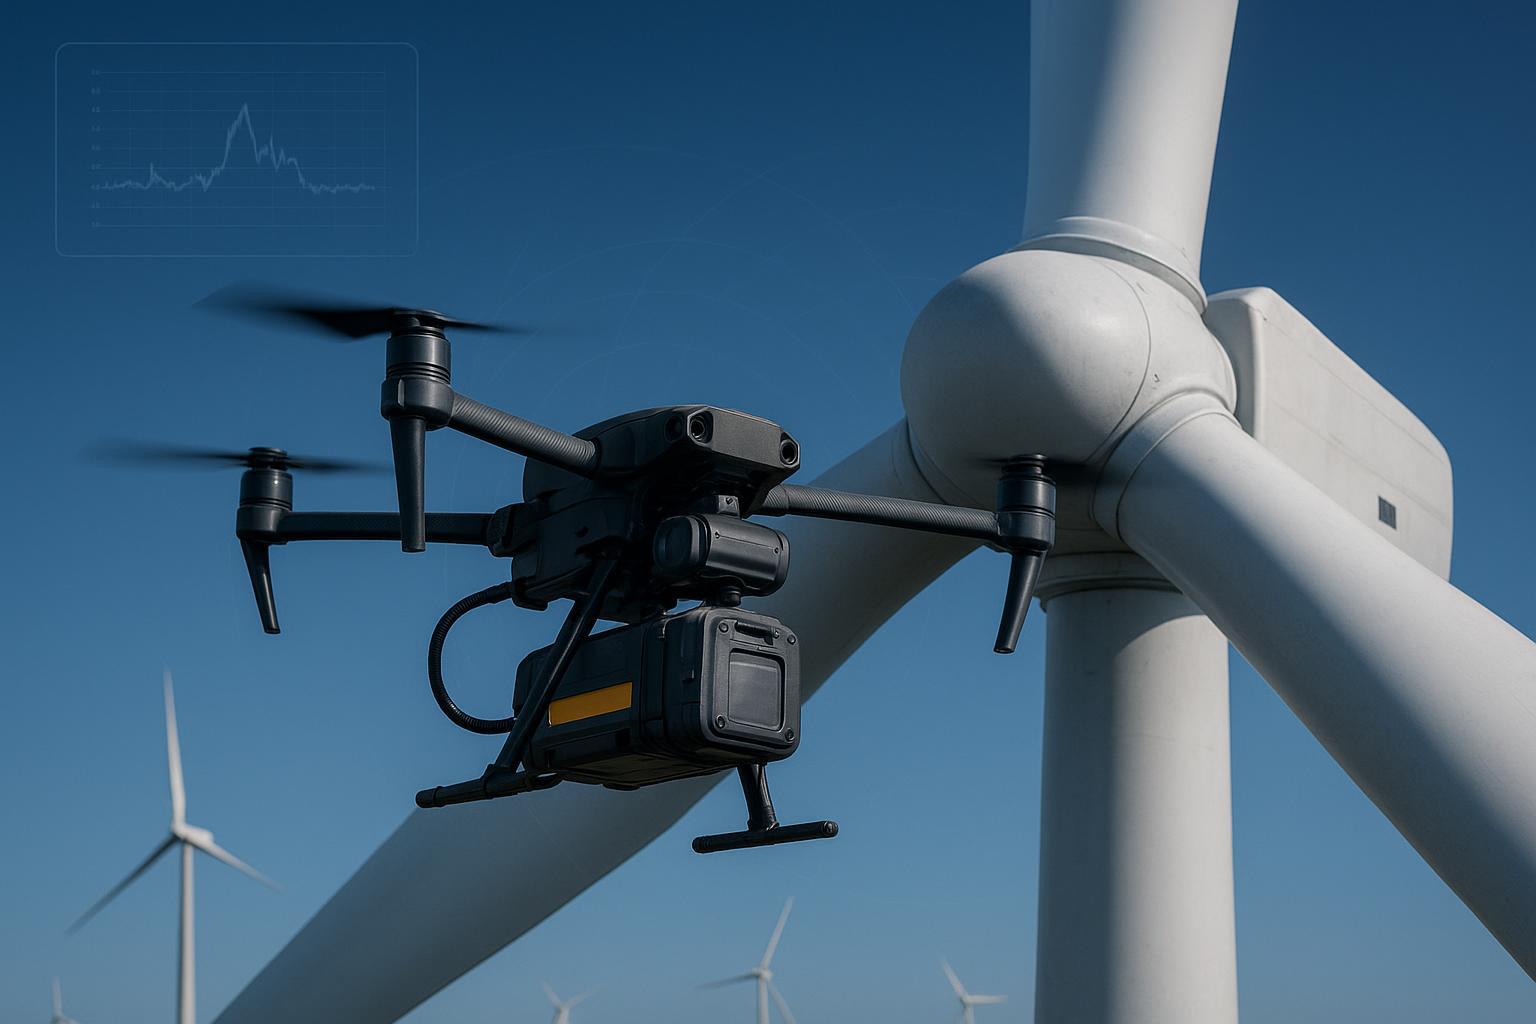


Power and pipeline inspections live or die by sortie endurance and mission reliability. If your batteries underdeliver in cold wind or sag under transient load, you lose coverage, add unplanned landings, and see TCO spiral. If you overspec for brute current, you carry dead weight, pay more per pack, and still risk heat‑driven aging. This guide translates cell‑level specs into operational decisions you can defend to finance and safety teams.
You will get field‑tested formulas, a reproducible sizing workflow, a worked inspection example, platform voltage guidance for 12S and 14S fleets, environmental derating practices, a compliance checklist, and a practical decision matrix. The goal is simple: make industrial drone battery selection a repeatable engineering choice, not a guessing game.
Capacity, energy, and flight time math
Capacity and energy tell you how long the aircraft can produce the required shaft power. Use these fundamentals and keep units straight.
- Energy in watt‑hours: Wh = V × Ah
- Endurance approximation: Flight time h ≈ [Energy Wh × usable state of charge] ÷ Average power W
- Usable state of charge is the fraction you plan to use each flight to protect cycle life. For inspection missions, many fleets plan 70–90% usable SOC.
A second useful identity relates power and current. At a given bus voltage, average current draw is Iavg = Pavg ÷ Vbus. This matters because current squared times resistance drives heat. For the same power, a higher bus voltage reduces current and I²R losses, which improves voltage stability and thermal headroom.
Understanding C‑rating and its thermal and sag implications
C‑rating ties current to capacity. In short form:
- Maximum continuous discharge current (A) = Capacity (Ah) × C‑rating (continuous)
- Required C‑rating ≥ I_peak (A) ÷ Capacity (Ah)
Differentiate continuous from burst. Continuous defines what the pack can sustain thermally without premature degradation. Burst (or pulse) supports short transients but induces significant voltage sag and extra heat (I²R), so treat pulse ratings as headroom, not sustained duty.
For inspection profiles dominated by steady cruise with gust corrections, a moderate continuous C (about 10–20C when energy is correctly sized) often yields better TCO than high‑C packs.
- Why? Lower continuous C designs at the same chemistry typically run cooler at moderate loads and, all else equal, exhibit slower calendar and cycle degradation.
- The trade‑off: high‑C packs earn their keep in heavy takeoff and aggressive maneuvering but can add unnecessary cost, weight, and thermal stress for long, steady sorties.
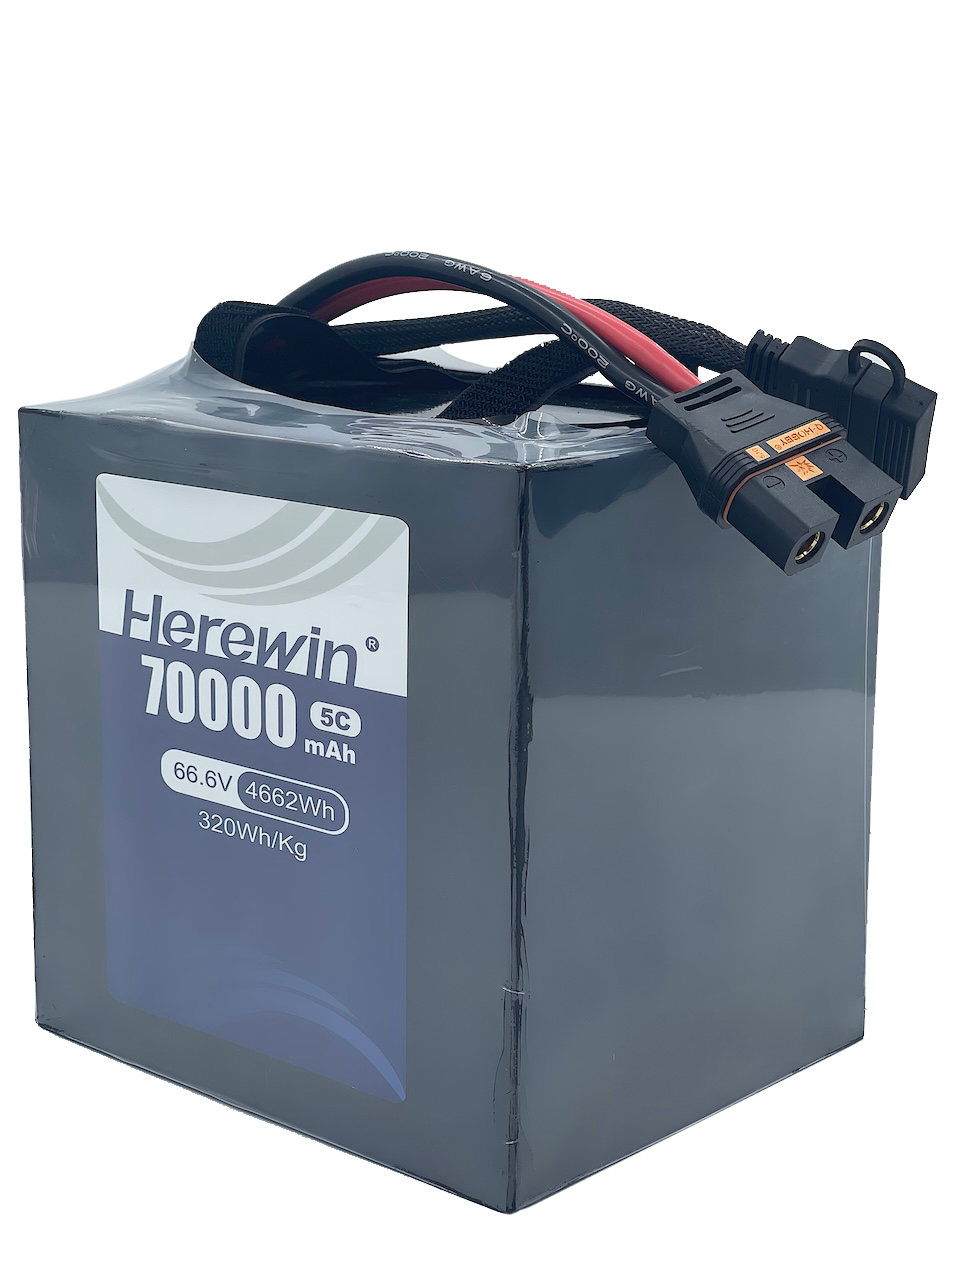
Platform compatibility and the 12S versus 14S choice
Enterprise UAV ecosystems commonly use 12S and 14S packs. Typical nominal and maximum voltages are:
- 12S nominal about 43.2–44.4 V, full charge up to about 50.4 V
- 14S nominal about 50.4–51.8 V, full charge up to about 58.8 V
At constant power, current scales as I = P ÷ V. Moving from 12S to 14S reduces current for the same flight power, which lowers conductor and BMS stress and reduces voltage sag at transients. This is why many heavy‑endurance inspection airframes and custom VTOLs opt for 14S when integration allows.
If your aircraft and ESCs accept both 12S and 14S, consider 14S for long‑range inspection to minimize current and heat at a given power level. Ensure the BMS current limit exceeds your peak by a comfortable margin and that your telemetry exposes per‑cell voltage and pack temperature for in‑flight monitoring.
Worked example for inspection operators
Given mission assumptions for a power line inspection sortie:
- Average electrical power: 500 W
- Target flight time: 2 h
- Transient peak current: 30 A
- Example bus voltage for the math step: 14.8 V
- (this is a simple arithmetic example; platform guidance follows)
Step 1. Compute required energy and theoretical capacity at the example bus voltage.
- Energy Wh = 500 W × 2 h = 1,000 Wh
- Capacity Ah = Energy Wh ÷ Voltage V = 1,000 ÷ 14.8 ≈ 67.6 Ah
Step 2. Theoretical C‑rating from peak current.
- C ≥ Ipeak ÷ Capacity = 30 A ÷ 67.6 Ah ≈ 0.44C
On paper, that looks tiny. But theory without margins is not how inspection fleets avoid unplanned landings.
Step 3. Convert theory to an engineering recommendation with conservative margins.
- Usable SOC window. If you plan to use 80% of the pack to protect cycle life, divide by 0.8. 67.6 Ah ÷ 0.8 ≈ 84.5 Ah
- Aging and temperature derating. Add about 15% to account for early life variance, measurement error, and winter IR rise. 84.5 Ah × 1.15 ≈ 97.2 Ah
- Burst and sag headroom. Add 10–15% for gusts and aggressive hover corrections. 97.2 Ah × 1.15 ≈ 111.8 Ah equivalent at 14.8 V
At a 12S or 14S enterprise voltage, you will meet the same 1,000 Wh energy target with different current. For a 14S nominal bus around 51.8 V, average current is roughly 500 ÷ 51.8 ≈ 9.6 A, which dramatically reduces I²R heating compared with a low‑voltage configuration for the same energy. That is why, in practice, many inspection teams size their total system energy to about 1,000 Wh with conservative reserves and choose a continuous C‑rating in the 10–15C range when capacity is correctly sized. The higher voltage platform provides the transient headroom without chasing extreme C‑ratings.
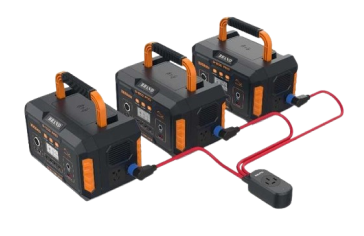
Practical recommendation from this example. Configure your pack array to deliver about 1,000 Wh net with the margins above. On 12S or 14S modules, that often translates to one or more modules between about 22 Ah and 33 Ah each in parallel or hot‑swap configurations, with a continuous C‑rating around 10–15C and a datasheet pulse rating aligned to your ESC limits. This reflects common enterprise pack densities and the conventional engineering interpretation of C‑rating: size energy first, then verify that continuous and pulse ratings provide thermal and voltage headroom for your mission.
Industrial drone battery selection in practice (how to apply this method)
For inspection missions, start from energy and margin, not just C‑rating. Size total system energy to the duty cycle with realistic reserves, then confirm that continuous C‑rating comfortably covers your average and bursts, and finally select the highest voltage platform your airframe accepts to minimize current and sag.
Below is a compact matrix you can use to align mission goals with pack specs. Values are indicative ranges grounded in inspection fleet profiles and the engineering logic discussed above.
| Scenario | Operational KPI | Recommended capacity per module | Recommended continuous C | Engineering notes |
|---|---|---|---|---|
| Power or pipeline inspection | Zero‑failure long distance | ≥ 22,000–33,000 mAh at 12S or 14S | 10C–15C | Size to ≥1,000 Wh system energy with reserve; favor 14S to reduce current and sag; ensure BMS limit ≥1.2× peak |
| Mapping and surveying | Single‑sortie coverage area | ≥ 10,000–22,000 mAh | 15C–25C | Balance endurance with posture corrections in variable terrain; moderate C for gusts |
| Agriculture spraying | Uniform spray and turnaround efficiency | 15,000–30,000 mAh | 20C–30C | High lift and frequent transients demand higher C and robust thermal management |
Use the matrix to narrow options, then validate on your airframe with telemetry logs. Watch pack temperature rise per minute at cruise, observe minimum cell voltage during bursts, and check that low‑voltage warnings appear well above your safety reserve.
TCO modeling and risk management (quantified example)
TCO for inspection batteries is driven by pack cost, cycles to 80% SoH, and downtime. A practical framing:
Cost per flight hour ≈ Pack cost ÷ (Cycles to 80% SoH × Hours per cycle) + Unplanned incident probability × Cost per incident + Logistics/compliance overhead
Example (illustrative — request vendor cycle data):
| Parameter | Pack A (moderate C) | Pack B (high C) |
|---|---|---|
| Continuous C band | 10C–15C | 25C–30C |
| Pack purchase cost | $1,200 | $1,500 (+25%) |
| Expected cycles to 80% SoH | 1,200 | 700 |
| Avg hours per cycle | 2 h | 2 h |
Simple capital cost per flight hour:
- Pack A: $1,200 ÷ (1,200 × 2) = $0.50/flight hour
- Pack B: $1,500 ÷ (700 × 2) ≈ $1.07/flight hour
Key takeaways
- Savings: Under these assumptions, moderate‑C packs cut battery capital cost per flight hour by ~53% (illustrative).
- Caveat: Results depend on vendor‑specific cycle tests (DoD, temperature) and operational downtime; include incident costs in full TCO.
- Procurement actions: Request cycles‑to‑80% SoH at representative DoD/temp, continuous and pulse C ratings with test durations, thermal profiles under mission loads, and lab accreditation/method summary.
Environmental adaptation for steady, zero‑failure sorties
Cold reduces power and capacity by raising internal resistance and slowing reaction kinetics, while high heat accelerates aging and can precipitate thermal incidents. What practical rules help inspection operators?
- Preheat to a core temperature near 20–25°C and maintain insulation between sorties in winter. Avoid charging below about 5°C to reduce lithium plating risk. These practices are consistent with enterprise guidelines and vendor advisories; for a materials perspective on cold‑induced degradation see the SLAC/Stanford summary on particle cracking in extreme cold: SLAC/Stanford cold‑damage summary.
- Expect voltage sag under gusts at low temperature. Reserve extra SOC buffer and avoid steep descents at minimum SOC.
- In hot climates, avoid prolonged exposure above ambient mid‑30s Celsius and respect BMS over‑temperature limits. Park in shade, ensure airflow paths are not obstructed, and plan shorter cycles during heat waves.
For inspection‑specific endurance and environmental tactics, see operational tips on lithium batteries for mapping and inspection drones: Herewin mapping & inspection guide.
Certifications, shipping, and procurement checklist
Two domains matter: product safety compliance and transport compliance. Use accredited documentation and verify scope.
- UN38.3 for transport. Every shipped lithium battery design must pass UN38.3 Tests T1 through T8. Official reference: UNECE Manual of Tests and Criteria, Part III, Sub‑section 38.3: UNECE UN38.3 Rev.8 + Amend.1.
- IATA state of charge rules. For UN3480 shipments of standalone lithium‑ion batteries by air, IATA caps SoC at 30% under Packing Instruction 965. See the IATA Lithium Battery Guidance Document: IATA guidance.
- IEC/UL 62133‑2 for market safety. IEC/UL 62133‑2:2017 defines safety requirements for sealed secondary lithium cells and batteries. See UL’s overview of the 62133 family: UL 62133 family overview.
Procurement tip. Request the UN38.3 Test Summary per 38.3.5, accredited IEC/UL 62133‑2 test reports, the manufacturer Declaration of Conformity for CE markets, and the latest Safety Data Sheet.
Neutral example for semi‑solid packs and disclosure
Disclosure: Herewin is our product. Herewin homepage
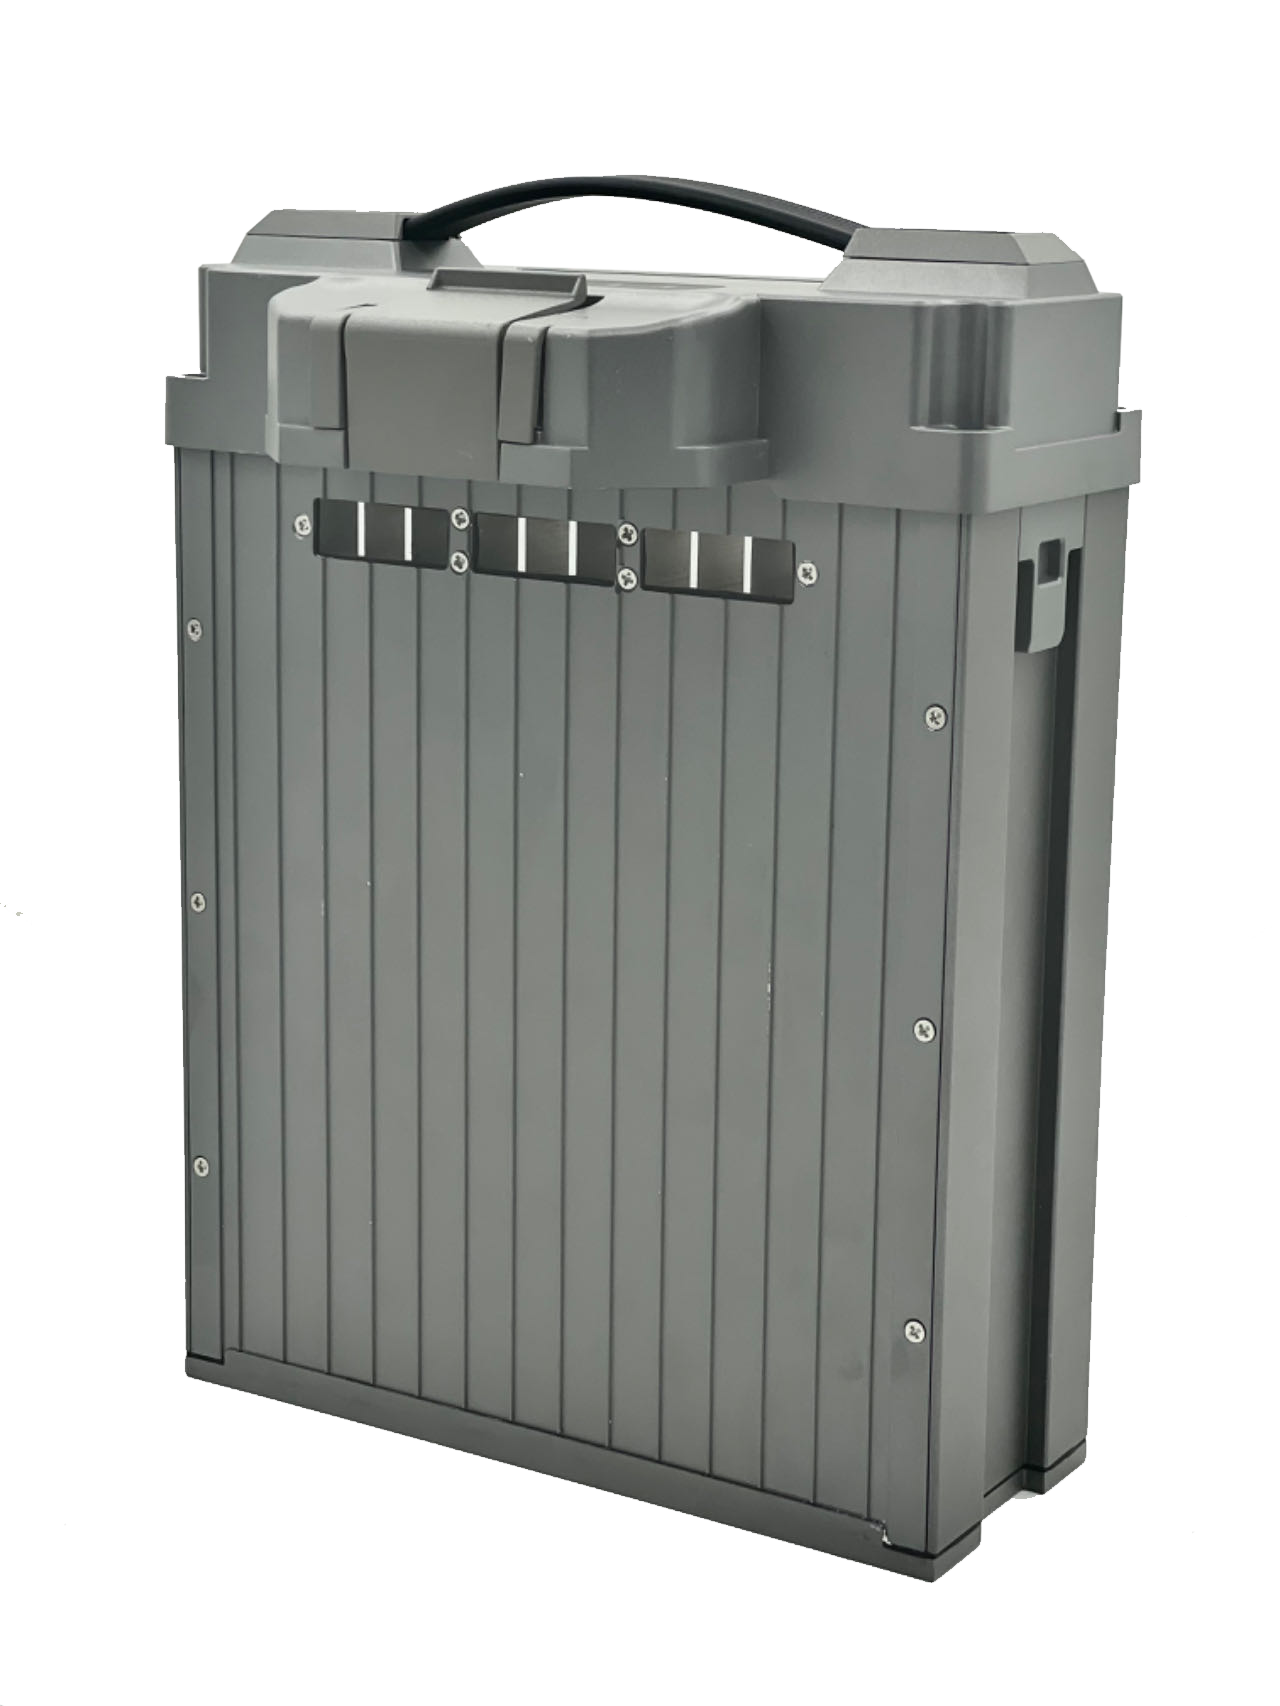
Based on Herewin internal lab validation, semi‑solid packs show a same‑weight capacity increase of ~20%–30% compared with traditional liquid‑electrolyte pack designs. Herewin offers 12S and 14S semi‑solid modules with 10C–30C precise options, where 10C–15C is typically the recommended continuous band for inspection‑focused endurance (verify with vendor datasheets and cycle reports).
Treat the 20%–30% figure as an internal lab‑validated range. To verify these specs against your operational requirements, please review the detailed datasheets in the Herewin semi‑solid category: Herewin semi‑solid category.
When evaluating semi‑solid or other high‑energy packs, validate claims by asking for:
- Cycles to 80% SoH at representative DoD and temperatures.
- Continuous and pulse C‑ratings with test durations.
- Thermal profiling under mission‑like loads (temp rise and hotspots).
Stepwise sizing checklist for inspection fleets
- Quantify average mission power from propulsion and payload logs across representative wind and altitude.
- Size total energy to mission time using Wh = V × Ah and include SOC, aging, and temperature margins as shown in the worked example.
- Choose the highest supported voltage platform to reduce current for the same power and confirm ESC and avionics compatibility.
- Select continuous C‑rating to cover average current with headroom and ensure datasheet pulse rating exceeds expected bursts and BMS limits. Prefer 10C–15C for steady inspection missions; reserve higher C (20C–30C) for heavy‑lift or high‑maneuverability platforms.
- Validate with telemetry: confirm temperature rise rates, per‑cell minimums, and reserve SOC at landing across hot and cold days.
References
- C‑rate fundamentals and time‑current relationships: Battery University BU‑402.
- Applied C‑rating selection guidance: Epec C‑rating primer.
- UNECE UN38.3 official text: UNECE UN38.3 Rev.8 + Amend.1.
- IATA Lithium Battery Guidance Document: IATA guidance.
- UL 62133 family overview: UL 62133 family overview.
Closing next step
If you run inspection sorties and want to validate this selection method on your airframe, set up a small-scale pilot. Using your telemetry and environmental windows, evaluate a 12S or 14S module set configured to about 1,000 Wh with a continuous 10–15C rating, or contact us to validate against your actual flight logs so data can guide your final procurement decision.