


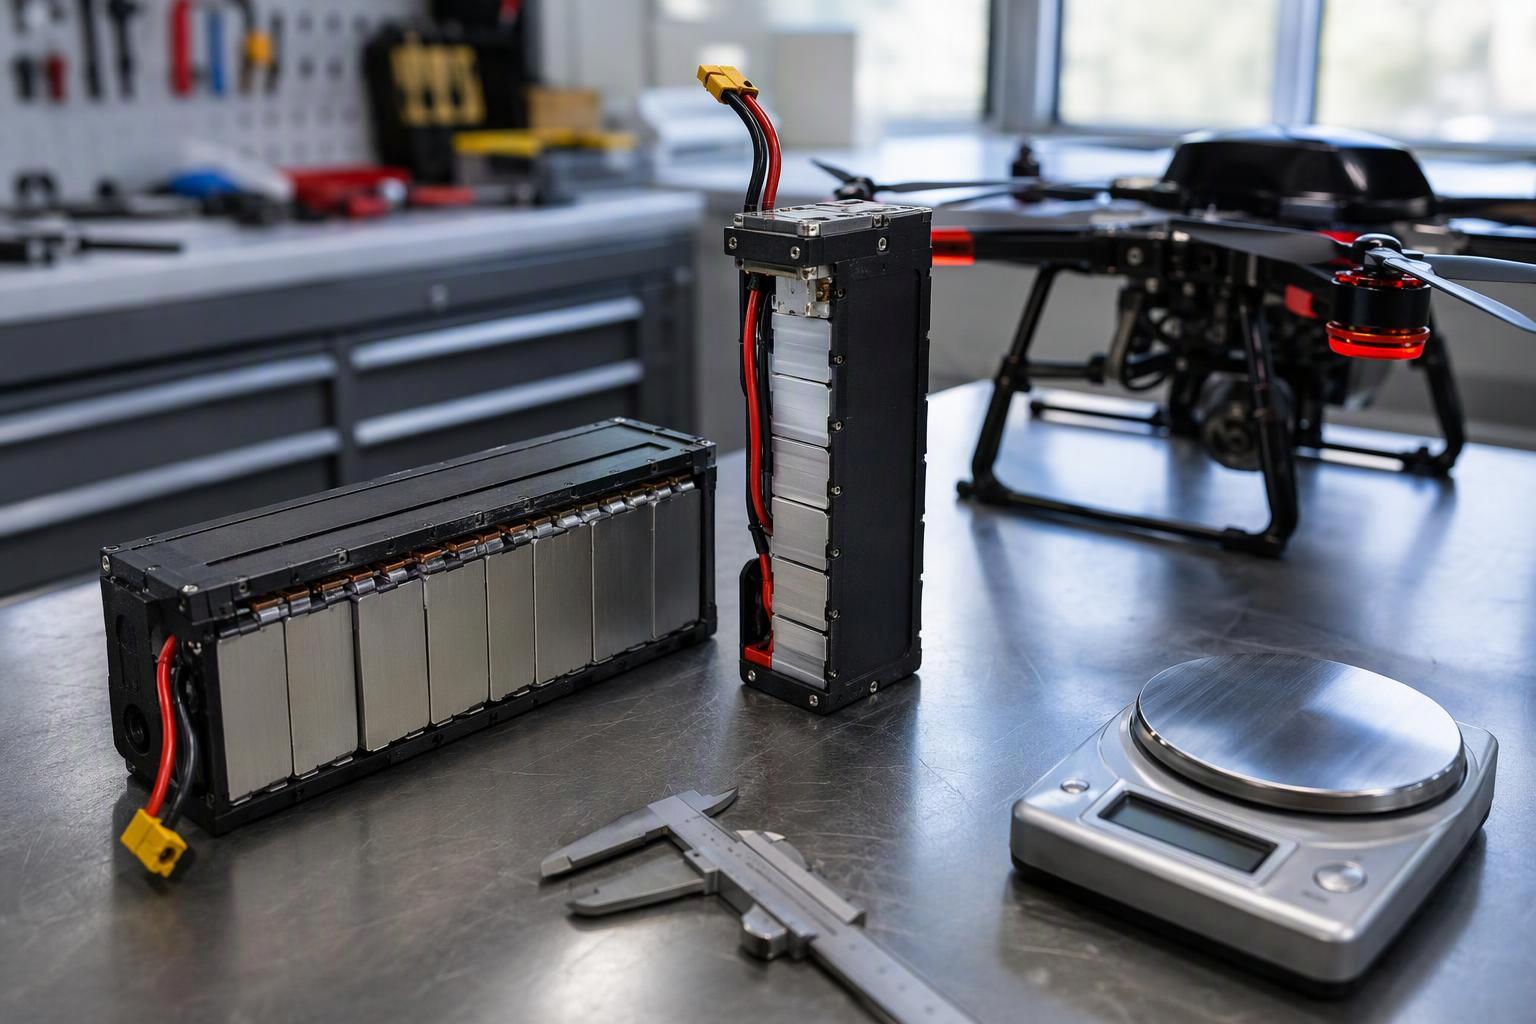
Battery energy density is reported in two figures that describe different constraints. Wh/kg relates stored energy to mass. Wh/L relates stored energy to volume. For a battery pack, neither figure supports a comparison until the measurement boundary and the test conditions are stated, because the two ratios divide energy by different quantities and neither one sets mission performance by itself.
Which metric carries more weight depends on which constraint binds a given design, and two quotes only become comparable once both say what their numbers refer to and how they were measured. A 250 Wh/kg label, for instance, can describe a bare cell on a slow bench discharge, while the same pack under a real mission current delivers noticeably less — so the label and the usable number are not the same claim.
In short: the metric that matters is the one tied to your binding constraint, and only numbers stated at the same boundary and under the same conditions can be compared.
What do Wh/kg and Wh/L each actually tell you?
Wh/kg is stored energy divided by mass. Wh/L is stored energy divided by volume. Both are ratios, and a ratio carries only as much meaning as the two quantities sharing a common boundary: the numerator and the denominator have to describe the same object under the same operating conditions. A number reported without saying whether it applies to a cell, a module, a pack or a complete system leaves the reader unable to tell what was divided by what.
The second layer is nominal versus usable energy (what the pack is rated for under set conditions versus what it actually delivers in real use). Nominal energy is a rating taken under specified conditions. Usable energy is what the pack can actually deliver inside its operating limits under the duty cycle the mission imposes — the SOC window, temperature range, current and protection cutoffs. For a UAV pack, a rating taken on a slow bench discharge can translate into a meaningfully smaller usable share once the real mission profile, a cold morning and the cutoff voltage are applied.
Comparison | Wh/kg | Wh/L |
|---|---|---|
Measures | Energy per unit mass | Energy per unit volume |
More important when | Mass is the binding constraint | Usable cavity volume is the binding constraint |
Buyer should request | Measurement level and test conditions | Measurement level, volume boundary and test conditions |
Before comparing two numbers, check the same three things on both: the object each figure describes, the discharge rate and temperature it was taken at, and whether it is a nominal or usable value (what to compare beyond Wh/kg).
Why do cell-level and pack-level energy-density figures differ?
Keep two different questions apart here. Wh/kg and Wh/L are separate metrics with different denominators. Cell-level and pack-level figures are the same metric measured on different objects. A cell rating applies to the cell alone; a pack rating applies to the cell plus everything built around it, so the two are not interchangeable even when the metric is identical. NASA’s cell-to-pack scaling study for electric aircraft gives a clean published pair: cells rated 225 Wh/kg integrated into a 149 Wh/kg pack, a pack-level gravimetric density roughly 34% below the cell figure on this dataset (NASA Glenn cell-to-pack scaling study, AIAA Scitech 2019 series).
That gap comes from mass that carries no energy of its own: enclosure, busbars and interconnects, structural members, the BMS, thermal-management hardware and mounting. How much of each a pack carries depends on its design, so no single knockdown ratio fits every case. NASA Glenn’s companion aircraft battery projections put the spread at packing factors (the share of pack mass that is actual cell, rather than housing and hardware) of 0.7 conservative, 0.8 nominal and 0.9 aggressive — the study’s own modelling scenarios rather than a coefficient every pack must follow. A 2025 review of automotive battery pack standards lands near the middle of that spread, with cells at 270 Wh/kg arriving as roughly 180 Wh/kg once assembled into a pack.
Two limits apply to all of it. The figures come from specific cell formats, pack architectures and modelling assumptions, so they are not a law for every high-density cell. NASA’s scaling work also records a counterintuitive trend inside its own model: as cell energy density rises, a larger share of pack mass can go to thermal-management overhead, so the penalty is not fixed across cell generations. These factors are specific to the architectures and assumptions in the study; a different pack design may produce a different cell-to-pack ratio.
For an agricultural spray drone, which metric governs?
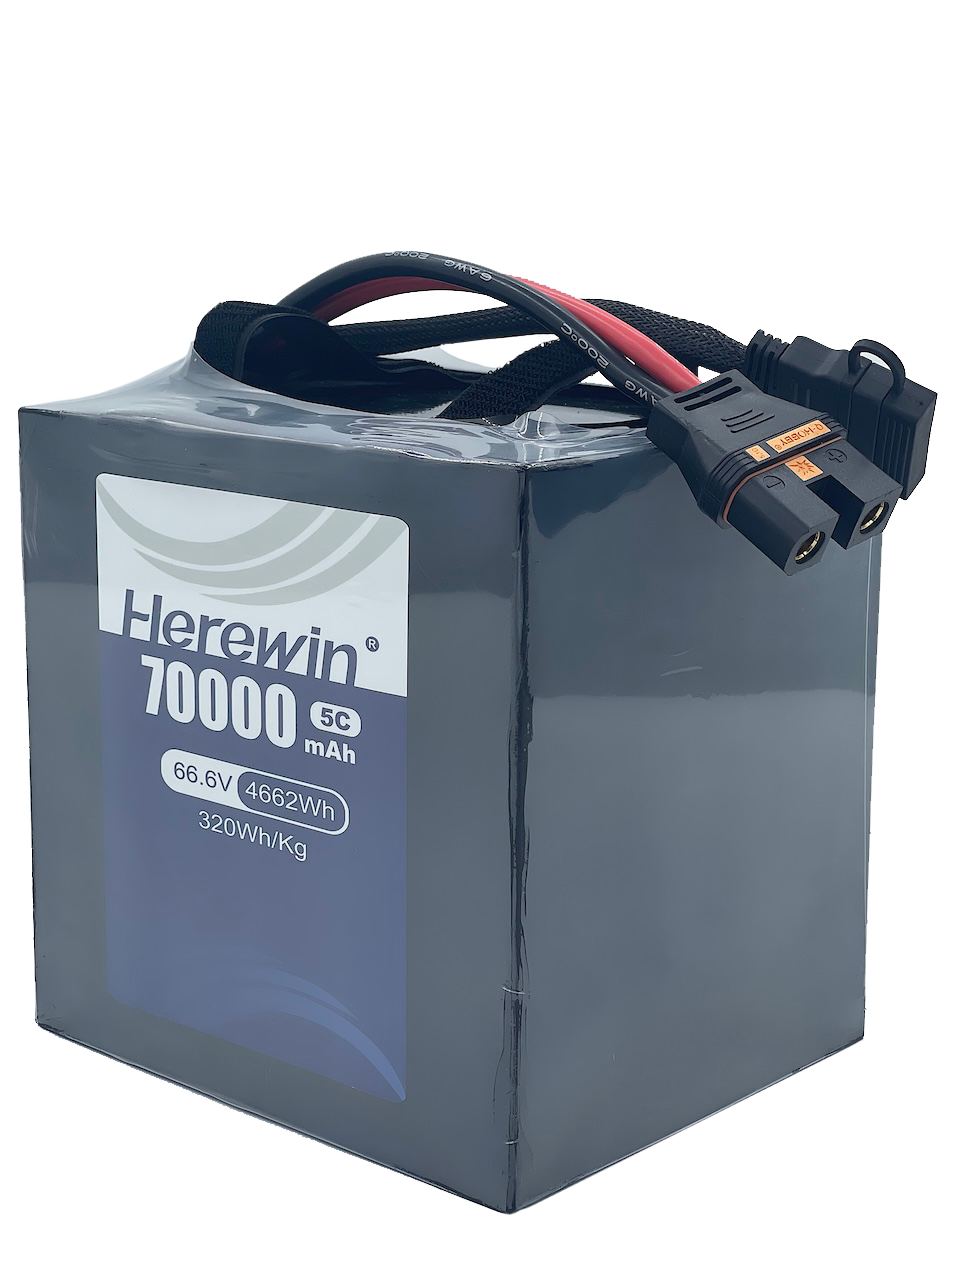
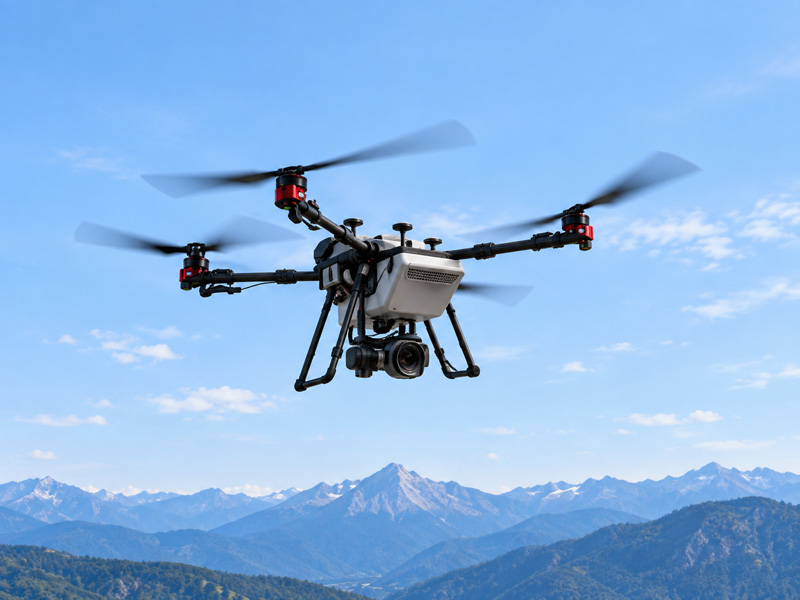
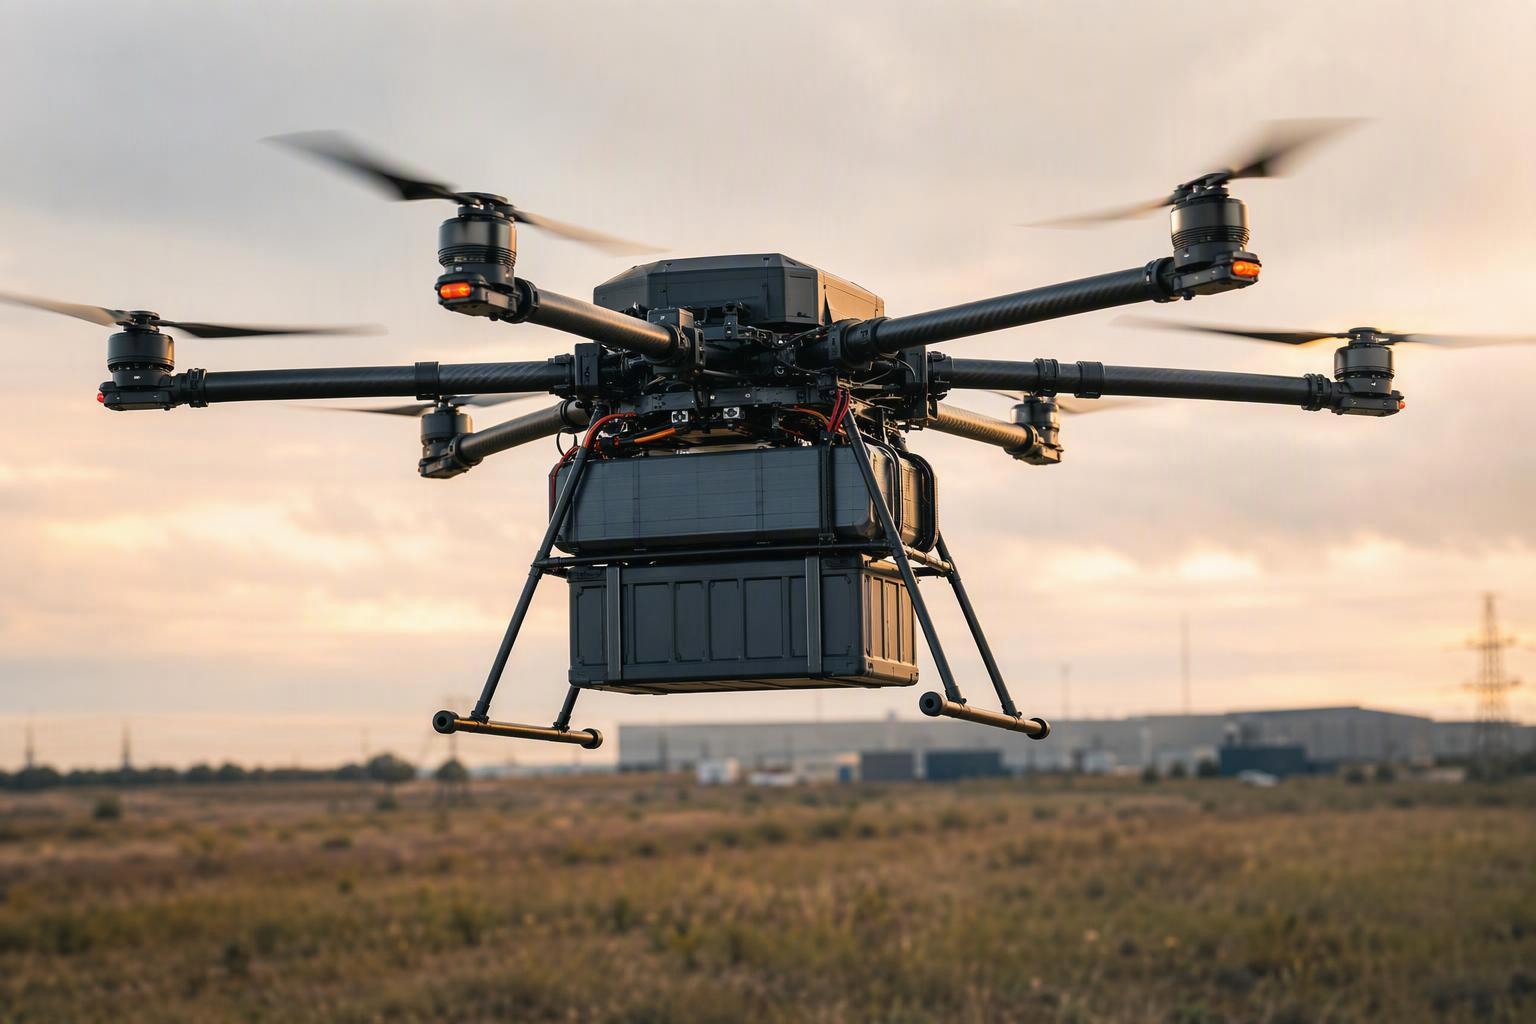
Mass is the binding constraint for a spray drone, because battery mass competes directly with the payload. Added battery mass increases all-up weight and generally raises the power required to hover, and at a fixed maximum take-off weight it displaces spray liquid or cargo (Herewin heavy-lift selection guide). The figure worth specifying is usable, flight-ready pack Wh/kg at the required discharge rate and usable SOC window, measured under load rather than at a gentle bench current. And once a supplier hands over a number, the useful next step is pack-level testing that reflects your own duty cycle.
Take a mainstream 2026 field sprayer carrying a 20-litre tank. Its pack is around 1.2 kWh, and on today’s semi-solid packs delivering roughly 250 to 300 Wh/kg at pack level, the battery lands around 4 to 5 kg — mass that comes straight off the chemical payload and the flight time the operator cares about. A headline cell figure a good deal higher than that pack number does not change the arithmetic; the usable pack figure does.
Why does a pack fall short of its spec sheet in the field? Three effects compound.
The first is current. Each mission phase draws a different load, from a high burst at take-off through a long moderate cruise, a heavier hover and a lighter return, and discharge current, cutoff voltage and temperature all shape how much energy a pack actually delivers. NASA’s electrified-aircraft work screened cells on a 3C constant-discharge requirement and tested a commercial 18650 high-power cell in that regime, measuring 95% energy efficiency at a constant 3C discharge (NASA Glenn aircraft battery projections). That figure describes a specific cell format under a steady bench current, not a spray-drone mission, and agricultural work is more dynamic still, with far higher currents during lift than in slow transit. A cell that looks strong at a low reference rate can therefore deliver well under its headline figure under a high-rate working profile, while a lower-rated cell built for high C-rate may supply more usable energy — which way the trade-off falls depends on the real C-rate bands, cutoff voltage and reference conditions, and those have to come from your own mission profile or a supplier who states theirs.
The second effect is cold. A 2022 review of low-temperature lithium-ion behaviour, published in Materials 15(22):8166, found capacity degrades below 0 °C as increased polarisation and lower discharge voltage cut the energy the cell can give up. The size of that loss tracks the exact temperature, current and chemistry, so plan for it from your own cold-soak test rather than a fixed percentage. Together, current profile and temperature are why the C-rating behind a number decides whether a pack survives the mission (how continuous and peak C-rating change usable energy).
For a volume-constrained airframe, which metric governs?
When an airframe has enough allowable mass for the energy it needs but not enough usable cavity volume to install the pack, Wh/L becomes the deciding figure. The operative word is usable. The geometric volume of a battery bay is not the volume you can fill with energy, and a supplier’s Wh/L figure has to be read against that difference.
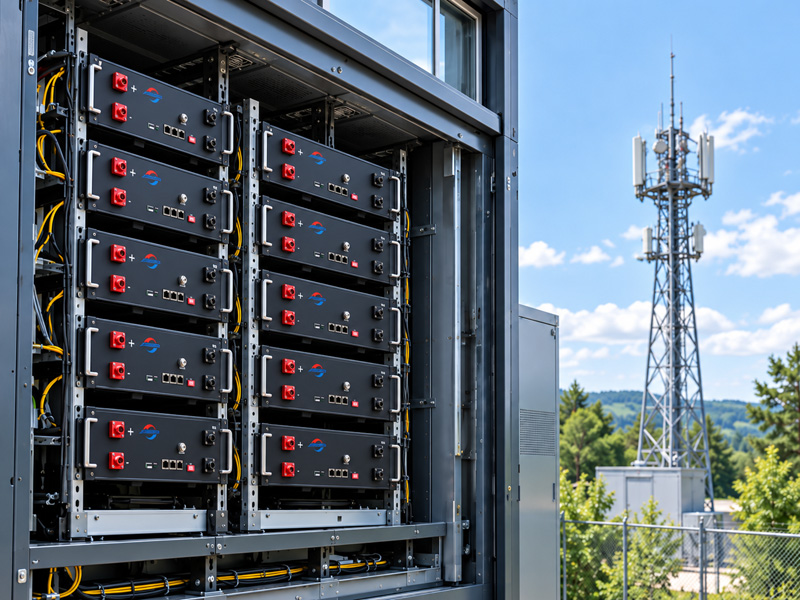
Three layers sit between the bay and the cells. Packaging comes first: a cell’s external dimensions include casing and terminal hardware, and the enclosure adds wall thickness and lid space, so a pack’s outer box is always larger than the sum of its cells. Installation hardware and routing come next: mounting brackets, connector housings, and the bend radius of power and signal cables all consume space that cannot hold energy. Engineering clearance is the third: insulation, vibration gaps, fastening hardware and ventilation or cooling paths shrink the installable envelope further, and the pack’s final position is often limited by centre-of-gravity requirements rather than the bay outline. Where the bay is fixed, a denser pack can do the job of a physically larger one that will not fit.
A cell format with excellent gravimetric density can measure lower volumetrically than a denser-packing alternative, because the two ratios use different denominators and need not rank in the same order. The automotive review records production pouch cells at 270 Wh/kg, a format where the gravimetric headline says little about how much energy fits a given cavity.
No source in this comparison provides a measured volumetric figure for an industrial or agricultural UAV pack, so treat the volume argument as design principle rather than benchmarked data. When you compare offers, check whether a stated volume refers to the cells, the finished pack or its installation envelope, since a pack’s external outline and the space it can actually occupy are not the same thing. A high cell-level rating takes on yet another meaning once the pack envelope is fixed (what a cell-level rating means for a drone buyer).
What three things should you demand from a supplier before trusting a density number?
Three items separate a marketing figure from a specification: the measurement level and test conditions, pack-level usable data rather than cell-level data, and the standards basis behind the rating. These are worth putting to any supplier as direct questions.
Verification item | What to ask the supplier |
|---|---|
Measurement boundary | Does the figure describe a cell, a module, a complete pack, or a system that includes other components? |
Energy and test conditions | Is the figure nominal or usable? What discharge rate, temperature, cutoff voltage and test method were used? |
Supporting evidence | Which test method or applicable standard was used, and can the report be reviewed? |
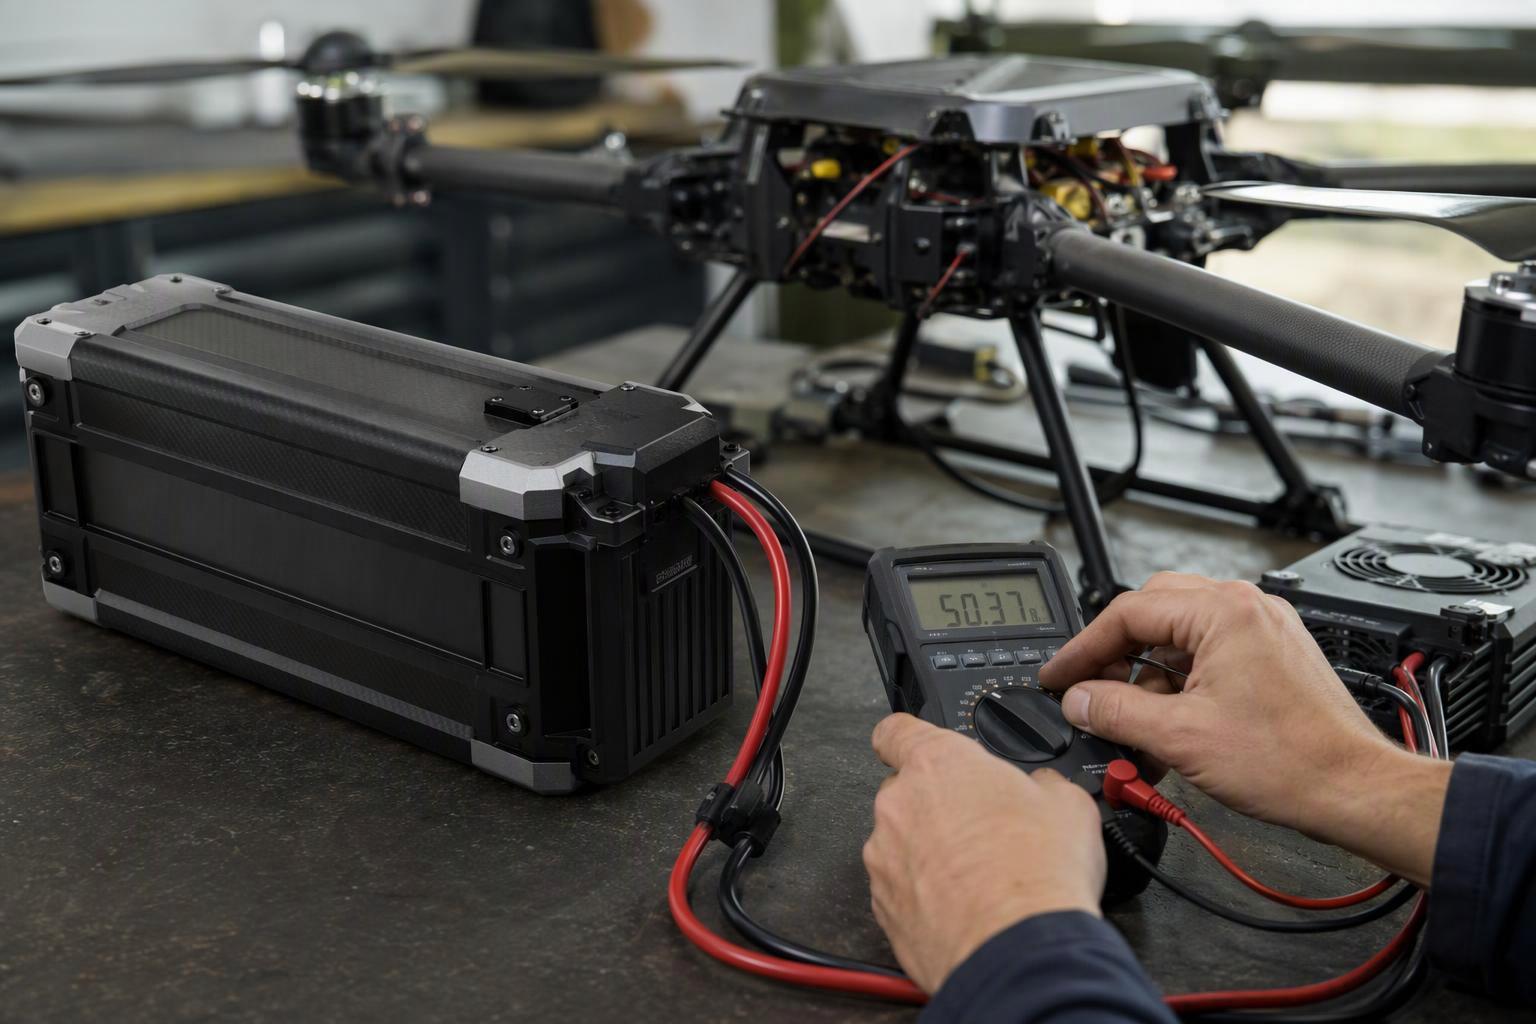
A supplier who cannot state the level and the conditions is quoting a number without a specification. No single standard settles UAV density comparability on its own, so the aim is to know which test conditions a figure was measured under and which standard, within its own scope, supplies relevant evidence. Two references cover the main layers. IEC 62660-1:2018 sets performance-test procedures for lithium-ion cells for electric road vehicles — capacity, power density, energy density, storage life and cycle life — and defines rated capacity as a value determined under specified conditions and declared by the manufacturer, with a time base of 3 h for battery-electric applications and 1 h for hybrid applications. Its scope is road-vehicle cells, so it is a reference for how a cell rating should be specified rather than a UAV pack standard. Alongside the number, ask for cell consistency, thermal-management design and the BMS balancing strategy.
ASTM F3005-22 addresses the battery itself: terminology, cell requirements, mechanical design and assembly, electrical design, and pack maintenance, sitting under F2910. It explicitly does not cover the system that uses the battery. EASA’s 2024 assessment points to ASTM F3005-14a sections 5 to 8 as a means of compliance for Light-UAS.2430 at SAIL III to VI, a reference scoped to those Light-UAS conditions rather than a general requirement for every industrial drone. Separately, transport and safety standards such as UN 38.3, IEC 62133 and UL 1642/2580 establish compliance, not a Wh/kg figure. The FAA’s lithium battery framework sits above the sUAS layer, with TSO-C179b for rechargeable batteries and battery systems using RTCA DO-311A as the minimum performance standard. Every published Wh/kg and thermal claim is best treated as a method target to be validated through pack-level testing under the intended operating conditions.
How does our own cell-to-pack and semi-solid positioning fit this decision model?
Our published figures work as an example of the boundary rule, provided they are read as our own stated claims rather than validated benchmarks. We report band ranges of 200 to 250 Wh/kg at cell level falling to 140 to 200 Wh/kg at pack level for conventional industrial LiPo, versus a semi-solid cell level that reaches higher, with the same cell-to-pack drop applying at pack level (our cell and pack bands).
The bands follow the pattern the earlier sections describe: cell-level figures sit higher than pack-level figures, and the semi-solid route sits above conventional LiPo at both levels. They do not support a precise knockdown percentage, and they do not support a general claim that semi-solid always beats conventional LiPo. They show how we separate our cell and pack specifications, which is a different thing from an independently verified industry benchmark. Our numbers sit on a different basis from the NASA relationship, which comes from thermal and structural optimisation across a sweep of cell energy densities, so the two cannot be combined to extract an exact pack-level loss without reading more into the data than it holds.
The semi-solid route carries the same caution. Take a figure like 400 Wh/kg as one example of where a semi-solid cell can land, not as a fixed ceiling on the chemistry; we cite it here purely to illustrate a data point rather than the limit of what the route can reach. Alongside any such number we describe the underlying hybrid electrolyte as having a more controllable safety and thermal profile than a highly energetic liquid system, and that is our own characterisation, not an independently established link between the energy-density figure and safer thermal behaviour. The two claims should be read separately: the energy-density figure is an illustration of capability, while the safety and thermal behaviour still needs verification. No source in this comparison models thermal runaway in a semi-solid pouch or prismatic cell, so cell-level and pack-level electrical and thermal testing has to come before any headline figure becomes a planning number.
For your agricultural UAV project, validation should use the intended payload, current profile, temperature range and operating cycle. Charge time, battery swaps and field conditions also affect daily operating capacity, so we’d suggest evaluating the energy-density figure alongside these requirements rather than in isolation.
ЧАСТО ЗАДАВАЕМЫЕ ВОПРОСЫ
Is Wh/kg or Wh/L more important for a UAV battery?
The binding constraint decides. Wh/kg matters when mass limits the mission; Wh/L matters when the airframe has mass to spare but no usable cavity left.
Can you compare a cell-level Wh/kg figure with a pack-level Wh/L figure?
No. The two figures describe different objects under different conditions, so the drop between them varies by design rather than following a fixed percentage.
Can a pack with higher Wh/kg have lower Wh/L?
Yes. The two ratios use different denominators and need not move together, so a higher gravimetric figure says nothing about volumetric density on its own.
Which standards govern a published density figure?
None does so universally. IEC 62660-1:2018 covers performance testing for electric road-vehicle cells, ASTM F3005-22 addresses sUAS batteries without covering the system around them, and safety and transport standards such as UN 38.3 cover compliance rather than a density figure. Ask which test conditions a number was measured under and which standard, within its scope, supports it.
Two supplier quotes become comparable once both state what each number refers to and how it was measured. To get there, hand your mission profile, load current profile, peak currents, temperature range and available bay envelope to the supplier, and request a pack-level spec sheet with usable Wh/kg at the required discharge rate. That spec sheet — measured at a stated boundary, under stated conditions — is the artefact that shows whether the pack physically does the job.

 Русский
 English
 Español
 한국어
 Deutsch
 Français
 日本語
 Bahasa Indonesia
 ไทย
 العربية
 Português do Brasil
 Italiano
 Nederlands