











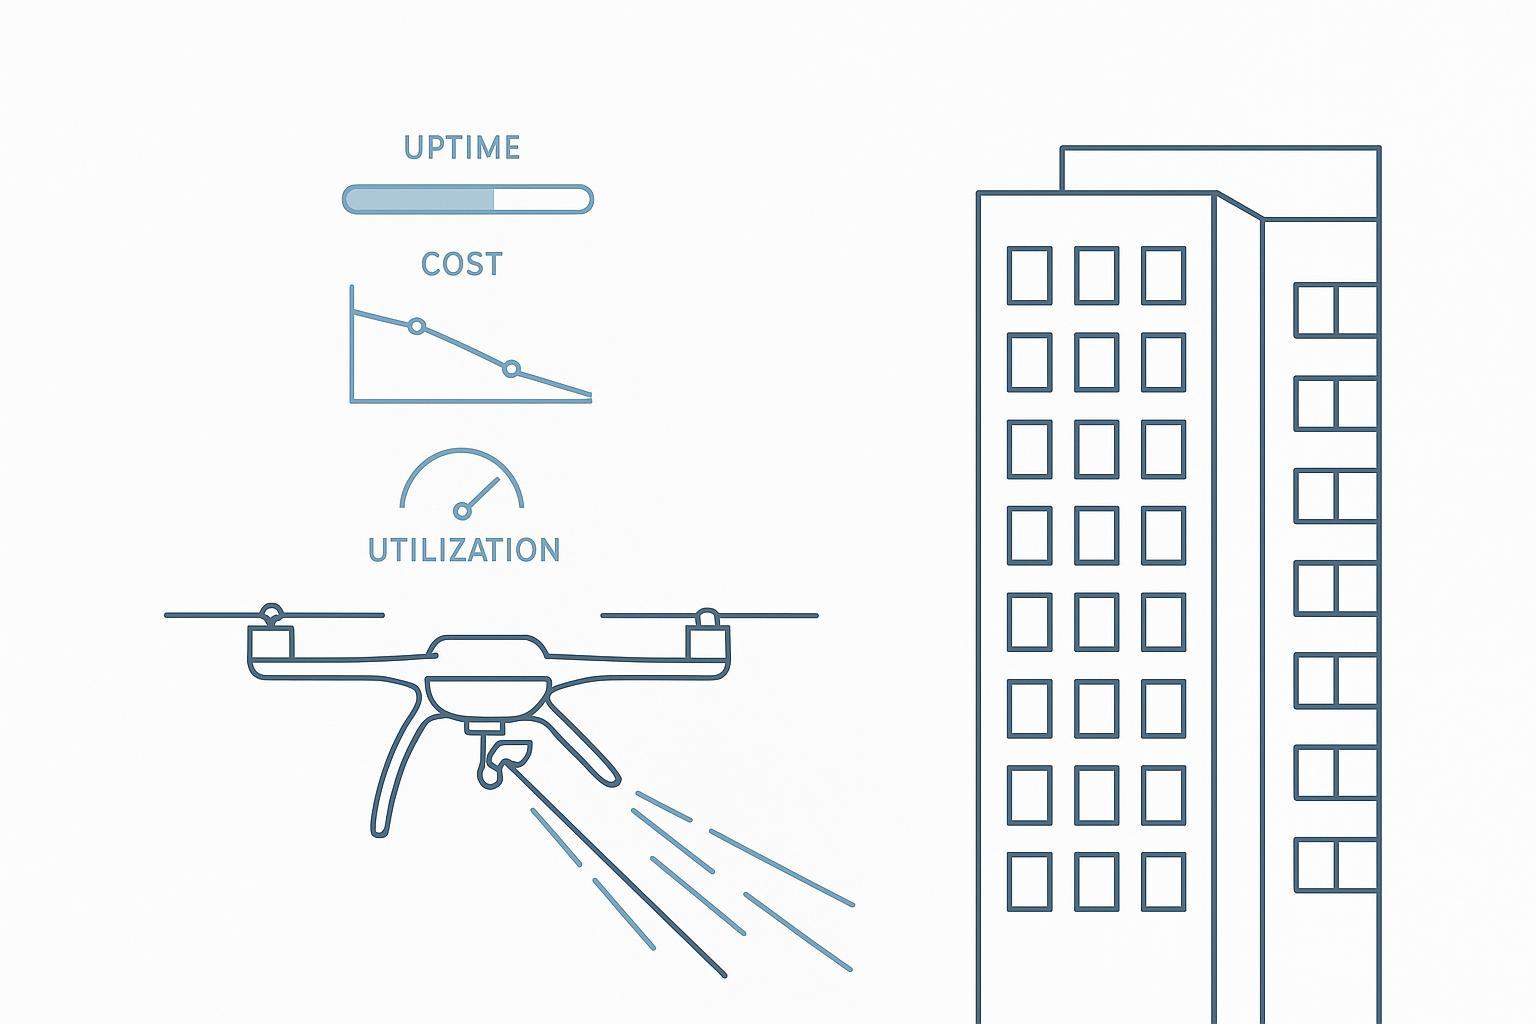
Before-and-after shots can win attention—and sometimes win the first contract. But as drone cleaning moves from demonstration to deployment, the buyers who control budgets start asking different questions:
Can you deliver the same result across 10 buildings, not one?
Can you hit a schedule window when wind, access, and tenant constraints change?
Can you defend your pricing with a repeatable operating model?
In other words, the market is separating what looks impressive from what’s profitable and scalable.
This article explains why drone cleaning operations cost control is becoming the real competitive advantage—and how the power system (battery + charging workflow) quietly determines uptime once you move beyond a single showcase job.
Why Before-and-After Images Became the Dominant Marketing Tool in Drone Cleaning
Why do before-and-after images dominate drone cleaning marketing?
In the early market, visuals are the fastest way to prove the category works.
Drone cleaning has one natural advantage as a go-to-market tool: the work is highly visual.
High-rise facade cleaning creates strong visual contrast. A dirty exterior, algae stains, soot lines, and runoff marks often show “instant” transformation.
Drone footage amplifies transformation effects. Stabilized aerial video, tight framing, and repeatable angles make changes feel dramatic.
Social media and exhibitions reward visible impact. In early markets, the signal that spreads is not “this operator has a stable unit economics model.” It’s “that building looks brand new.”
That’s not shallow—it’s how immature markets work. Early marketing rewards visual proof. Profitability gets decided later, in operations.
What do buyers ask after the demo proves the drone can clean?
A before-and-after demo answers one question: Can this drone clean? Budget owners quickly shift to risk and repeatability.
They start asking different questions:
Will this scale beyond a single showcase building?
A perfect-day test doesn’t reveal what happens when you run multi-site work with variable weather, different facades, different access constraints, and different client expectations.
Can you deliver predictable economics and reliability?
Once a buyer believes the category works, the decision becomes: Which operator can deliver outcomes repeatedly, with less risk?
Vendor-led ROI comparisons already hint at the shift—highlighting labor, safety, and access equipment costs rather than “cleanliness” alone (see Lucid Bots’ 2026 comparison of drone cleaning vs pressure washing costs). The missing piece is the operating model that makes those savings repeatable in the field.
The Industry Is Shifting From Demonstration to Operational Deployment
The shift from demo projects to repeatable deployment
Three forces are pushing drone cleaning past the demo phase:
Growing demand for high-rise automation. Building portfolios are larger, and maintaining exteriors at height is a recurring operational need.
Rising labor cost and safety pressure. Working-at-height risk is increasingly expensive to insure and manage.
Interest in replacing risky manual operations. The value proposition isn’t only speed; it’s lowering exposure.
That risk lens shows up in buyer education content: compliance, credentialing, and safety documentation become table stakes in commercial conversations. For example, Valcourt Group’s 2025 overview of commercial drone cleaning compliance emphasizes licensing, permitting, insurance, and site evaluation as part of the “real” purchase decision.
What breaks first when drone cleaning scales
Scaling breaks the illusion of the perfect demo.
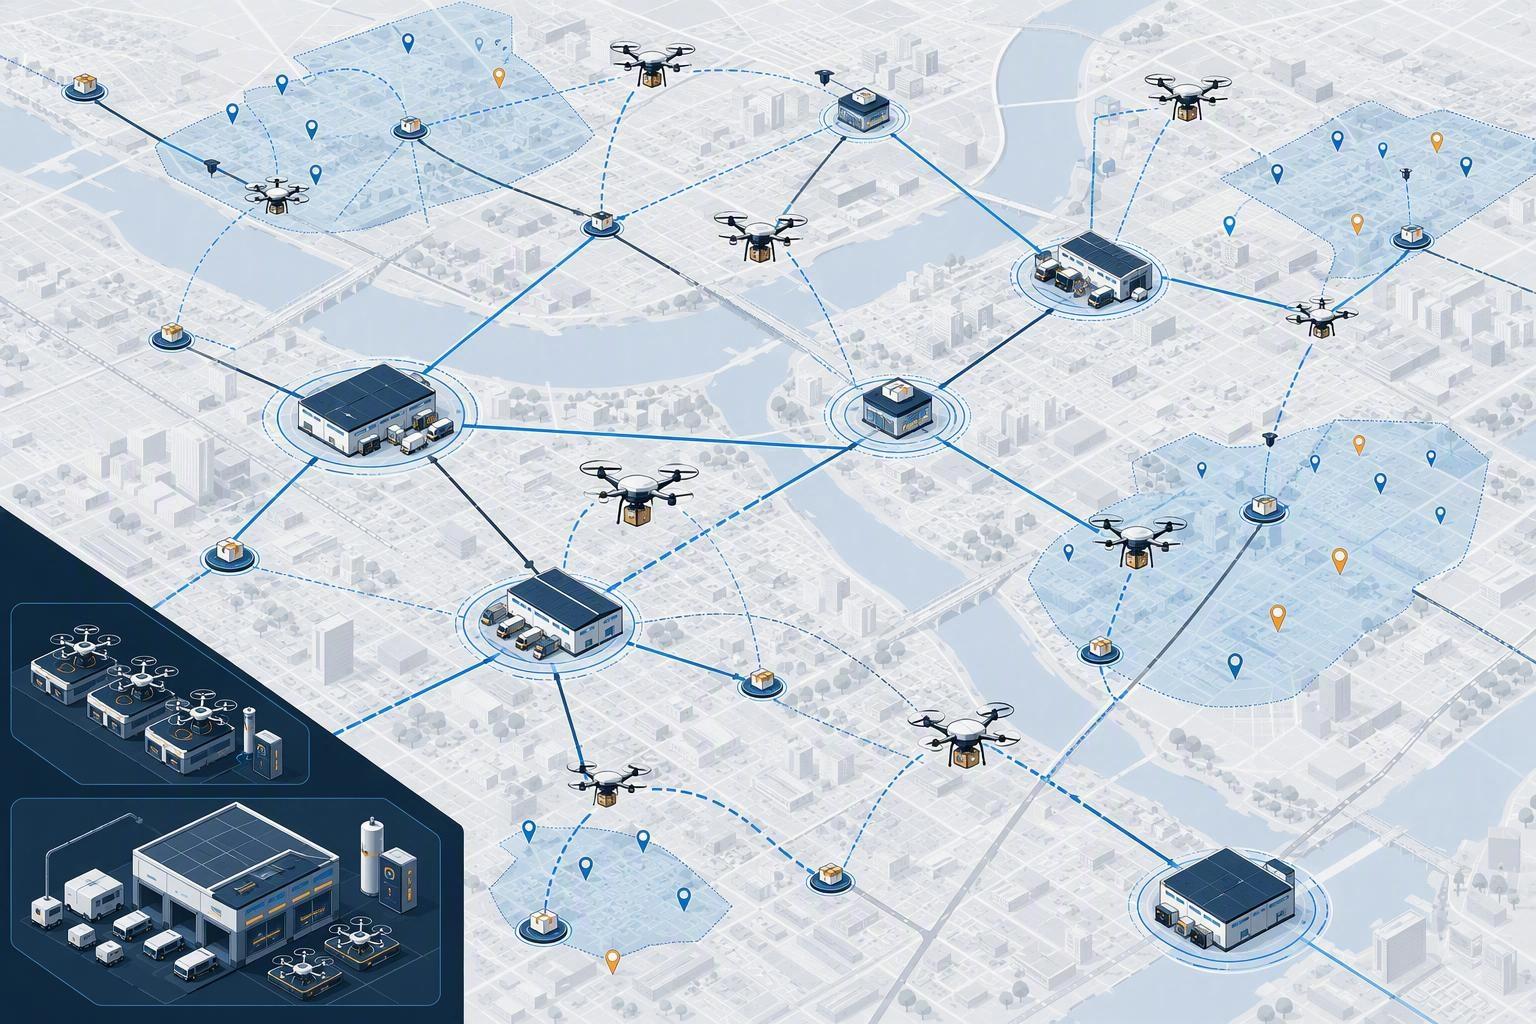
Multi-site deployment increases coordination complexity. Travel time, access windows, tenant communication, and site-specific safety controls become a major part of “the job.”
Weather, wind, and building conditions vary widely. Even if your drone is capable, the usable operating window can shrink quickly.
Equipment utilization becomes a limiting factor. It’s not enough to own a capable system. You have to keep it producing billable output.
Drone operators also openly acknowledge weather as a scheduling constraint. Off The Wall’s 2026 post on how weather affects drone cleaning is blunt: wind and conditions can force rescheduling. That reality turns “scale” into an operations discipline, not a marketing discipline.
In practice, scaling drone cleaning is not a technical challenge. It’s an operational coordination challenge—across people, sites, schedules, and equipment availability.
At scale, coordination beats the most impressive demo.
Why Drone Cleaning Operations Cost Control Becomes the Real Bottleneck
The operational levers that decide profitability
In day-to-day work, cleaning quality is necessary. It’s not sufficient.Profitability is determined by what happens between jobs and across the week, not just during a single flight.
Here’s where costs and margins usually get decided:
1.Time between jobs controls utilization. It reduces billable hours long before flight performance becomes the issue.
Travel, site setup, tenant coordination, and safety zone configuration can consume more time than flying.
2.Charging and battery rotation control daily throughput. Charging cycles determine how much of the day the drone can actually operate. A drone is only productive when it is in the air—not when it is charging.
3. Idle time turns into a revenue leak. Idle time becomes a direct revenue loss in scaled operations.
Your fixed costs don’t pause when the drone is grounded.
If you want a simple baseline definition: “utilization rate” is the percentage of time equipment is actively operating relative to available time—MachineMetrics’ definition of equipment utilization rate is a useful reference.
In drone cleaning, a practical version is:
Operator utilization (practical) = billable productive time ÷ total scheduled shift time
Cost control in drone cleaning is a throughput problem before it’s a pricing problem.
What actually drives operational cost in real projects
In real operations, costs come from predictable buckets. The key is that many of them are coupled—one failure mode increases several costs at once.
Equipment investment and depreciation
airframe + cleaning payload + ground rig + spares
financing terms and replacement cadence
Maintenance and replacement frequency
wear on pumps, hoses, connectors, spray heads
unplanned repairs that stop production
Operator training and labor coordination
specialized piloting + cleaning process + safety procedures
additional spotters or ground crew when needed
Downtime and system interruptions
weather grounding
access delays
battery/charger bottlenecks
reliability events (faults, thermal limits, voltage cutoffs)
Notice what’s missing: a “perfect before/after.” The photo doesn’t pay for the idle hour.
Cost control shows up in the least glamorous places: scheduling friction, charging turnaround, and the small interruptions that quietly shrink your billable day.
What Defines ROI in Real Drone Cleaning Operations
Repeatable efficiency matters more than single-job performance
Drone facade cleaning ROI is rarely decided by one best-case job. It’s decided by whether the job looks the same on the 20th deployment.
Repeatability has three parts:
Consistency across multiple jobs and locations. Not just results, but cycle time and rework rate.
Stable performance under different environmental conditions. Wind, temperature, surface variation, and access constraints change the load profile.
Predictable operational workflows. Clear SOPs for dispatch, safety setup, battery rotation, post-flight checks, and documentation.
If you’re bidding recurring contracts, your buyer isn’t buying “a drone.” They’re buying a predictable service envelope.
Why does uptime matter more than cleaning performance in scaled operations?
In large-scale drone cleaning operations, uptime determines how much of the day is actually billable.
Uptime is the KPI that turns operational discipline into margins. In practical terms, you can treat drone cleaning operational uptime as: mission-ready hours per shift, after charging, cooling, and unplanned stops—not just “time the drone is powered on.”
Downtime reduces fleet utilization efficiency. One grounded drone can cascade into missed windows, rescheduling, and crew idle time.
Unplanned stops disrupt project scheduling. In recurring contracts, unreliability creates administrative overhead and reputational cost.
Reliability directly impacts profitability. It’s not abstract—it’s billable hours lost.
Here’s a transparent way to model the economics without inventing results.
Use the table below as a quick checklist. It keeps “lost hours” (charging, waiting, rescheduling) visible next to revenue-producing hours.
TCO / ROI input | What it represents | How to measure it in a real operation |
|---|---|---|
CAPEX per drone system | depreciation base | purchase price or financing cost |
Planned operating days/month | calendar reality | weather + access + contract schedule |
Productive hours/day | utilization | billable time on-site + in-flight |
Downtime hours/day | lost capacity | charging + waiting + rescheduling + repairs |
Labor cost per shift | delivery cost | operator + ground support |
Consumables per job | variable cost | water/chemicals/nozzles wear |
Maintenance cost/month | reliability tax | planned + unplanned |
Rework rate | quality leakage | % of jobs requiring touch-up |
Average revenue per job | pricing reality | contract terms |
If you don’t control downtime, you can’t control unit economics—because fixed costs get spread across fewer billable hours.
Once you track downtime like a cost, you can manage it like one—with SOPs, rotation rules, and procurement criteria.
How Supply Chain Maturity Is Accelerating Commercial Adoption
Integrated systems reduce operational variance
As the category matures, the strongest operators start behaving like industrial service organizations: standardize inputs, reduce variation, and make performance auditable.
Supply chain maturity supports that by enabling:
More standardized UAV and battery systems. Less one-off customization means easier onboarding and easier spares planning.
Improved charging and maintenance workflows. Standard connectors, defined maintenance intervals, and clearer fault handling reduce “mystery downtime.”
Easier access to spare parts and replacements. The difference between a one-day repair and a two-week wait can define your margin.
Lower system cost changes who can scale
Lower system cost changes who can play.
Smaller cleaning companies can enter the market. The business becomes feasible beyond the largest contractors.
Fleet scaling becomes financially realistic. More units allow better scheduling resilience (one unit down doesn’t stop the day).
Adoption expands beyond enterprise operators. The market can grow without every operator being venture-funded.
But lower cost doesn’t automatically mean higher profitability. Cost control still depends on uptime and repeatability.
In other words: supply chain maturity helps you standardize operations—but you still have to convert that standardization into billable hours.
Standardization reduces surprises. And fewer surprises usually means a steadier schedule and higher utilization.
That same push toward standardization also changes what buyers scrutinize. Once operators start scaling, they don’t just ask whether the drone can clean—they ask whether the fleet can stay mission-ready across a full week, with predictable charging turnaround and fewer power-related interruptions.
Energy Systems Are Becoming the Hidden Infrastructure Behind Drone Cleaning Operations
Power system performance is the uptime infrastructure
In drone cleaning, “power system” means more than the battery. It’s the full chain:
battery pack behavior under load
connectors/harness resistance
BMS observability (what you can log and diagnose)
charging workflow and turnaround
rotation SOPs (cooldown, dispatch rules, quarantine rules)
When this chain is weak, you feel it immediately:
shorter real-world sorties than expected
unexpected low-voltage events
thermal limits that shrink usable windows
slow recharge cycles that reduce daily throughput
Herewin’s 2026 guide to drone battery voltage sag and fleet reliability criteria frames the core point in operational terms: voltage sag is measurable, it depends on the total resistance of the power path, and it must be evaluated under worst-case envelopes (temperature, state of charge, payload, duty cycle).
Reliability beats peak specs in fleet economics
Peak specs win demos. Reliability wins contracts.Two practical rules hold up in scaled operations:
Stable discharge is more valuable than maximum specs.
If voltage behavior is predictable under load, planning gets easier.
If it’s unpredictable, you are forced into conservative buffers and more idle time.
Predictable energy behavior improves operational planning.
Dispatch rules can be based on logged behavior (sag baseline, thermal rise patterns), not just “it worked last week.”
Herewin’s 2026 framework for selecting industrial UAV batteries—high-C vs energy density makes the trade-off explicit: missions should drive the required current headroom and thermal envelope. Choosing purely on one headline metric (C-rate or Wh/kg) is how operators get surprised later.
A procurement-grade energy checklist for drone cleaning fleets
If you want energy systems to be an uptime enabler (not a bottleneck), require evidence and workflow—not promises.
Define a repeatable “worst-case segment” (e.g., takeoff + climb + spraying) and log it.
Track minimum voltage under load and recovery behavior as a stability signal.
Track temperature rise and use it to shape dispatch and cooldown SOPs.
Standardize connectors and harness quality to reduce resistance drift.
Make charging turnaround an operations metric, not an afterthought.
Quarantine outlier packs early based on trends, not failure events.
If you can’t ask a supplier for logs, acceptance criteria, and fault taxonomy, you’re not buying an energy system—you’re buying uncertainty.
The takeaway is simple: in drone cleaning, energy is not a component purchase. It’s an operations system that either protects uptime—or quietly erodes it.
The Future of Drone Cleaning Will Be Defined by Operational Economics, Not Visual Impact
The market is no longer evaluating drones by cleaning results alone
Before-and-after visuals will remain useful. They’re just less decisive as the category matures.
Procurement decisions increasingly center on:
schedule reliability under real constraints
documentation, safety planning, and compliance readiness
utilization, downtime, and unit economics
fleet uptime—and the infrastructure that keeps it high
Cost control and operational stability will define industry winners
The operators who scale fastest can defend a repeatable operating model—one that keeps utilization high and downtime visible.
If you want a practical next step, document your last 10 jobs as a dataset:
planned start vs actual start
weather delay minutes
setup time
productive flight time
battery/charging idle time
interruptions and their cause
That single table will tell you more about your scaling ceiling than a hundred before/after shots.
If you want a procurement-grade way to reduce downtime risk, Herewin can help you evaluate battery and charging workflows—so you get fewer surprises and more billable hours.


 Italiano
  English
  Español
  한국어
한국어  Deutsch
  Français
  日本語
日本語  Русский
  Bahasa Indonesia
  ไทย
ไทย  العربية
  Português do Brasil
  Nederlands