


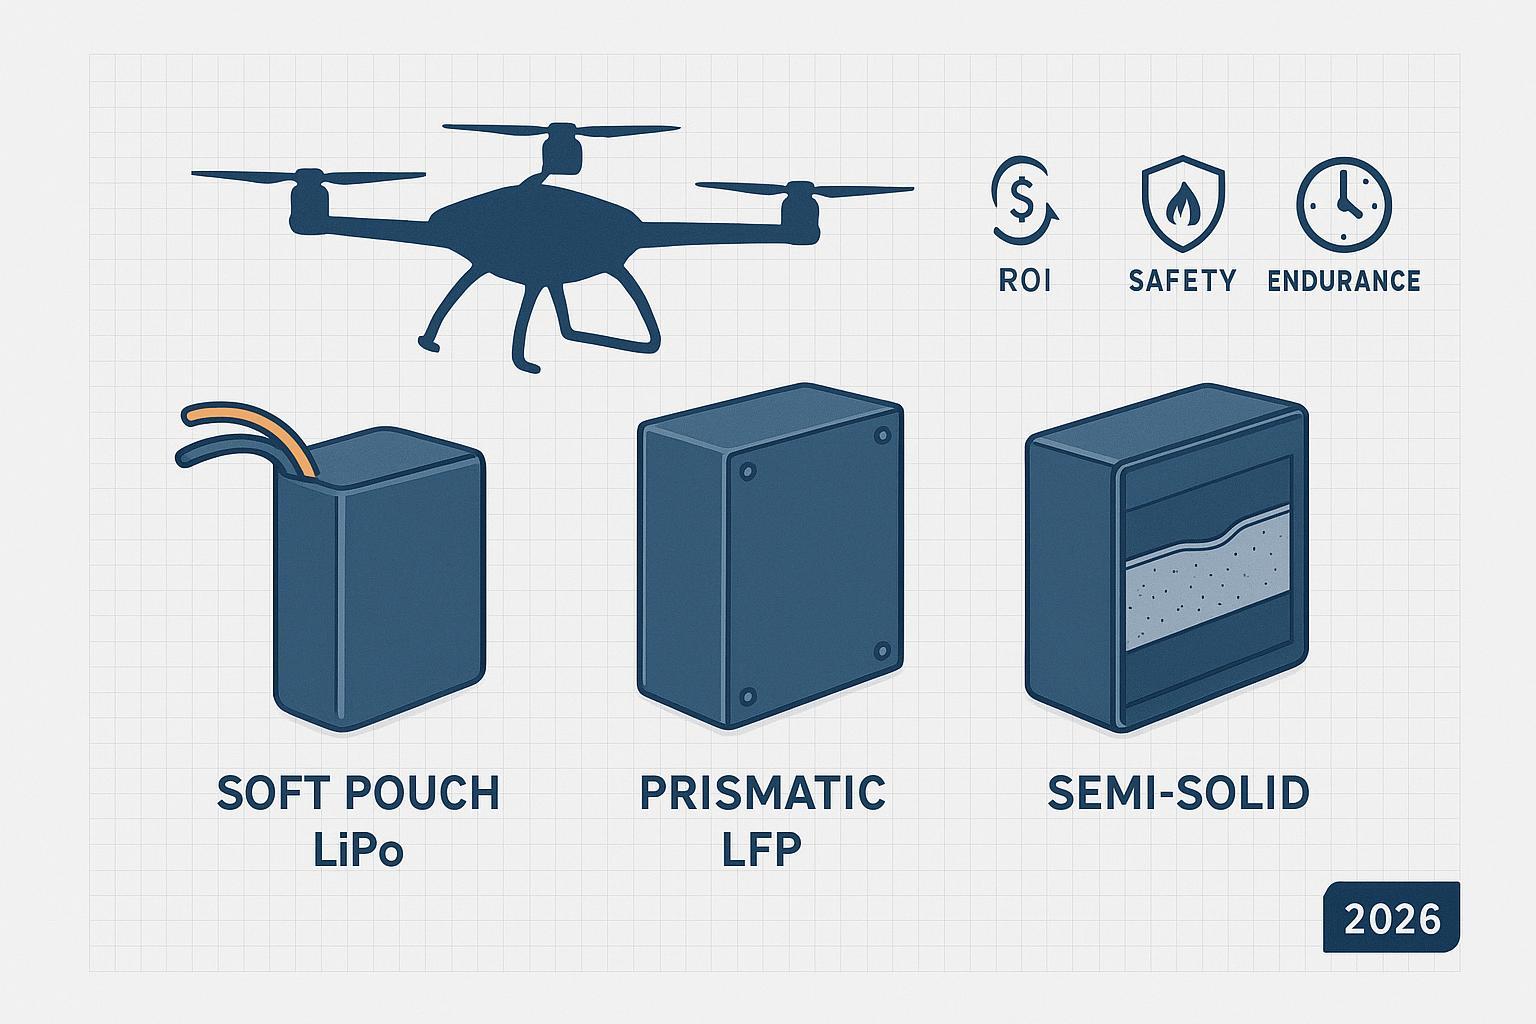
Industrial drone fleets hinge on two numbers: cost per flight hour and mission completion rate. By 2026, the power landscape has evolved beyond the simple LiPo vs. Li‑ion debate. Procurement teams must now navigate a “Trinity” of options—high‑rate LiPo, long‑life LFP, and emerging semi‑solid solutions—under increasingly stringent safety and regulatory scrutiny.
This guide provides a strategic ROI framework, a robust TCO model, and maintenance protocols designed to neutralize the “hidden killers” of industrial operations: voltage sag and thermal instability. We ground our analysis in independent research and real‑world industrial datasets so your fleet roadmap is based on physics, not marketing.
Methodology and Data Verification Standards: This guide combines independent peer‑reviewed literature with audited Herewin test results. Any supplier‑reported figures are clearly labeled with defining test conditions (e.g., temperature, C‑rate), while the Appendix details the full verification metadata (sample size, raw traces) required for procurement audits. Raw test files are available from suppliers under standard access terms.
LiPo vs. LFP vs. Semi-Solid: 2026 Drone Battery Tradeoffs
The right chemistry depends on discharge profile, safety posture, volume/weight limits, and turnaround tempo. Think of it as a three‑way trade: burst power, longevity, and near‑term safety innovations.
High-Rate LiPo: Ideal for Heavy-Lift & Emergency Response
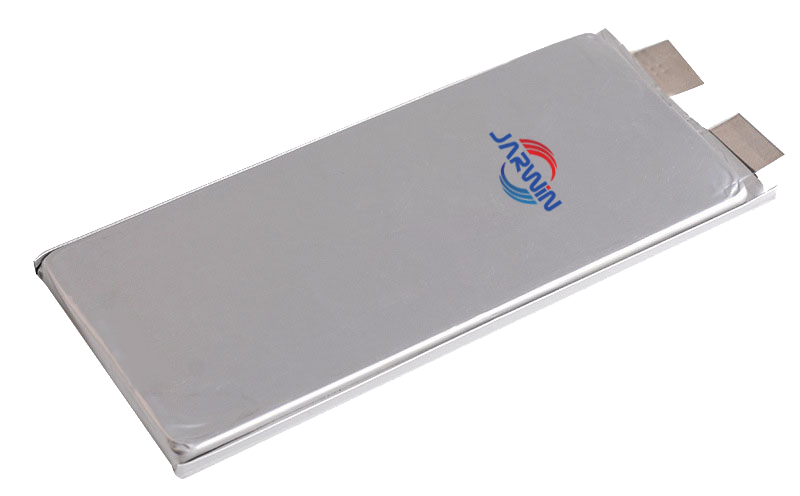
LiPo packs, often built on high‑energy NMC‑family cathodes in soft pouch packaging, excel at delivering very high discharge rates with minimal initial voltage sag. That makes them a staple for heavy‑lift, emergency response, and dynamic flight envelopes where thrust spikes are routine. The tradeoffs show up in cycle life under aggressive duty and in mechanical susceptibility: pouch cells require stricter mechanical protection and more frequent DCIR monitoring.
Long-Life LFP: The Durability Specialist for High-Uptime Fleets
Lithium iron phosphate (LFP) prioritizes thermal stability and cycle life. Independent and internal technical overviews show LFP routinely outlasting high‑energy NMC/NCA under comparable conditions; it is the durability‑first choice where mass per kWh is secondary to uptime and replacement cadence.
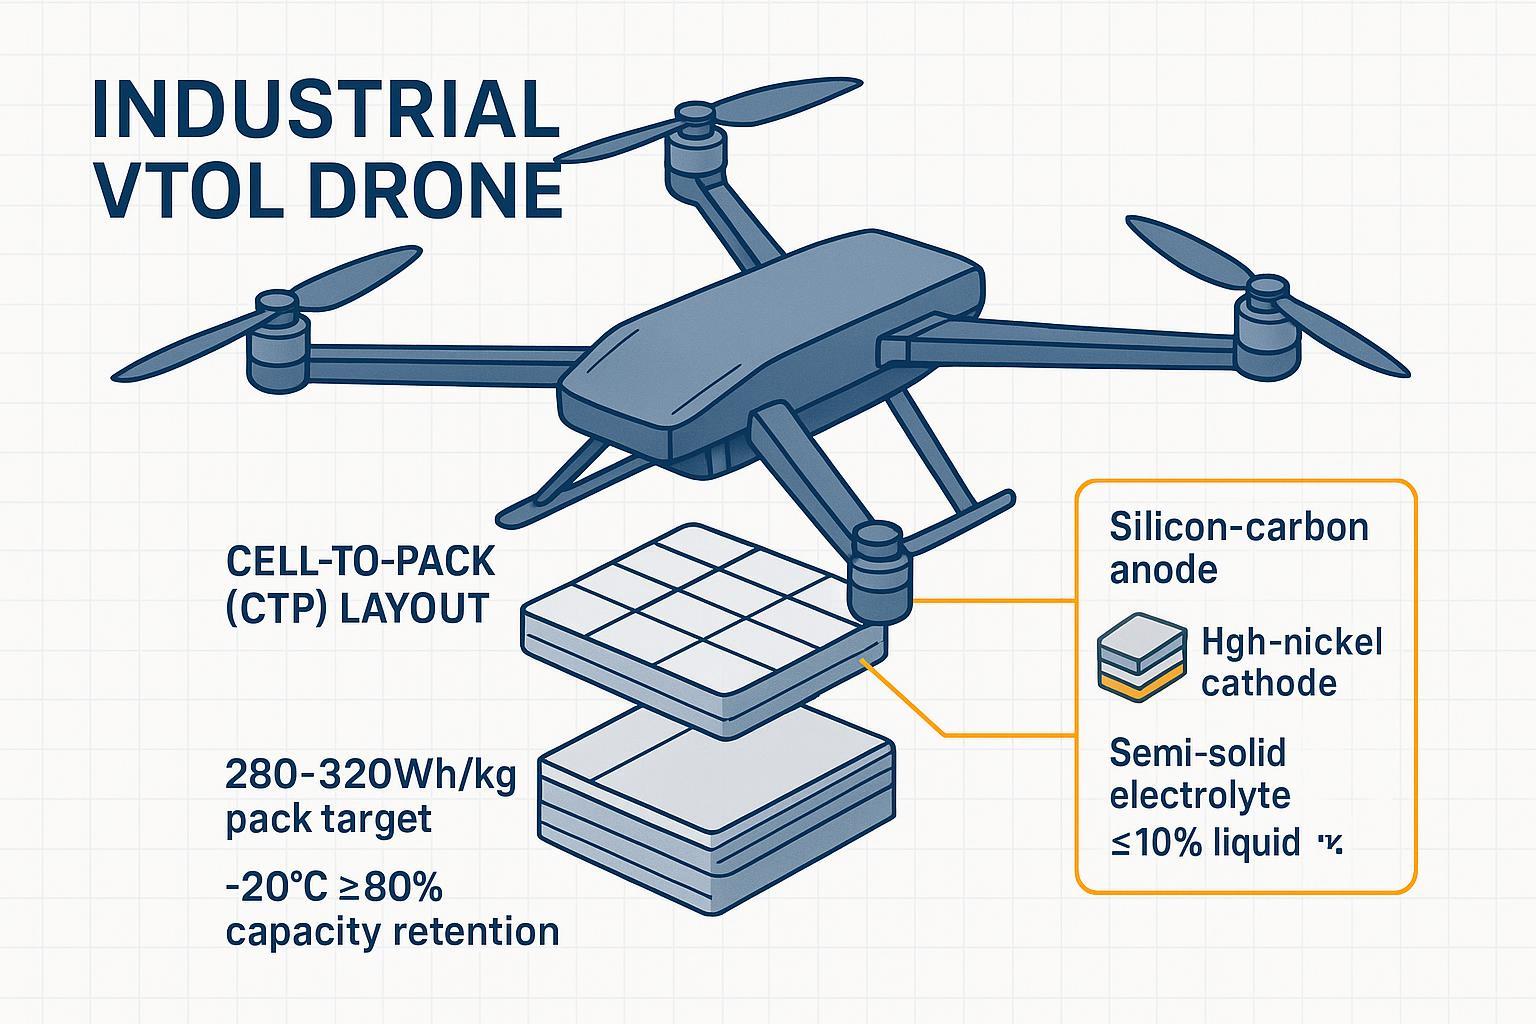
Semi-Solid Cells: The New Safety Bridge for 2026
Semi‑solid cells combine a predominantly solid electrolyte matrix with a controlled fraction of liquid or gel to maintain interfacial conduction.
Standards you should request before considering vendor or internal performance claims
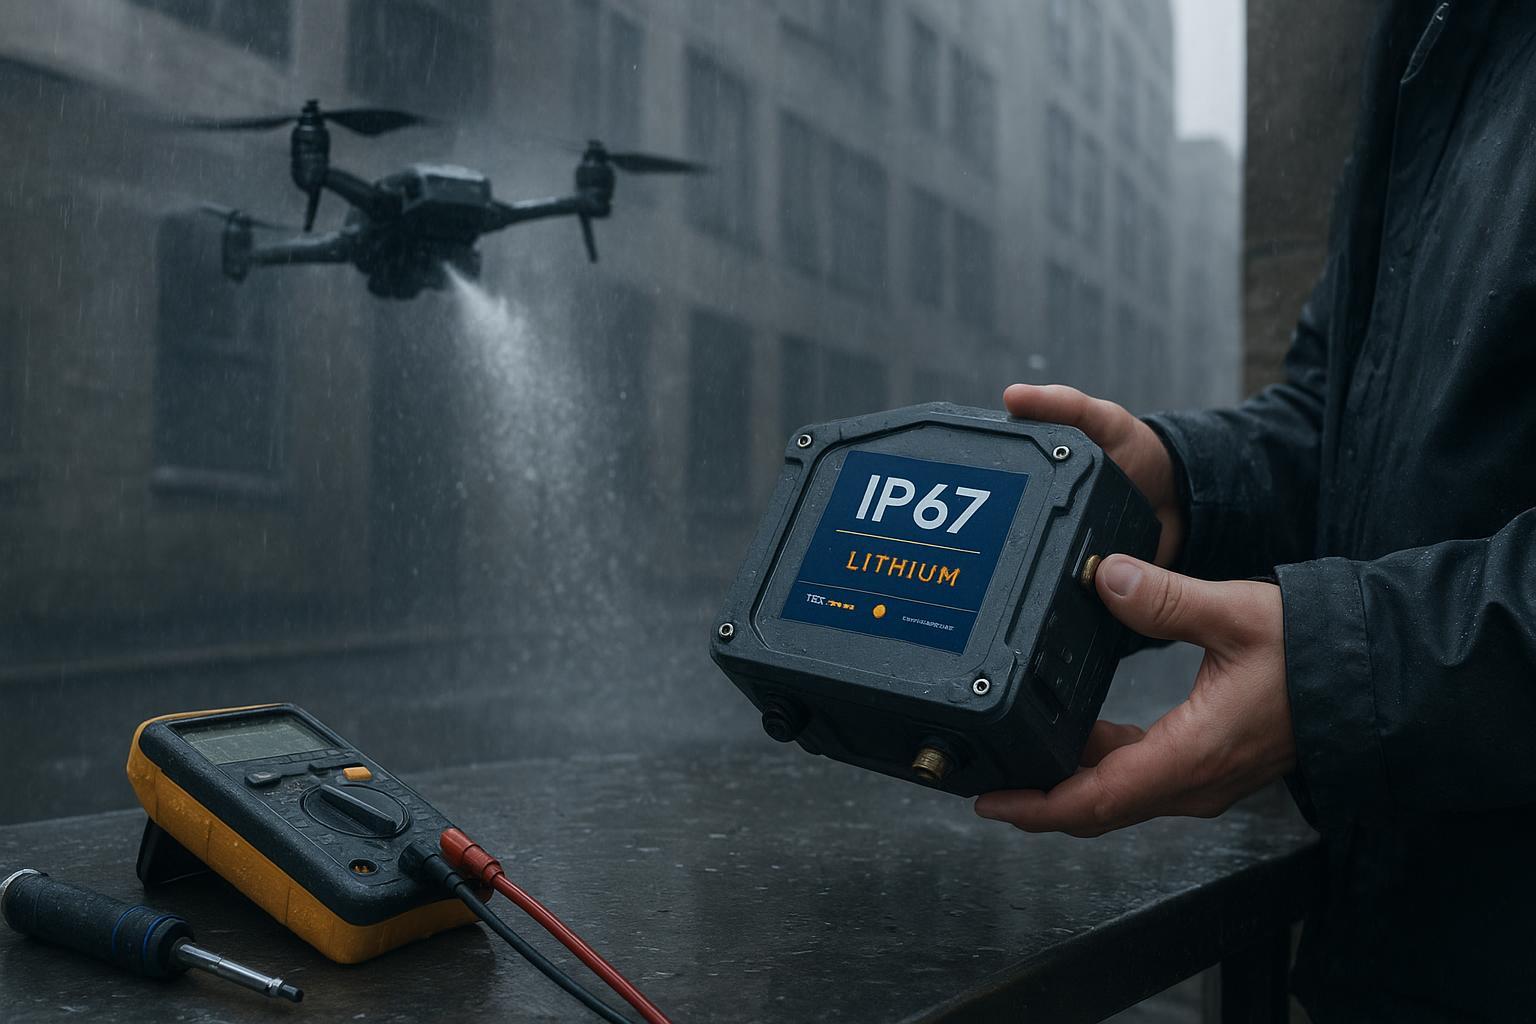
- UN38.3 Test Summary (UN Manual of Tests and Criteria, Section 38.3): mandatory transport design tests (T.1–T.8). See the UNECE UN38.3 reference materials.
- IATA Lithium Battery Guidance (2026): shipping/SoC and documentation expectations—request the supplier’s IATA‑aligned test summaries and DG paperwork (see the IATA guidance PDF).
- Cell and pack power measurement methods (IEC/ISO): request cell DCIR/pulse‑power test methods consistent with IEC 61960 or referenced ISO tests.
- Industrial cell safety standards: IEC 62619 / IEC 62133 where applicable for secondary cells and battery systems used in industrial equipment.
Require suppliers to provide test protocols, sample sizes, and raw traces (thermal camera, voltage/current vs time, DCIR over cycle) for any claim you will budget against.
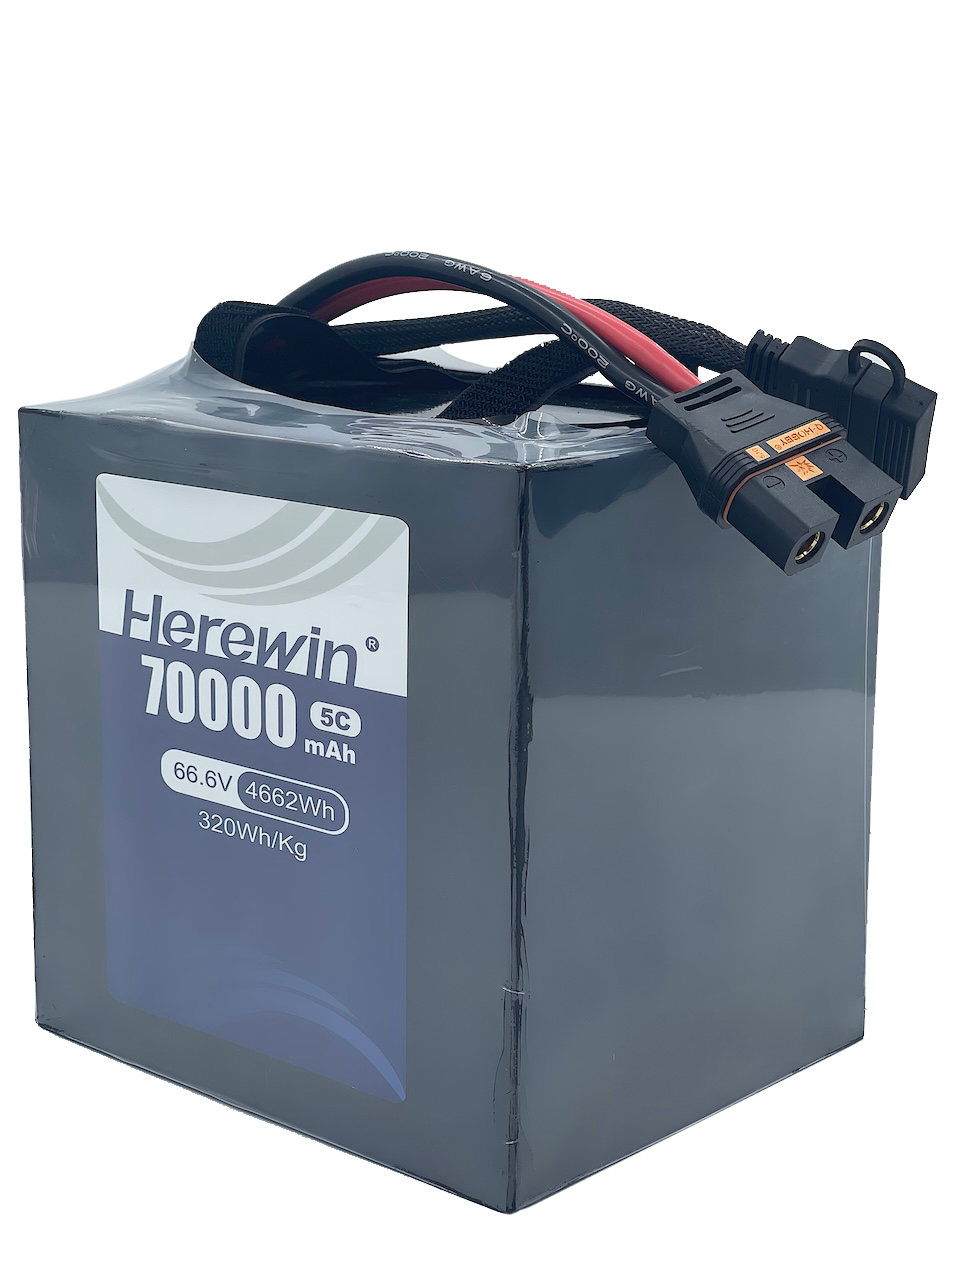
Herewin Lab Data indicates cell‑level energy densities of 300–400 Wh/kg (measured at 0.3C, 25°C) in production‑cell batches. These preliminary supplier‑reported results provide a benchmark for 2026 performance modeling; however, procurement teams should request raw cycle‑life CSVs and thermal traces directly from the supplier to validate these metrics against specific mission profiles before final award. A full verification checklist and the required metadata for third‑party replication are provided in the Appendix.
Note on test conditions and data attribution: All numeric performance values in this guide are labeled as either supplier‑reported or third‑party verified and reflect specific test conditions (temperature, C‑rate, SoC, BMS on/off). Always request vendor raw traces (voltage/current/thermal CSV), sample size (n), batch/date, and the exact test method (IEC/ISO or accredited lab) before acceptance.
LFP vs LiPo Industrial Drone Batteries 2026: Performance Metrics That Decide ROI
When procurement asks why one pack costs more, the answers live in measurable physics and standards‑style tests. Three domains matter most.
Safety mechanics and the Al‑anode puncture pathway
High‑Quality Third‑Party failure analyses and supplier test programs identify several internal short scenarios under puncture; the most dangerous short path observed in needle‑penetration tests is between the aluminum cathode current collector and the anode film. Herewin’s supplier‑reported measurements for matched needle‑penetration protocols indicate an Al‑anode contact resistance of approximately 800 mΩ, which produces very rapid localized Joule heating capable of overwhelming common thermal‑mitigation features. Treat this numeric value as supplier‑reported: always request the supplier’s puncture protocol, thermal camera trace, peak temperature/time curves, and raw resistance traces for independent verification before budgeting or acceptance.
Semi‑solid designs add a safety margin by reducing free liquid pathways and lowering heat‑generation during internal shorts in matched tests; require matched‑protocol comparisons and raw thermal traces when suppliers claim improved abuse outcomes. Independent literature characterizes the chain from separator damage to exothermic reactions under mechanical abuse (see the Energy Materials Advances 2023 thermal runaway review).
Achieving 300+ Wh/kg via Silicon-Carbon Anodes
Herewin Lab Data report cell‑level energy densities of 300–400 Wh/kg (measured at 0.3C, 25°C) in production‑cell batches. Treat these figures as supplier‑reported benchmarks for 2026 performance modeling; procurement teams must request pack‑level Wh/kg, delivered BMS settings, mechanical protection detail, and the raw cycle‑life and thermal CSVs to validate usable energy in your mission profile before award.
Internal resistance and the voltage‑sag problem
Under load, terminal voltage drops by I × R and resistive heating scales as I²R. High‑C maneuvers on ageing packs accelerate voltage sag and heat. Track DCIR (Direct Current Internal Resistance) drift and size packs so worst‑case mission current remains well below the point where sag will trip BMS undervoltage or generate hazardous heating. Require supplier DCIR‑vs‑cycle curves, pack‑level IR baselines measured by IEC/ISO‑aligned pulse methods, and acceptance testing that includes worst‑case pulse profiles to ensure long‑term ROI.
Mission Mapping: Match Chemistry to Mission Profile
Map missions to chemistries using peak current draw, thermal environment, and required fleet swap cadence.
Heavy‑lift logistics and emergency response
When thrust spikes dominate, low initial DCIR and validated C‑ratings matter more than headline energy density.
- Selection: High‑rate LiPo remains the benchmark for sustained multi‑C power windows.
- Strategy: Pair high‑rate packs with strict DCIR monitoring, thermal cooldown procedures after intensive sorties, and conservative retirement thresholds to prevent swelling and thermal stress under repeated high‑stress duty cycles.
- Emerging tech: Validated semi‑solid high‑rate series are becoming viable alternatives; supplier‑reported tests indicate improved thermal safety during rapid discharge, but require matched‑protocol abuse and DCIR‑vs‑cycle traces for procurement acceptance.
Power‑line and pipeline inspection for long endurance
Cruise‑current missions reward higher Wh/kg and careful packaging choices (for example, pouch‑cell mass savings versus metal cans).
- Selection: Semi‑solid high‑energy packs can raise endurance margins when their cell‑ and pack‑level Wh/kg and cycle stability are independently verified. Some supplier materials report cell‑level energy densities in the 300–400 Wh/kg range (supplier‑reported benchmark); procurement should request pack‑level Wh/kg, usable energy at mission C‑rates, and raw cycle CSVs before treating those figures as contractual performance.
- Budget choice: LFP remains attractive where weight budgets allow heavier packs in exchange for much lower TCO driven by long calendar and cycle life (commonly cited 2,000+ cycles in industry literature; verify per supplier test method and warranty terms).
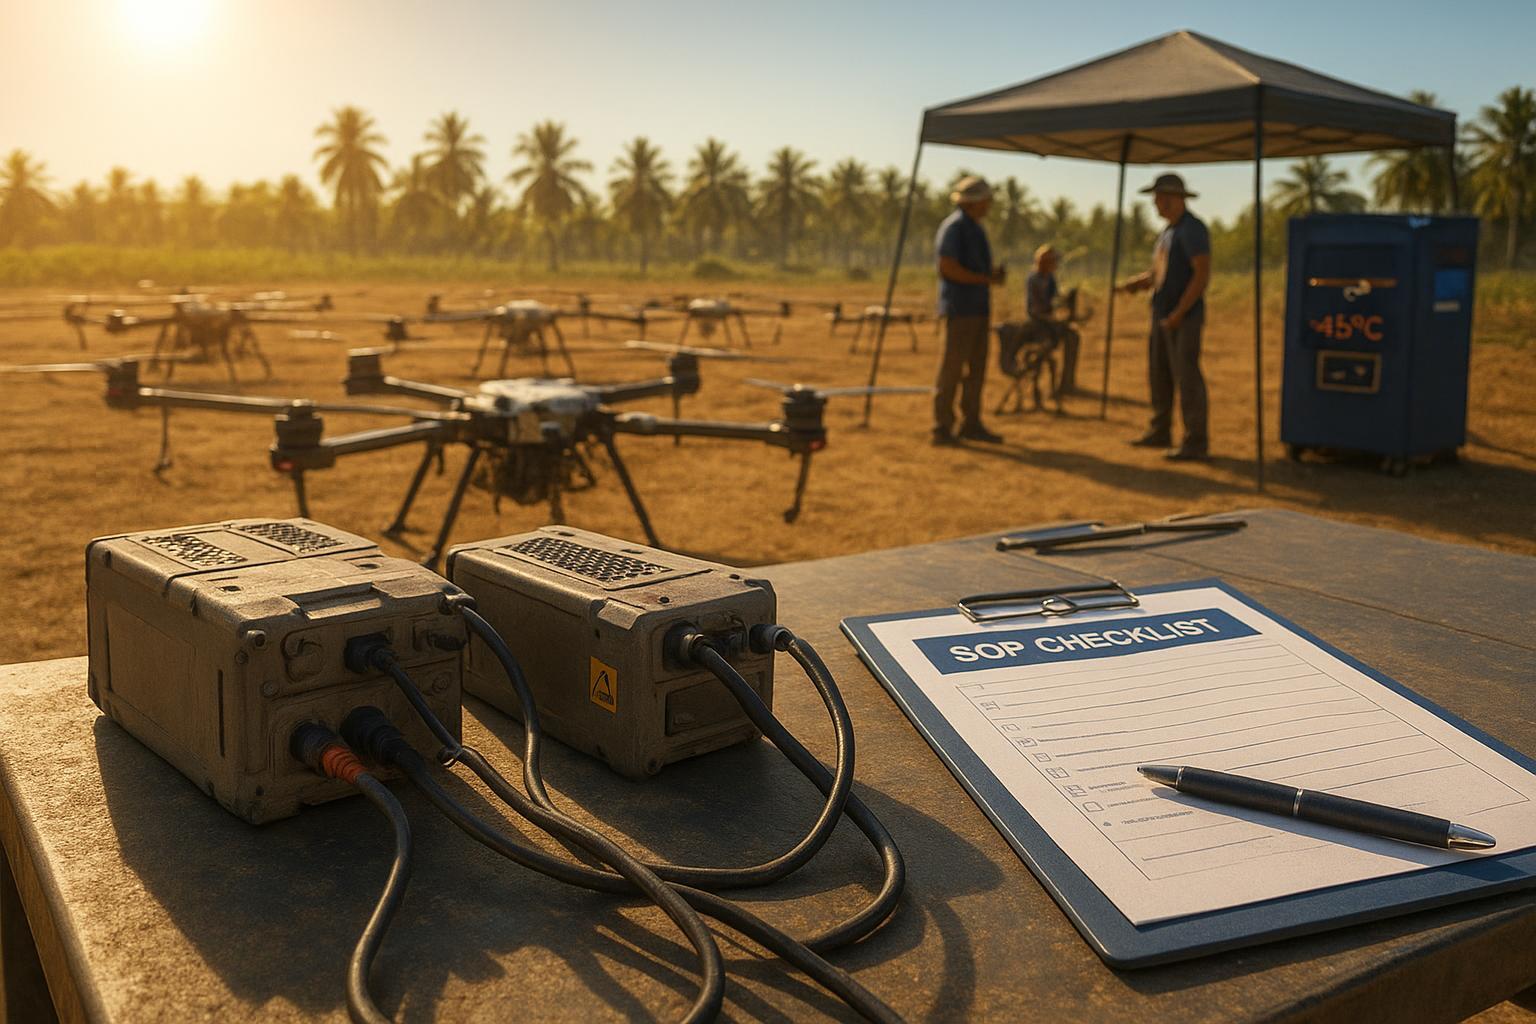
High‑altitude and cold operations (−20°C class)
Cold elevates impedance and triggers voltage sag; design and procedure choices determine whether a mission is feasible without preheating.
- SOP: Preheat to ~20–25°C when operationally possible to reduce DCIR and immediate sag risk; insulate packs and avoid high‑current maneuvers until telemetry shows stable voltages.
- Performance: Herewin‑reported field trials for selected Low‑Temp Series indicate retention of ≥80% usable capacity at −20°C in controlled laboratory conditions. Procurement teams should require the trial metadata — sample size, test dates, SOC, thermal traces — and independent replication when mission critical.
- Precaution: For cold‑start operations rely on real‑time telemetry to confirm internal self‑heating and voltage recovery after takeoff; if telemetry shows continued sag or instability, abort or shorten the sortie and follow your hazardous‑failure SOPs.
Cost‑Effectiveness and ROI: Convert Performance into Cost per Flight Hour
Procurement decisions must translate chemistry and reliability differences into dollars per flight hour. We recommend a dynamic TCO model that captures real‑world degradation and operational costs rather than a one‑off sticker‑price comparison.
The Drone Battery TCO Formula: Beyond Sticker Price
Cost/Hour = Pack Price / Life Hours + Swap Labor + Failure Risk Cost
Where:
- Pack Price = purchase price per pack (USD).
- Life Hours = expected usable life in flight hours (cycles × average flight hours per cycle).
- Swap Labor = average labor and logistics cost to swap/prepare a pack per flight hour (USD/hr).
- Failure Risk Cost = allocated cost per flight hour for unexpected failures (replacement, downtime, crash risk), modeled as Failure Probability × Cost per Failure.
Key Modeling Notes & Risk Sensitivity
- Convert cycles to Life Hours using your mission profile: Life Hours = Rated Cycles × Avg Flight Hours per Cycle (e.g., typical mapping sortie 30–45 min). Use measured cycle degradation curves (DCIR and capacity vs cycle) where available to adjust usable cycle count to a realistic retirement threshold (e.g., retire at 80% SoC capacity).
- Model Failure Risk Cost using P‑level probabilities (P50 baseline failure rate; P95 extreme conditions). For example, estimate Failure Probability from field logs (failures per 1,000 flight hours) and multiply by conservative cost-per‑failure (replacement + labor + missed mission penalty).
- Include sensitivity bands (P5/P50/P95) to capture environmental stressors (heat/cold), operational aggression (high‑C bursts), and supplier quality variability.
Scenario Analysis — Standard OEM vs. Advanced Third-Party (Semi‑Solid)
Below are modeled Total Cost per Flight Hour results based on aggregated industrial field logs and current market price benchmarks. These scenarios illustrate why procurement should favor cost‑per‑hour comparisons over initial purchase price.
Assumptions (Aggregated Industry Benchmarks):
- Advanced Third‑Party (Semi‑Solid): Pack Price = $600; Representative cycle life ≈ 700 cycles.
- Standard OEM (LiPo): Pack Price = $1,000; Representative cycle life ≈ 200 cycles.
- Mission Mix: Avg. flight hours per cycle = 0.5 hours (30 minutes).
Scenario Results (Cost per Flight Hour)
| Scenario | Advanced Third‑Party (Semi‑Solid) | Standard OEM (LiPo) | Delta (Savings) |
|---|---|---|---|
| P5 (Best Case) | $7.67 / hr | $13.79 / hr | 44% |
| P50 (Base Case) | $9.19 / hr | $22.07 / hr | 58% |
| P95 (Worst Case) | $18.50 / hr | $41.07 / hr | 55% |
Note: These scenarios use aggregated performance data from high‑energy density series (for example, internal logs from select manufacturers) as an illustrative worked example. Procurement teams should request raw cycle‑life CSVs, DCIR‑vs‑cycle traces, and abuse‑test thermal traces for verification; see the Appendix for the full data‑verification checklist and required metadata.
Critical Takeaway: Even under the P95 stress case (extreme environmental or operational aggression), the modeled advanced third‑party pack remains substantially more cost‑effective. The primary drivers are extended usable life (more cycles converted into flight hours) and reduced failure‑related downtime costs.
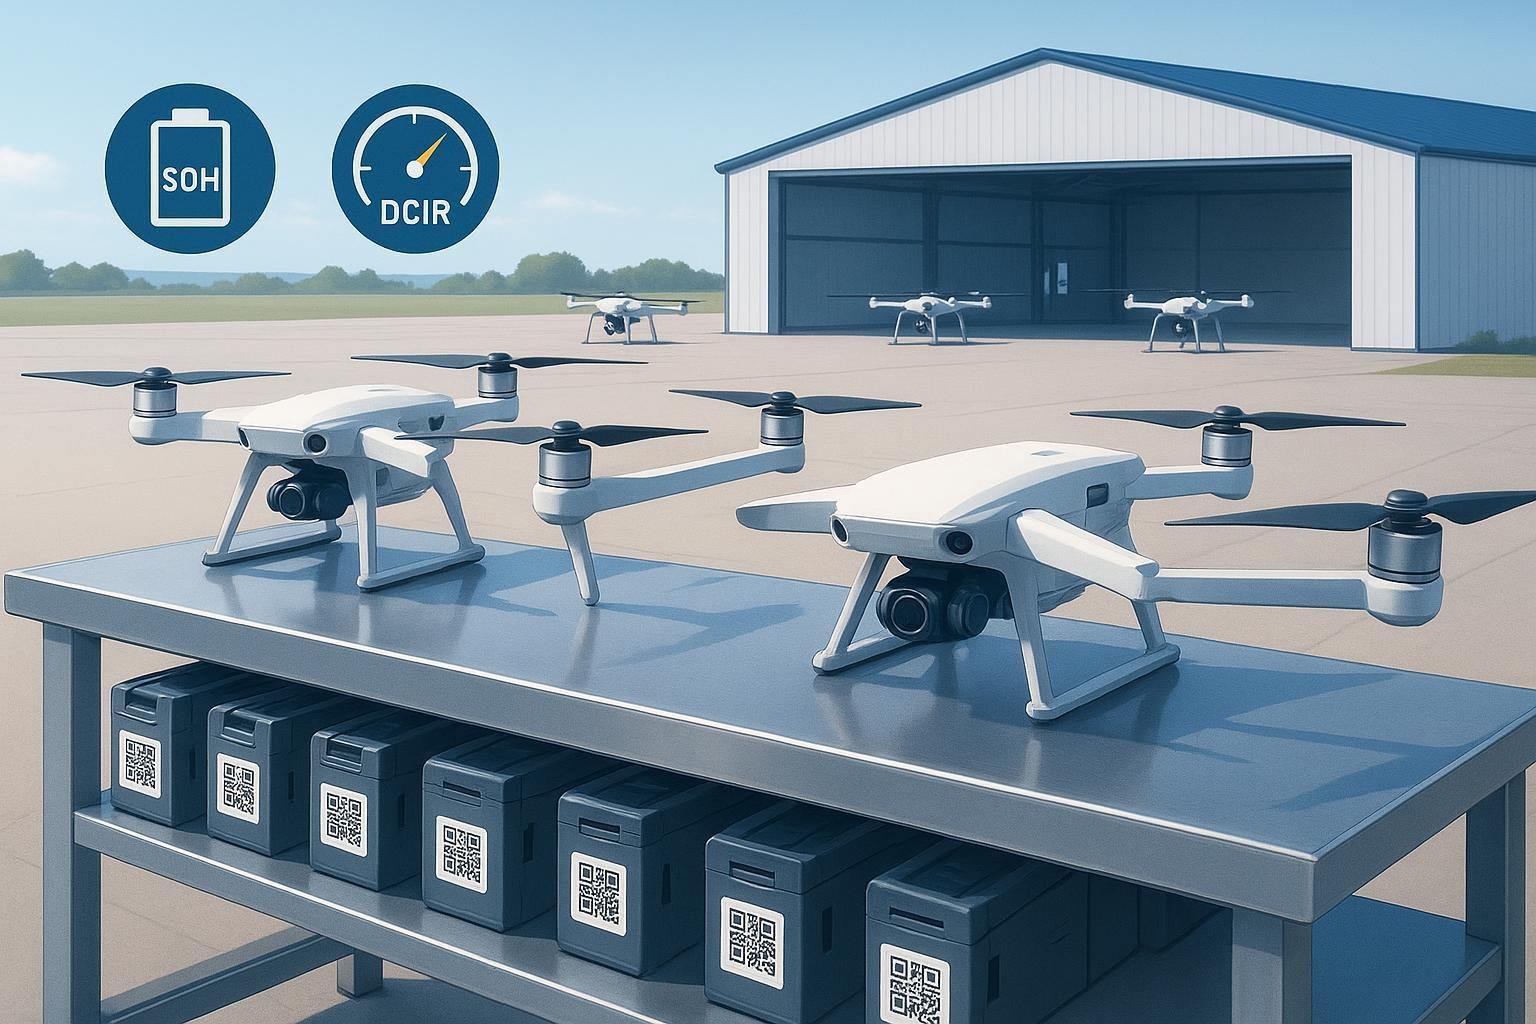
Drone Battery Selection and Maintenance: Avoiding Operational Failures
Selection checks you should always perform:
- Verify discharge headroom: Capacity (Ah) × C‑rating should exceed maximum continuous current by at least 20%.
- Require documentation: current UN38.3 Test Summary, SDS/MSDS, and the vendor’s puncture/thermal test summary.
- Inspect DCIR: request DCIR‑vs‑cycle curves and reject batches with out‑of‑family IR values.
- Confirm regulatory fit: for cross‑border procurement, verify conformity with the EU Battery Regulation (waste/recycling obligations, labeling, and extended producer responsibility) in addition to UN38.3 and regional safety standards.
Maintenance pitfalls that quietly destroy packs:
- Charger mismatch: Never use lead‑acid chargers. Use CC‑CV profiles within chemistry and temperature limits.
- Parallel imbalance: Avoid mixing packs with >5% capacity variance or >10% IR variance; mismatches force‑charge weaker units and accelerate degradation.
- Temperature neglect: For fleets operating in cold climates, use validated low‑temp series or preheat procedures and monitor SoC/SoH telemetry.
Three simple rules that protect uptime:
- Store packs at roughly 40–60% SoC for extended periods.
- Perform a full charge/discharge calibration every ~20 flights to keep SoC estimation aligned.
- Ensure packs are above ~20°C before high‑load flights when possible, or use validated low‑temp series that report strong usable capacity at −20°C.
2026 Technical Outlook for Semi‑solid and Beyond
Semi‑solid production in 2026 is a practical, commercially available bridge in selected product lines. Materials advances (nano Si‑C anodes) and manufacturing controls (liquid fraction 5–10%, controlled CTP integration) permit higher cell‑level energy while keeping abuse‑test performance demonstrably better than legacy liquid‑electrolyte cells in matched protocols. The path to fully solid‑state remains multi‑year; evaluate suppliers on audited abuse tests, cycle‑life datasets, and pack‑level integration rather than top‑line cell numbers alone.
FAQ
Can I use a lead‑acid charger for an industrial LFP drone battery?
No. Lead‑acid chargers use pulse/float profiles that damage lithium electrode interfaces. Always use CC‑CV within the chemistry’s voltage and temperature window.
Why does an LFP battery show half power but then die suddenly?
LFP’s flat voltage curve complicates SOC estimation. Calibrate BMS with periodic full charge/discharge cycles and monitor SoH trends to avoid sudden cutoffs.
Is it safe to run old and new batteries in parallel?
Avoid it. Differences in internal resistance above ~10% cause current imbalance that forces heat into the weaker pack.
How should we handle operations in −20°C conditions?
Where possible, use validated low‑temp packs; Herewin Low‑Temp Series retain ≥80% capacity at −20°C in field trials. If using standard packs: preheat to 20–25°C, insulate, and avoid high‑load maneuvers until telemetry confirms stable voltage recovery.
Is the premium cost for semi‑solid batteries worth it?
If a semi‑solid candidate delivers audited abuse‑test advantages, verified cycle life, and pack‑level Wh/kg that meets your mission, it can reduce TCO by lowering failure incidence and increasing usable mission duration. Require supplier test summaries and independent lab certificates as part of procurement.
What should I do if a battery is swollen?
Retire it immediately. Swelling indicates internal gas generation from decomposition. Never puncture or compress it; follow your hazardous waste and battery recycling procedures and consult the supplier’s MSDS for disposal instructions.
Appendix — Methods, Verification Checklist and Data Requests
(Full verification procedures and required metadata for supplier claims.)
- For any supplier‑reported quantitative claim, request: sample size (n) and batch/ID; test dates; controlled temperature; test rig and fixture details; exact C‑rate and charge/discharge protocol; raw traces (voltage/current/thermal vs time); and statistical intervals (mean ± SD or 95% CI).
- For abuse claims, request matched‑protocol thermal camera traces (needle/nail/impact), peak temperature/time curves, and test chamber logs.
- For cycle life claims, request capacity vs cycle CSVs with defined DoD, rest conditions, and DCIR‑vs‑cycle data measured by an IEC/ISO‑aligned pulse method.
- For transport and compliance, require UN38.3 Test Summaries, SDS/MSDS, CE/UKCA/UL certificates as applicable, and any independent lab certificates.
- Example procurement clause: “Supplier must provide UN38.3 Test Summary, raw capacity-vs-cycle CSV (n≥10), DCIR-vs-cycle traces, and thermal abuse traces within 10 business days of bid award for acceptance testing.”
Data requests (priority):
- DCIR vs cycle count vs temperature (−20°C, 0°C, 25°C) for representative LiPo, LFP, semi‑solid packs.
- Puncture/needle test thermal camera traces and temperature‑time curves with matched SOC conditions.
- Flight‑profile endurance tests (mapping payload) showing mission time distributions and SoC traces.
- Cold‑start preheating trials documenting failure rate reduction and endurance uplift.
Sources
- Nature Energy (2023), “Solid‑state batteries: from ‘all‑solid’ to ‘almost‑solid’” — semi‑solid spectrum context.
- Energy Materials Advances (2023), “Thermal‑runaway mechanisms and propagation” — comparative review of abuse pathways.
- ACS Omega (2022), “Degradation and heat‑generation pathways in lithium‑ion cells” — mechanisms leading to thermal events.
- IATA (2026), “Lithium Battery Guidance Document (2026)” — shipping, SoC and documentation expectations.
- UNECE / UN (Rev. 8), “UN Manual of Tests and Criteria — Section 38.3” — required transport abuse tests (T.1–T.8) and Test Summary guidance.
- Argonne National Laboratory (2024), “Technology and component projections for advanced anodes” — context for Si‑C adoption and energy‑density expectations.
- BatteryDesign.net (2022–2023), “DCIR and ACIR measurement overview” — practical measurement methods and pack‑level implications.