


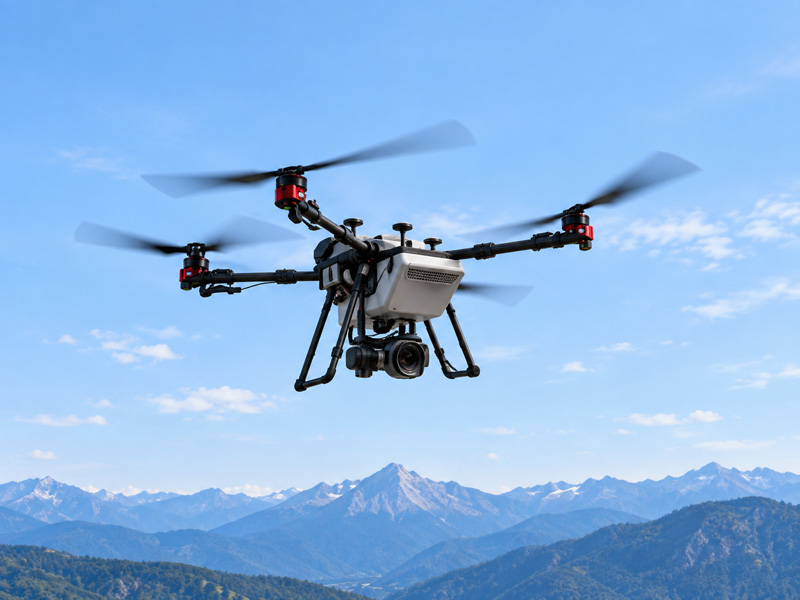



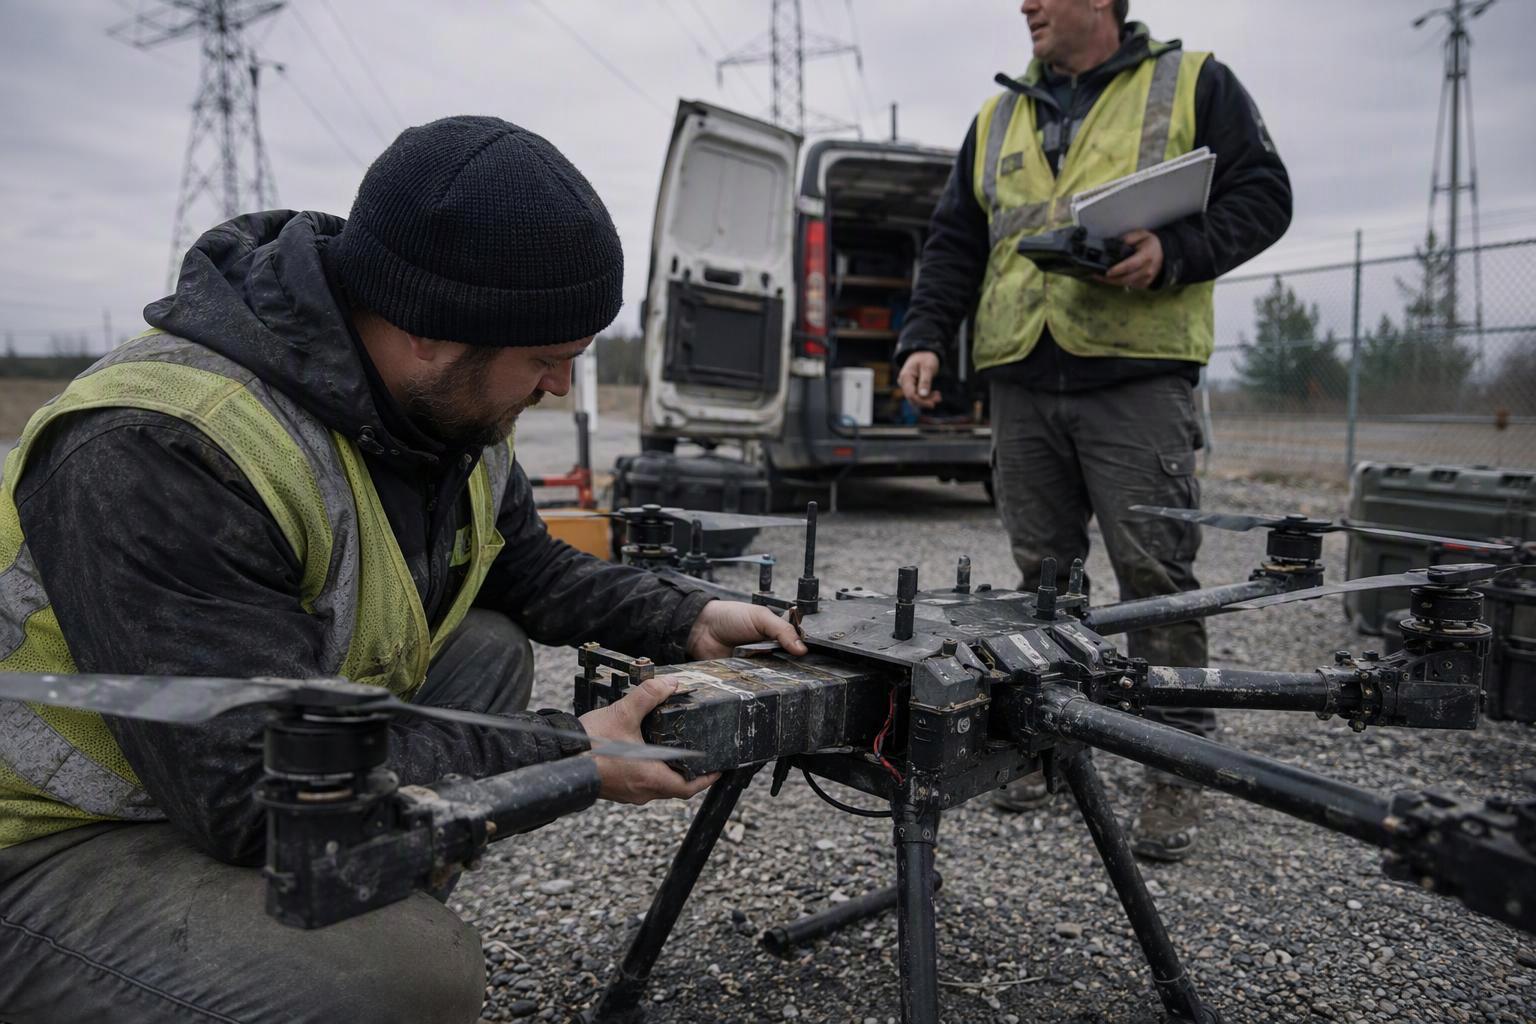
Picture a calm morning: your aircraft lifts off with a light load, the wind is behind you on the way out, and the battery percentage drops slower than you expected. Half an hour later you turn for home, and now the wind is in your face, the airframe is heavier by a payload, and there’s a ridge between you and the launch point. The number on the screen is still comfortably above your return threshold. What it can’t tell you is whether the trip home will cost more energy than you have left, or whether the pack can push hard enough through the climb.
That’s the trap. Two flights can reach the same return-to-home state of charge and still carry very different safety margins. A headwind, a heavier payload or a climb on the return route can increase the energy the trip home needs and raise power demand during some flight phases, without changing the number on the display. The trouble with a fixed SOC threshold isn’t the number itself — it’s that the number was never built to see any of this. It compares a percentage with a percentage, while the aircraft is comparing a route with a battery.
A drone battery return-to-home reserve is really an energy and power question. How much energy will the return leg take, and can the pack deliver the power that climb, cruise and wind conditions will demand for as long as they last?
Why a Fixed Battery Percentage Can Be Misleading
State of charge (SOC) is an estimate rather than a direct measurement of the energy available for a return flight. Its accuracy depends on the sensing hardware, the estimation model, the condition of the pack and the conditions in which it is being flown. Even an accurate SOC estimate does not, by itself, show whether the pack can deliver the required power under load.
|
Quantity |
What it tells you |
What it does not tell you |
|---|---|---|
|
State of charge (SOC) |
A model-based estimate of remaining charge from voltage, current and algorithm |
Whether the charge left can be delivered at the power the return leg needs |
|
Usable energy (Wh) |
Work the pack can still do under the expected load and temperature |
Whether instantaneous power demand stays inside the pack’s rating |
|
Power capability (W) |
Sustained discharge the pack supports at a given voltage, temperature, duration and system limit |
How long it can sustain that output |
SOC estimation error is not constant. Its magnitude depends on the battery system, the estimation algorithm, sensor accuracy, battery condition and operating conditions, so the displayed percentage always carries some uncertainty — and that uncertainty shifts with the flight. When operators report a percentage that drops faster than the flight profile can explain, the estimation is usually the first place to look, not the cells. SOC remains a useful input to battery management, but it should not be treated as a stand-alone measure of return-to-home capability.
What Determines the Energy Needed for the Return Flight?
Return energy depends on the actual route, wind, payload and the propulsion system’s power demand throughout the return flight, not on the straight-line distance back to the launch point. Each of those factors can change between the outbound and return legs of the same mission.
Distance, Route and Flight Profile
Even when the return route retraces the outbound path, the energy required may differ because wind, payload and flight conditions can change. What counts is the flight profile of the leg home: how much climbing it includes, whether it detours around an obstacle or a restricted area, and whether the aircraft has to hold before it can land. Straight-line distance captures none of that, which is why return estimates are usually built on time and route rather than on remaining range.
Wind Speed and Direction
Wind makes the two legs asymmetric, and that is what complicates the reserve. Think of how a location-based low-battery return trigger works: the aircraft does not wait for a fixed percentage, but judges from where it currently sits whether it still has enough to get back, and only then decides to turn home. Its warnings follow the same logic. Cancel the automatic return after a low-battery alert, and the aircraft may no longer have the power it needs to land safely. That is the asymmetry in practice: sufficiency depends on where the aircraft is and what wind stands between it and home, not on how much of the pack has been used. Different airframes implement that judgement in quite different ways, though — some with position, some with predicted energy, and some with a plain threshold.
Consider a mission flown with a tailwind on the outbound leg and a headwind on the return. The aircraft may reach its destination with more charge left than expected, yet need substantially more energy to get back, because groundspeed falls or the flight simply takes longer. A reserve based only on the displayed SOC can miss that change in what the return leg actually requires.
Payload and Mission Requirements
Payload changes the power required to hold altitude and to climb, so the same route flown with a heavier camera or a full tank costs more energy per minute. It also changes the balance between total energy and instantaneous power, in a way that can catch operators out: a heavy aircraft may finish the flight with charge to spare and still struggle to pull the current a steep climb demands. A reserve computed for an empty aircraft does not transfer to a loaded one, and payload capacity is bounded by what the pack can deliver as much as by the frame (payload and battery power limits).
Flight Power and Operating Conditions
Energy is power integrated over time, so the return budget depends on how the propulsion power demand varies across the whole return leg — the climb, the headwind stretch, the descent and any hold. An average power figure can seed a first estimate, but only if it fairly represents that leg; a mission average that includes a low-power cruise will understate a return that begins with a climb. Flight controllers handle this differently: some compare an estimated time to home against remaining flight time, others use position-based or condition-based energy predictions, and a few fall back to plain SOC thresholds. The exact trigger depends on the aircraft, the flight-control logic, the system configuration and the operating procedures — which is why a reserve estimate should be judged within the limits of the complete UAV system. Whichever logic is used, the number that matters is whether the pack can sustain the return load for that duration, not whether a percentage has crossed a line.
How Battery Condition Affects the Energy Available for Return
A pack that passed its acceptance test on the bench can still fall short on the way home. Aging and cold move the two quantities in the table above at different rates, and the gap opens exactly when the return leg asks for high current.
Temperature and Usable Capacity
Cold does two things at once: it cuts the energy you can pull out of the pack, and it raises the voltage sag under a heavy load like a return climb. How much it does either depends on the cell chemistry, the pack construction and the discharge rate, so no single correction factor is defensible, and a review of low-temperature behavior makes the same point from the cell side (Luo et al., PMC9698970). Those are cell-level results, not flight-time numbers. A winter reserve therefore has to come from the target pack’s own data, collected at the temperatures and discharge rates the mission actually uses — which is why cold-weather UAV battery specification is worth treating as a separate exercise from the summer baseline. A room-temperature datasheet figure says little about a cold morning.
Battery Aging and Internal Resistance
Capacity fade and resistance growth do not advance together. A meta-analysis of aging data across hundreds of cells found the two indicators diverging widely, which means neither one predicts the other (arXiv 2201.02891). Aging can affect capacity and resistance differently, so capacity alone does not fully describe a pack’s ability to supply the current a return climb requires.
That divergence is what breaks the reserve logic. A pack can age in ways its remaining capacity never shows: the kilowatt-hours left on paper and the amps it can actually push through a headwind drift apart, and a degraded pack may still show a perfectly healthy resting voltage — normal resting voltage is not evidence of healthy capacity, which is exactly what makes the reserve look safer than it is.
Voltage Sag Under High Loads
Drone battery voltage sag is the mechanism that turns a sufficient energy reserve into an insufficient power reserve. Under a high-current load, terminal voltage falls as current flows through the pack’s internal resistance. A pack with higher resistance can therefore experience greater voltage sag at the same current, and the effect grows as SOC falls and the cell’s open-circuit voltage drops. Depending on temperature, SOC, cell characteristics and system cutoff limits, the voltage may reach a failsafe threshold before the remaining energy is fully used — which is why where the discharge cutoff sits changes how much of the pack’s nominal capacity you can ever count on.
A healthy-looking resting voltage alone cannot establish whether the pack will maintain sufficient voltage under the return load. Loaded voltage is what the ESC and the failsafe see, and flight systems differ in how they treat it — some act on raw pack voltage, others compensate for sag (ArduPilot Battery Failsafe). The real limits sit in the cell, pack and flight-system specifications, so check the loaded voltage curve against those before trusting a computed reserve.
How to Estimate a Safe Return-to-Home Reserve
A safe return-to-home reserve is computed as an energy budget for the specific flight, then converted into a trigger the flight controller can act on. The relation is:
Remaining usable energy ≥ Return-leg energy + Reserve margin
The left side is not a number you can read off a percentage. Remaining usable energy means the energy the pack can actually deliver under the conditions of the moment — present temperature, current state of health and the power the return profile will demand — which is lower than nominal capacity and usually lower than a naive SOC-to-energy conversion. The right side is the work of the leg home, power integrated over time — a figure that has to be built phase by phase for the return leg, not taken from a flat mission average. The margin between them is an allocation for mission and system risk: estimation error, wind shift, a route change, the landing phase, an abort, and whatever your operating rules require. How much you allocate to each is a decision for the operator and the flight system, not a constant.
Treat the result as a screening model rather than a guarantee, and follow it with a power check against the limits the previous section set out. Four steps make it operational:
-
Compute the return-leg energy from the aircraft’s current position, the home point and the path it can actually fly back — including any detour or hold — then apply the forecast wind on that path, the payload, and the power the propulsion system draws through each phase: climb, cruise, headwind stretch and descent. An average can seed a first estimate, but only if it represents those phases fairly.
-
Add a margin sized to the operation, larger for complex terrain, variable weather or high-consequence missions, and smaller for a short flight over a controlled site.
-
Compare against usable energy, not nominal capacity, using the pack’s capacity at the expected temperature and its present state of health.
-
Set the trigger where the comparison still holds, so the aircraft turns home while the pack can both supply the return current and land with charge left.
There is no universal number for the margin, and no regulation will supply one. Regulatory frameworks differ in how they treat power management and safe operation, so the reserve you build has to satisfy the rules that apply to your operation and the limits your flight system defines.
What This Means for UAV Battery Selection and System Design
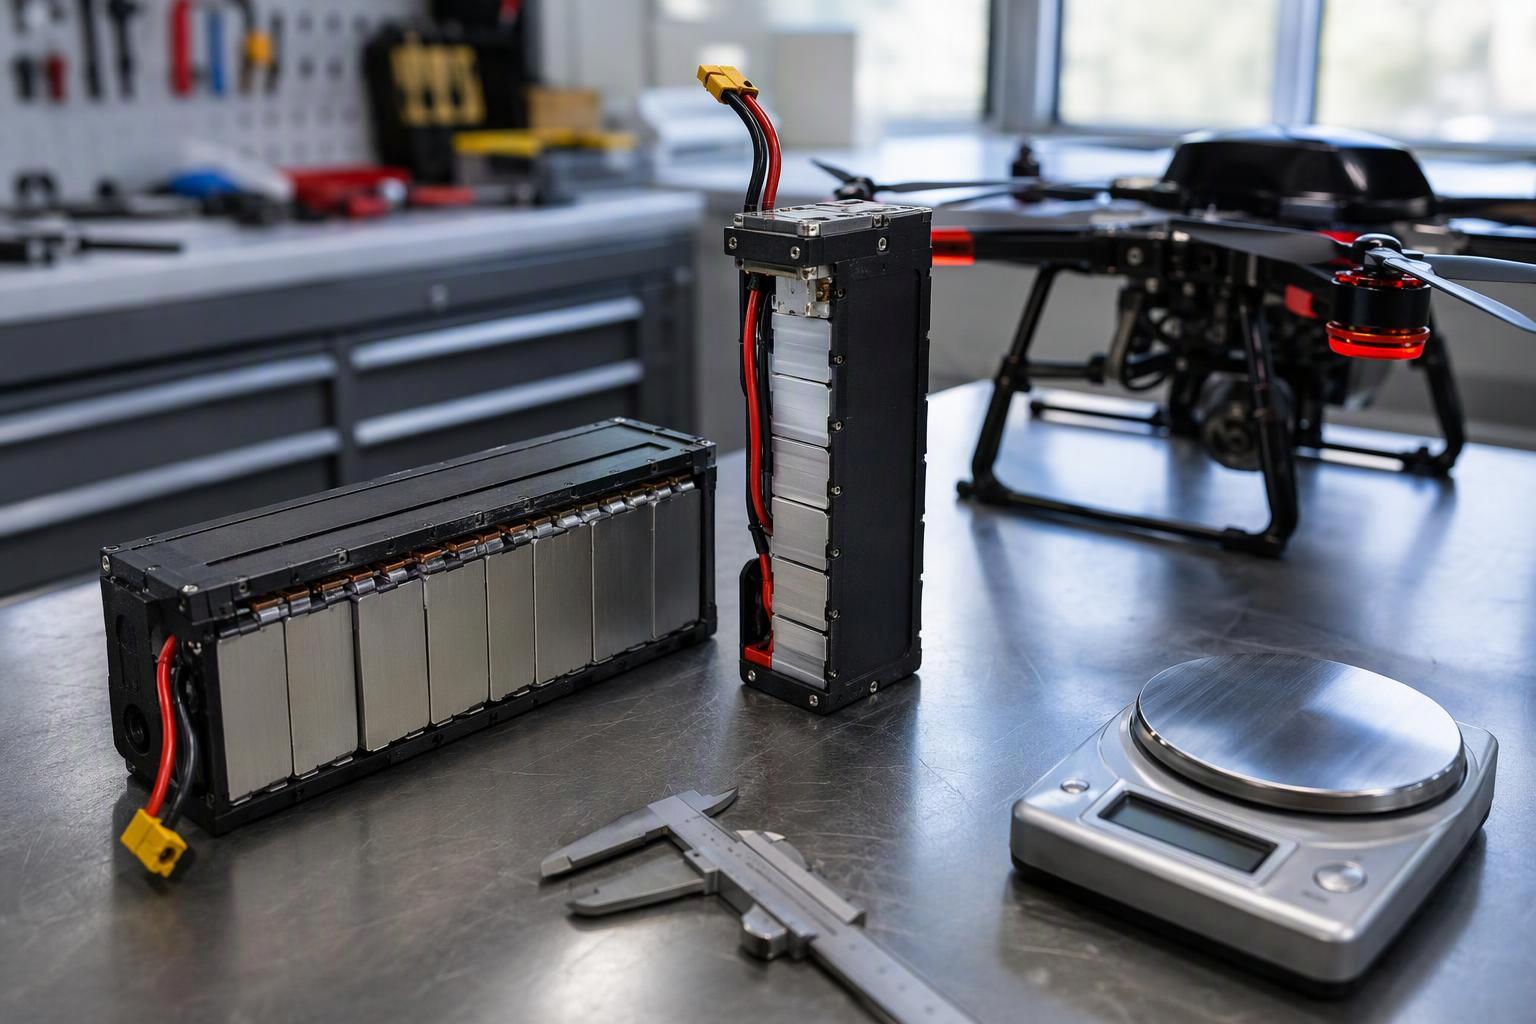
Once you know the return-to-home energy budget, the rest of the pack specification follows from it — including what power the cells must supply at the coldest temperature the mission will see. Nominal capacity is the least useful starting point. A larger pack adds weight, and the added weight raises the power the return leg demands, so the budget has to be re-run for each candidate rather than assumed to improve with ampere-hours.
That turns the exercise into a request for evidence, not a comparison of headline numbers. The table below frames each point the way a procurement or engineering review would.
|
What to verify |
Evidence to request |
|---|---|
|
Usable energy under real conditions |
Capacity or energy test data at the target temperature and the discharge rates the mission actually uses, not just a room-temperature datasheet figure |
|
Continuous discharge and loaded voltage behavior |
The continuous rating together with its test conditions, the loaded voltage curve, and the thermal limits that apply |
|
Battery health monitoring |
Whatever capacity, resistance or state-of-health data the BMS can supply, where available, plus an explanation of how each value is measured or estimated |
|
Compatibility with the flight system |
Voltage and current limits, protection thresholds and the verification results showing they match what the airframe and propulsion system expect |
Ask suppliers where each figure came from and what it was measured under, especially for health-state values: not every BMS exposes resistance or capacity estimates, and not every estimate is equally reliable in flight.
A percentage on the screen tells you very little about whether the aircraft can get home. What does is a reserve estimate built from the return route, wind, payload and operating temperature, then checks whether the pack can supply the required energy and power within the UAV system’s limits.
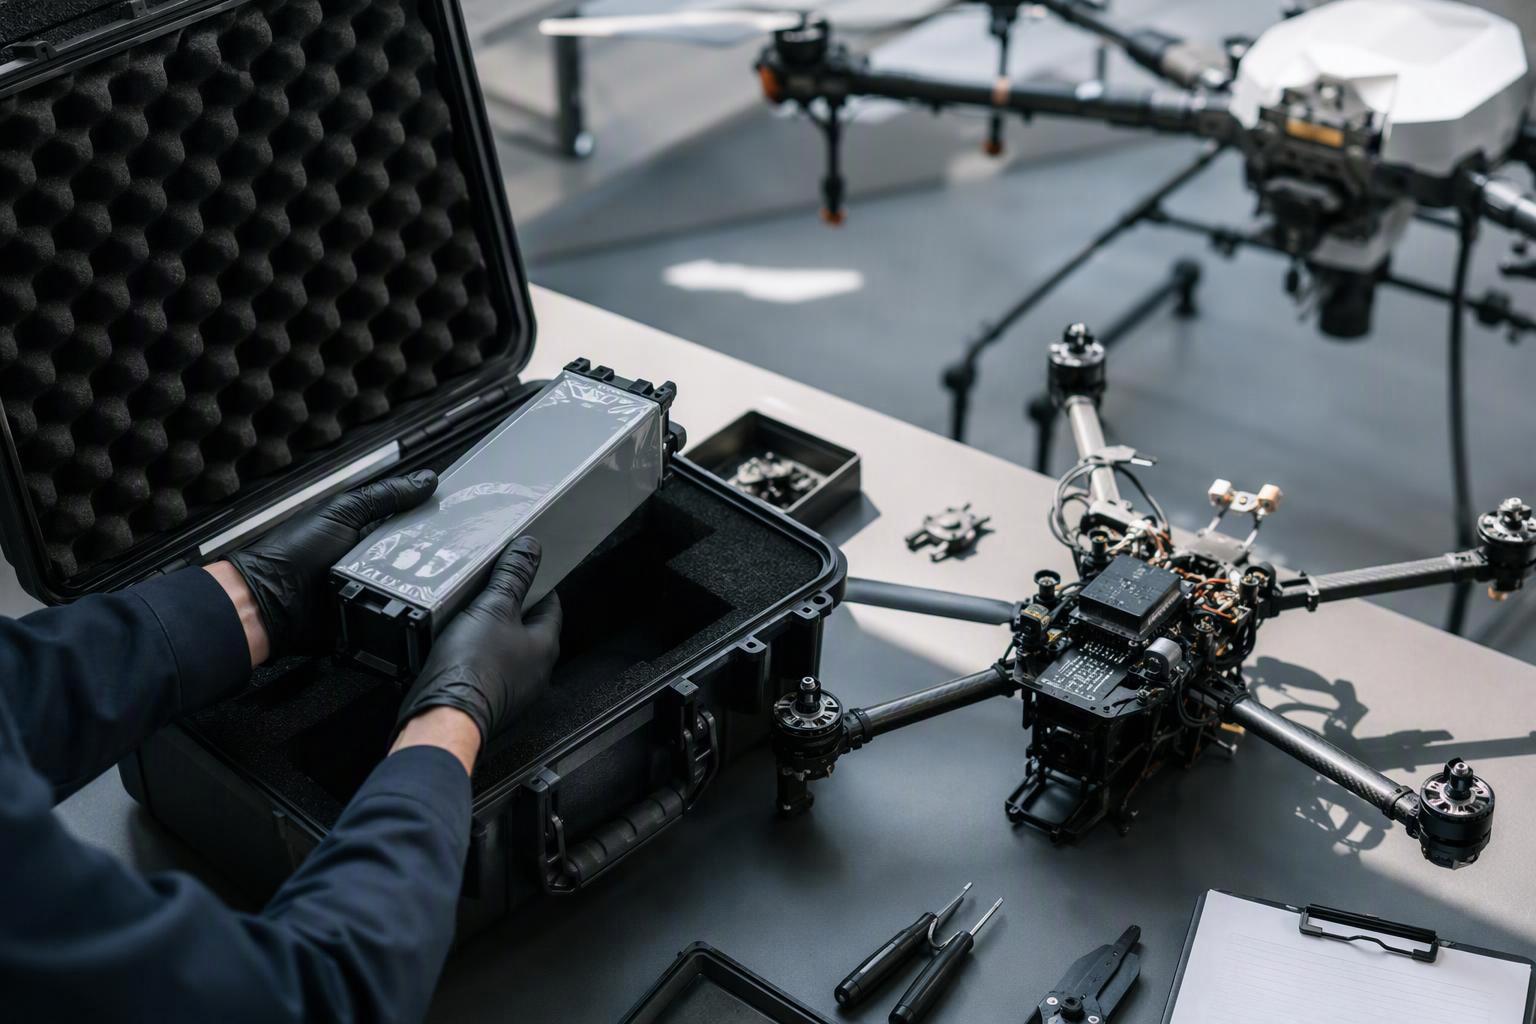
For UAV OEMs, that makes return-to-home planning part of battery system design rather than a percentage chosen in isolation. The pack has to be evaluated against the actual mission profile — loaded voltage behavior, temperature performance and the battery data a flight controller actually needs — and those results belong in the selection record, not only in the flight log.
If you’re evaluating a pack for a specific airframe, sharing the flight profile, payload, operating temperature and peak and continuous power requirements gives a more useful starting point than selecting by nominal capacity alone. That is also how the conversation tends to start at Herewin: with the mission data rather than the capacity on the label. If you’d like a second opinion on a reserve, you’re welcome to reach out with a flight profile.


 English
 Español
 한국어
 Deutsch
 Français
 日本語
 Русский
 Bahasa Indonesia
 ไทย
 العربية
 Português do Brasil
 Italiano
 Nederlands