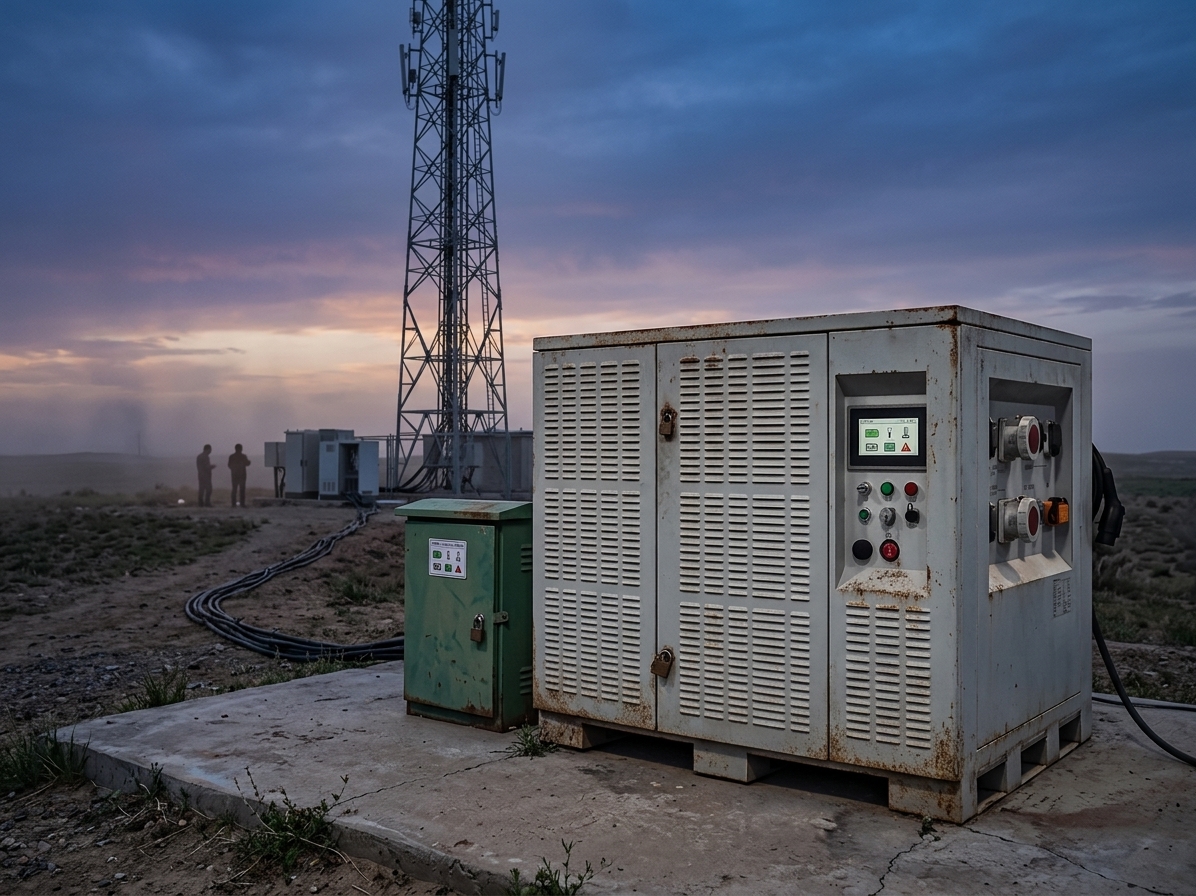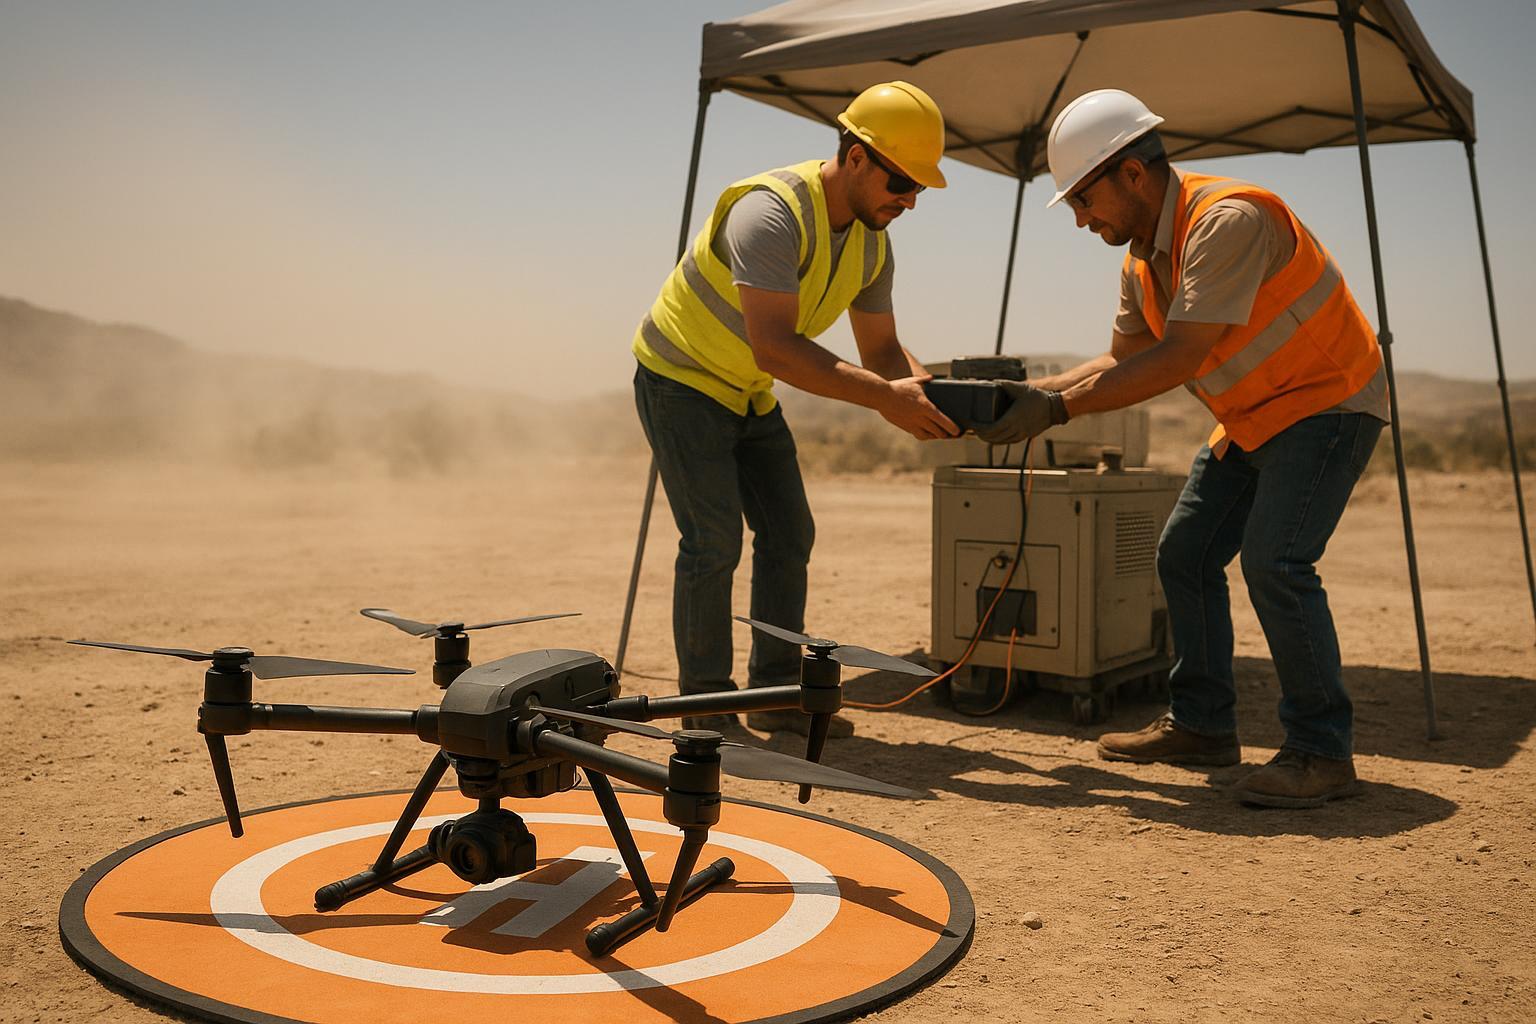
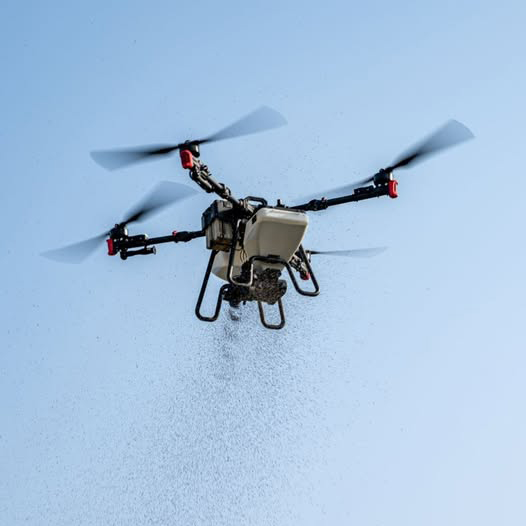


Industrial UAV fleets rarely fail because someone misread a spec sheet. They fail when dispatch becomes unpredictable: winter voltage sag that cuts a mission short, packs that drift out of balance mid-week, and “healthy” batteries that suddenly can’t hold load during takeoff.
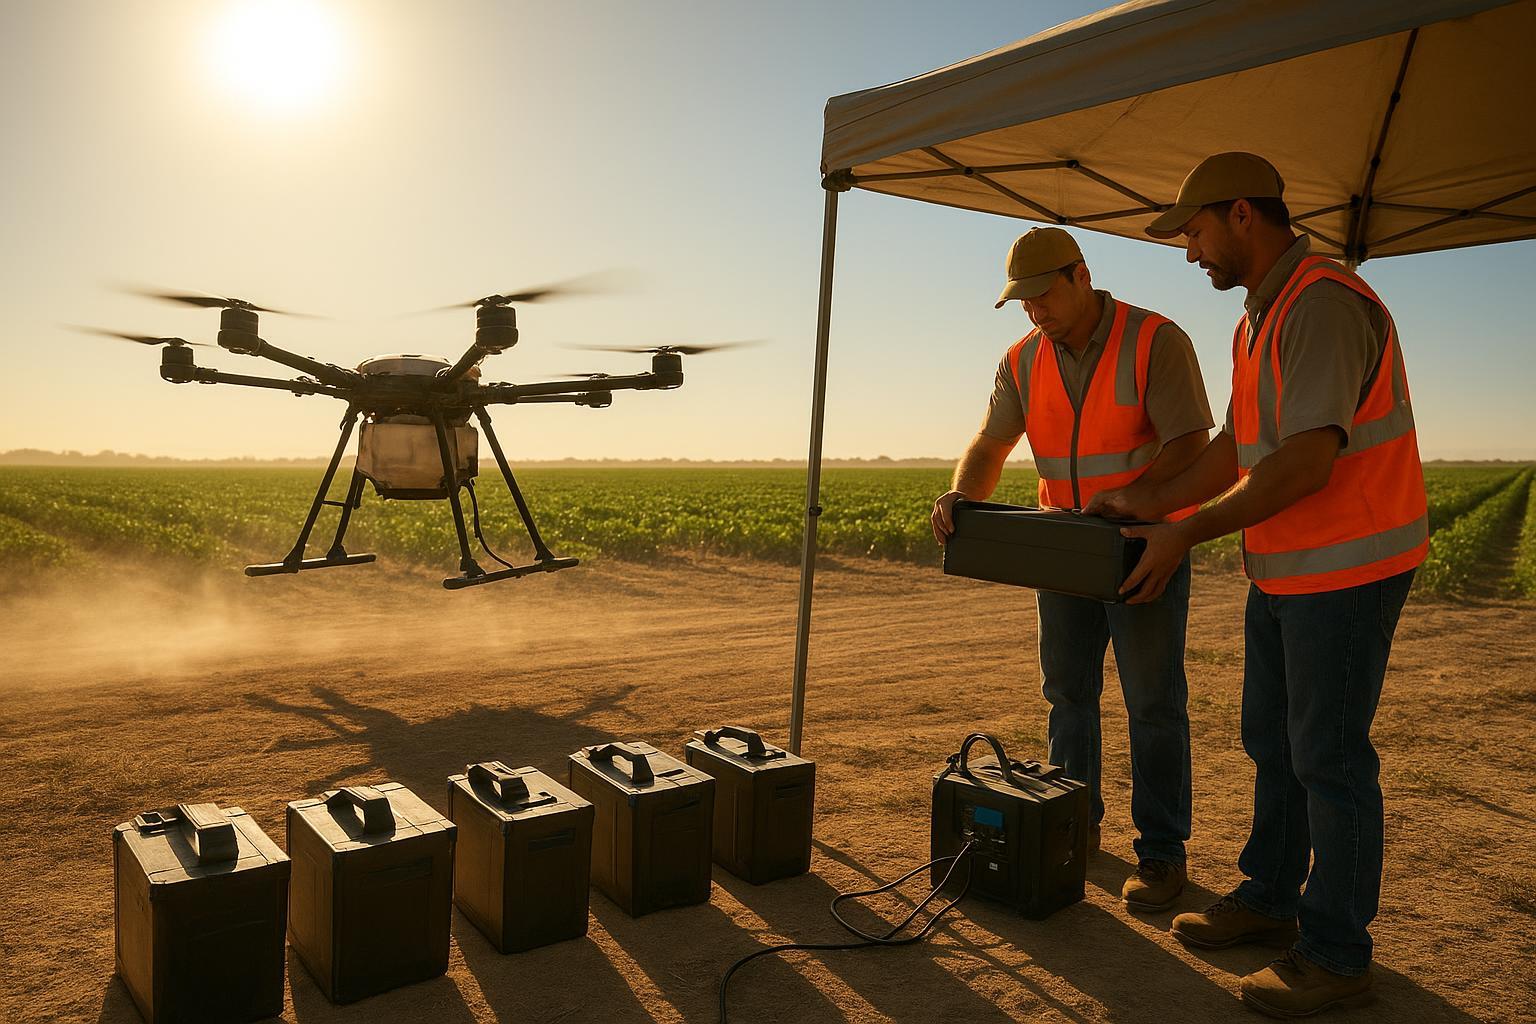
That’s why more fleet operators have started treating the battery pack less like a consumable and more like an operational asset. In that framing, the relevant metric isn’t “price per pack.” It’s cost per flight under the real duty cycle: high C-rate segments, repeated fast turnarounds, thermal stress, and long field days.
This article lays out the engineering logic behind that shift—why LiPo often creates a performance cliff in high-frequency operations, why lab lifecycle ratings fail to predict field outcomes, and what semi-solid drone batteries are trying to change with ~1,200-cycle targets.
The Hidden Cost of LiPo in High-Frequency Operations
LiPo remains a practical chemistry for many UAV profiles because it can deliver high power at low weight. The fleet problem is that high-frequency operations compress years of degradation into months—and the non-cell costs become visible.
The Performance Cliff After 300 Cycles
In UAV contexts, “cycle life” is commonly defined as the number of cycles until capacity falls below a threshold (often 80%). As one industry reference describes it, the “industry standard” for UAV LiPo is 300–500 cycles to that 80% line (definition and benchmark summarized in Unmanned Systems Technology’s UAV LiPo overview (2026)).
For clarity in this memo, UAV battery cycle life is treated as the cycle count at which the pack no longer meets the mission’s power and endurance envelope reliably—often earlier than the formal 80% capacity criterion.
In field operations, the more operationally relevant “cliff” is often earlier than the 80% threshold. It shows up as:
less usable power during high-load segments (takeoff, climb, aggressive maneuver)
earlier low-voltage warnings under the same mission profile
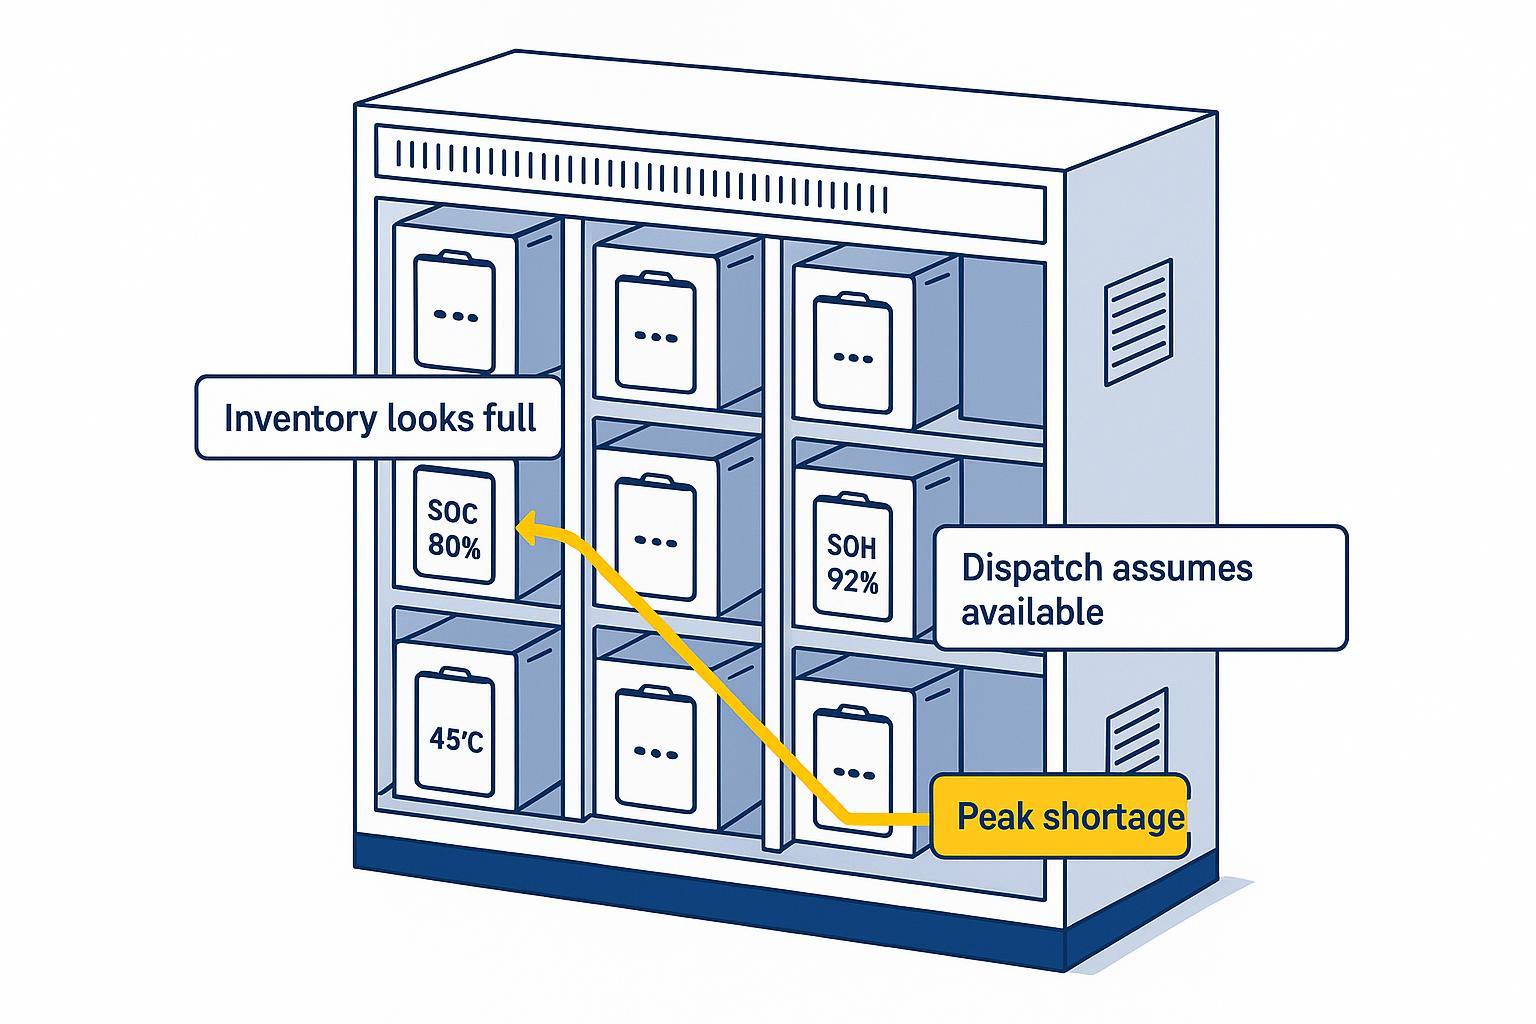
higher pack-to-pack variance inside the same fleet batch
Operators typically describe this as “the pack is still there, but the mission window is gone.” The battery hasn’t failed catastrophically; it has failed predictability.
Downtime and Replacement Overhead
The replacement cost isn’t limited to procurement. It tends to bundle multiple overhead streams:
downtime cost (airframe idle time, delayed mission completion)
charging logistics (more spares to keep sortie tempo stable)
maintenance labor (balancing, inspection, retirement decisions)
inventory friction (batch tracking, storage SOC discipline, shipping constraints)
Even when the pack price looks acceptable, these overheads are what move the TCO needle in high-frequency fleets.
Why Cost per Flight Matters More Than Price
A practical way to compare packs is to treat the battery as a per-flight asset.
A simplified baseline model:
Cost per flight ≈ (pack purchase price + fleet handling overhead) ÷ (usable cycles under mission profile)
Where “usable cycles” is not the lab spec; it’s the cycle count where the pack still produces stable voltage under load for the mission’s power envelope.
In high-frequency operations, cycle life is mostly an availability problem. Lower replacement frequency typically correlates with fewer scheduling disruptions and fewer “unknowns” in mission planning.
Why Battery Lifecycles Fail in Real Missions
The gap between a lab rating and a fleet rating exists because the mission is not a controlled experiment. It is a combination of stressors that vary by day.
Lab Ratings vs Real-World Stress
Lifecycle tests are typically run under defined conditions (temperature window, charge rate, discharge rate, depth-of-discharge, rest time). Field fleets typically combine:
high current draw during takeoff/climb
high depth-of-discharge when mission planning pushes endurance margins
thermal cycling (hot ground turns, cold air at altitude, repeating)
storage time at high SOC during logistics delays
For lithium-based systems generally, Battery University’s summary of stress factors highlights how temperature, depth-of-discharge, and time at higher charge voltage are repeatedly associated with faster degradation (see Battery University BU-808 (updated 2023)).
The important point for fleet ops is not which single factor is “the cause,” but that these variables coexist in real missions and make predictions brittle.
The Risk of Rising Internal Resistance
If you need one engineering variable that translates cleanly from electrochemistry to operations, it’s internal resistance (often tracked as DCIR in practice). In this context, “battery internal resistance” is treated as an operational risk indicator because it is observed alongside voltage sag under load and higher resistive heating at high current.
Two consequences matter to fleets:
Voltage sag under load
A battery can be modeled (at a basic level) as an open-circuit voltage source plus internal resistance. When current demand increases, internal losses increase and terminal voltage drops.
Heat generation
As internal resistance rises, so do resistive losses proportional to I²R during high-current segments. A peer-reviewed comparison paper on internal resistance measurement methods describes internal resistance as a key parameter for power capability, efficiency, and heat—and explicitly ties heat losses to an I²R relationship (see “Comparison of Several Methods for Determining the Internal Resistance of Lithium Ion Cells” (PMC, 2010)).
In other words: in high-power UAV profiles, resistance growth tends to be observed alongside more sag and more heat—both of which are operational constraints.
Why Lifespan Predictions Break Down
“Cycle count” alone is a weak predictor when the degradation mode that matters is power delivery stability, not just remaining capacity.
Lifespan predictions commonly break down when:
the duty cycle shifts (payload changes, wind, altitude profile)
ambient conditions move outside the assumed window (cold starts, hot ground turns)
charge/discharge rates drift higher over time to preserve sortie tempo
pack-level variance increases (cell mismatch, voltage delta, balancing burden)
In fleet terms, the pack “life” ends when it stops being operationally reliable.
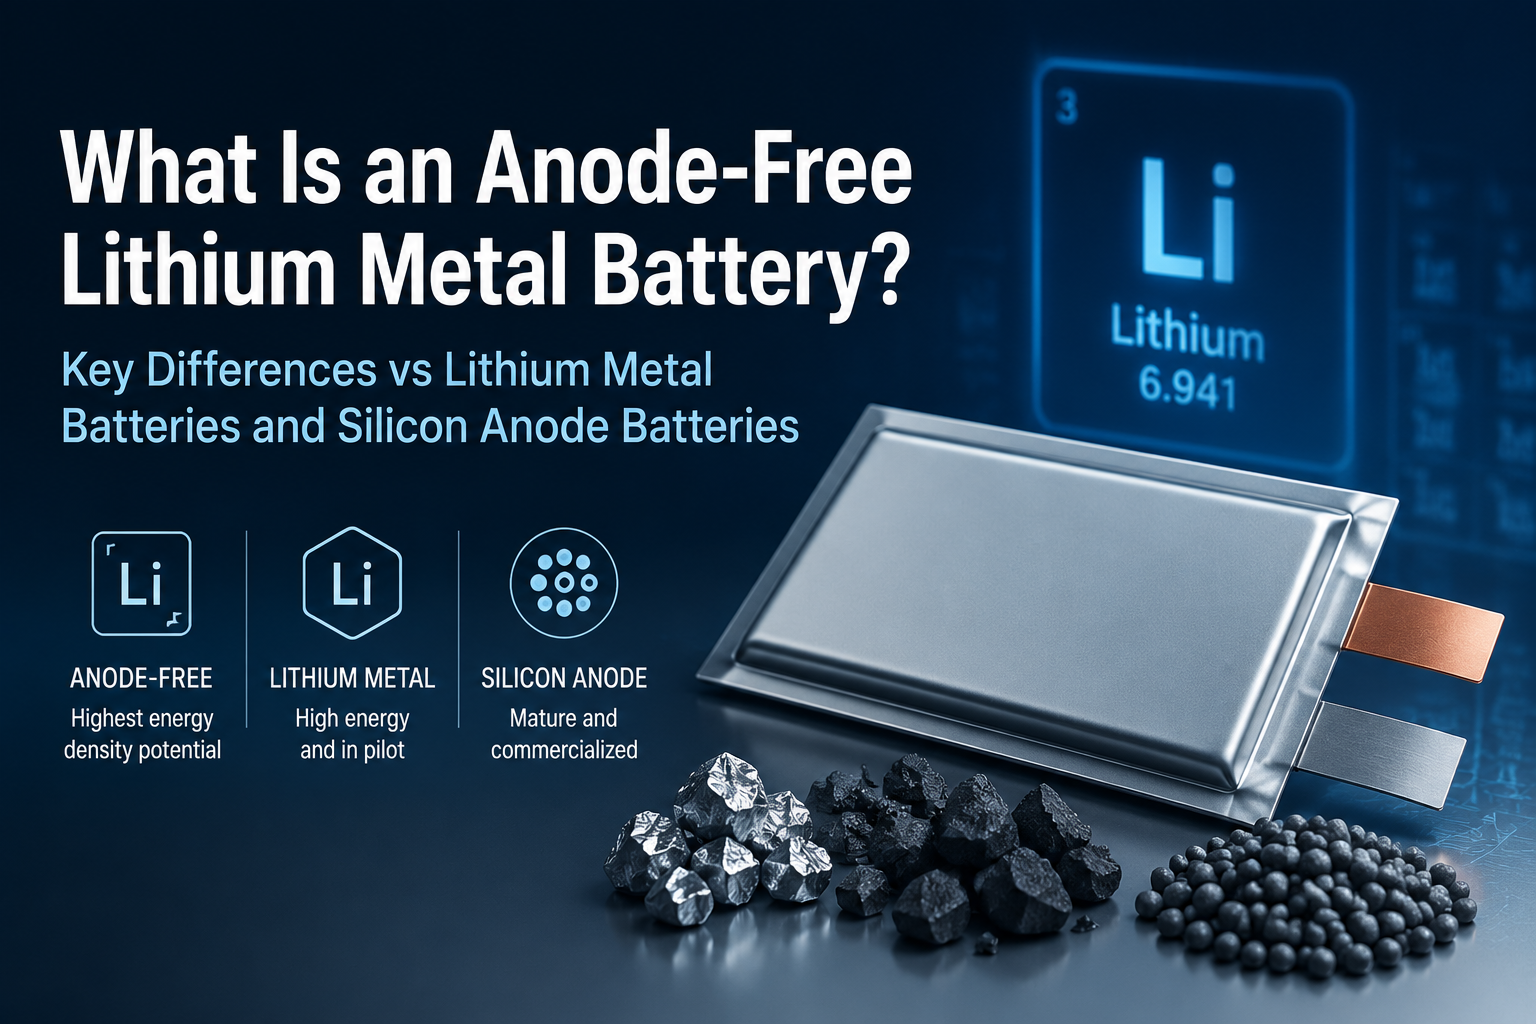
How Semi-Solid Batteries Achieve 1,200 Cycles
Semi-solid systems are often positioned as a compromise architecture: closer to liquid lithium in manufacturability than “fully solid-state,” while trying to gain stability and safety headroom.
Treat published engineering guidance as a validation layer: not “proof” on its own, but a concrete way to compare claimed cycle life, temperature windows, and pack-level constraints against what shows up in fleet duty cycles.
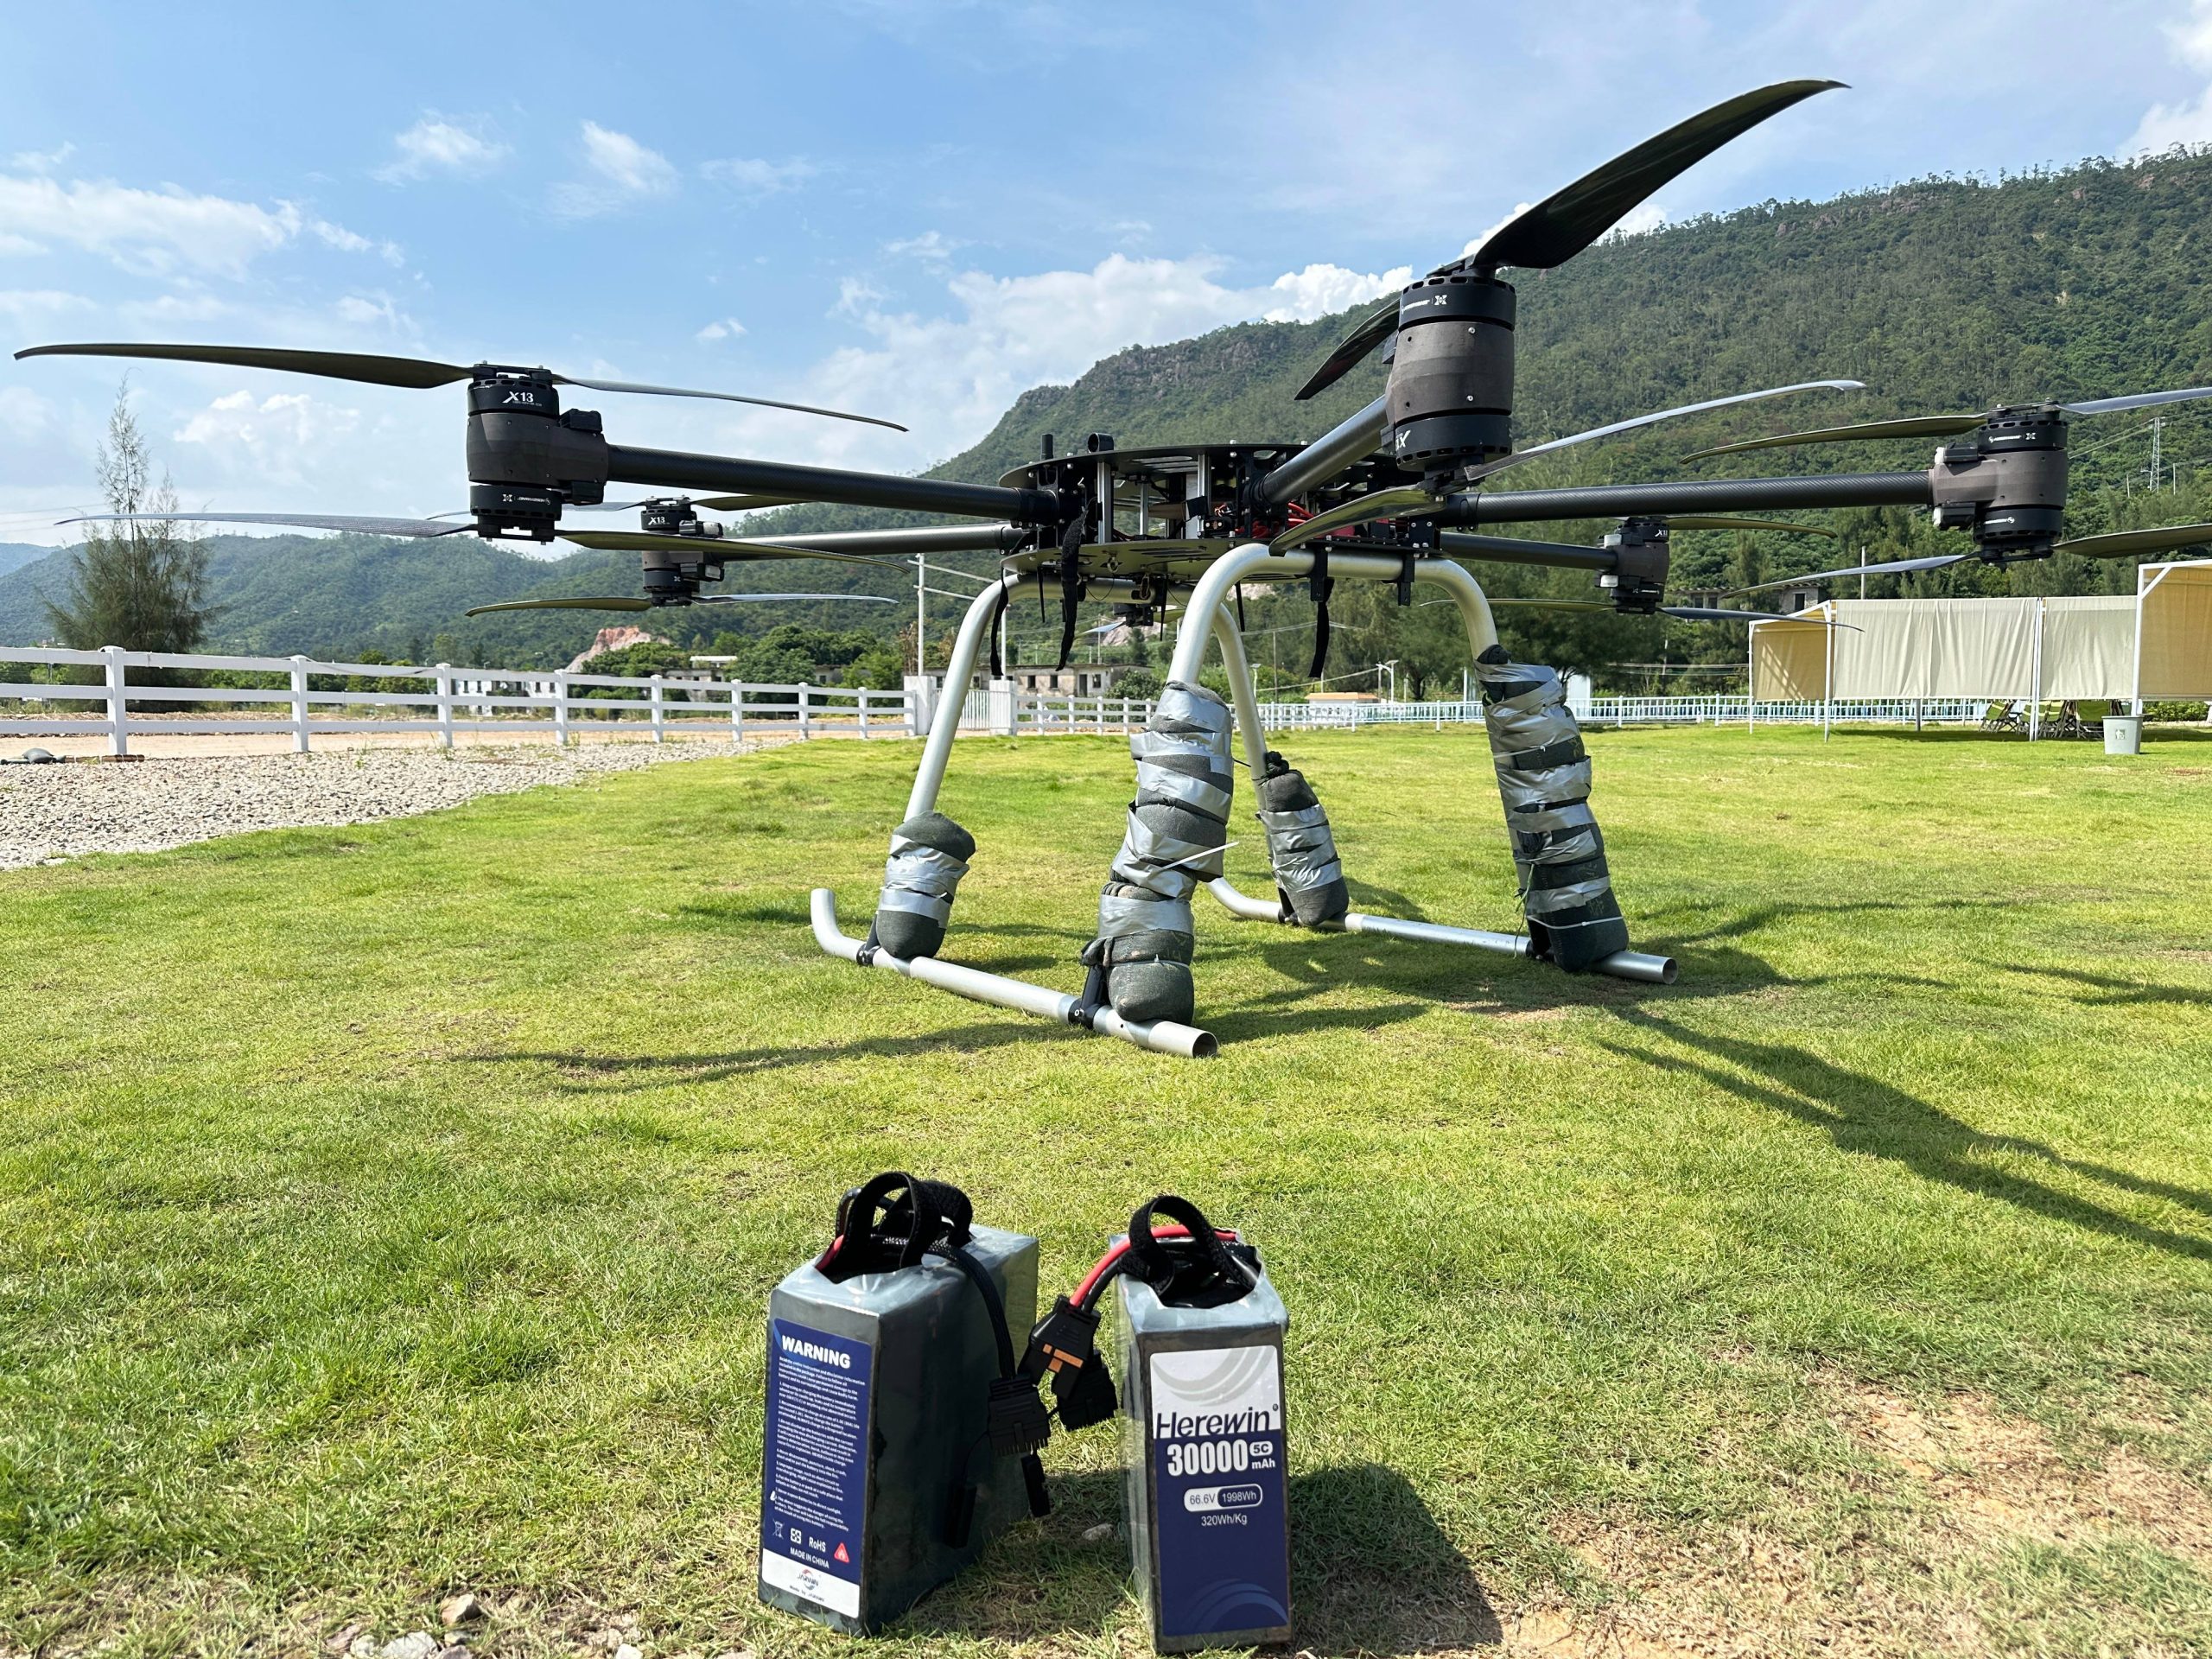
We use Herewin as an example of how semi-solid packs are framed in industrial UAV procurement, using targets and definitions from Herewin’s “Industrial Drone Lithium Battery Buyer’s Guide 2026”.
What Defines a Semi-Solid Architecture
In the referenced industrial drone battery buyer’s guide, semi-solid systems are described as a hybrid electrolyte architecture (a hybrid electrolyte with a limited liquid fraction) plus materials choices intended to improve stability and energy density.
The practical procurement takeaway is that semi-solid claims are usually tied to system-level targets, such as:
1,200 cycles as an operational benchmark (often expressed as >80% capacity retention)
higher energy density ranges (often stated at cell level)
improved thermal stability under high load
Thermal Stability Under High Load
From an operations standpoint, “thermal stability” is not a slogan. It’s a proxy for whether the pack can repeatedly handle high-current segments without creating a rising failure probability.
Semi-solid positioning typically includes:
reduced leakage risk vs fully liquid systems
improved tolerance to vibration/impact environments
a wider usable temperature window without sharp, early performance collapse
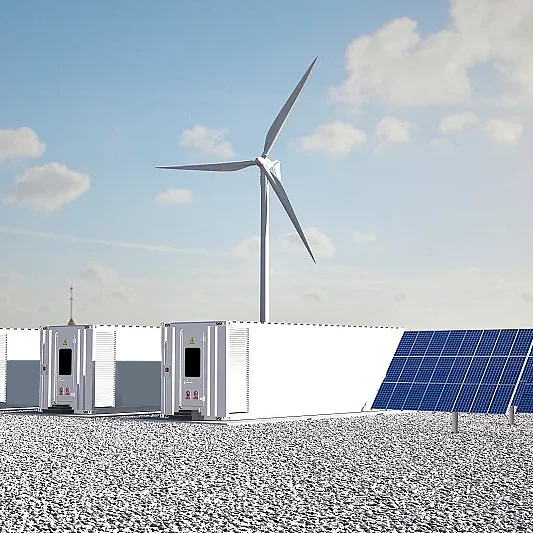
The product-category specs for semi-solid packs also emphasize thermal stability and suitability for heavy-lift, agricultural spraying, inspection, and long-duration missions.
From Sudden Drop to Predictable Degradation
The key fleet requirement isn’t “no degradation.” It’s predictable degradation.A pack that degrades gradually and consistently is easier to manage than a pack that appears fine until it suddenly can’t hold voltage under load.
In practice, this shifts battery management toward:
earlier detection of drift (cell delta, temperature anomalies)
tighter retirement thresholds based on mission envelope
fewer surprise failures that disrupt dispatch
Battery management systems can improve observability (voltage monitoring, balancing, logging). BMS guidance commonly highlights monitoring and balancing as mechanisms to preserve stable output and flag aging earlier (see Herewin’s overview of BMS role in drone battery performance).
How Energy Density Changes Mission Efficiency
Energy density is where marketing claims often get ahead of operations. For fleet planning, the difference between cell-level and pack-level energy density matters. When you see energy density Wh/kg in a spec sheet, the first question is what the vendor is counting: bare cells, module, or flight-ready pack with BMS, wiring, enclosure, and thermal protections.
From 250 to 400 Wh/kg in Practice
The referenced industrial guide frames semi-solid systems as reaching ≥300–400 Wh/kg with certain material choices (e.g., silicon-carbon anodes), while also emphasizing that real-world performance depends on pack-level engineering and verification.
Meanwhile, the semi-solid product category specs list up to 350 Wh/kg (see semi-solid state drone battery specs).
A useful way to interpret these numbers:
treat the higher range as a design ceiling (cell-level claims and best-case constructions)
treat the category spec as a more pack-adjacent reference
validate against your airframe’s mass budget, connector losses, casing needs, and thermal design
When comparing vendor claims, ask whether the Wh/kg figure is cell-level, module-level, or pack-level—and whether wiring, enclosure, BMS, and thermal elements are included.
Reducing Mission Interruptions
Higher realized energy density generally expands the mission window or keeps the same window with more payload margin.Operationally, that can map to:
fewer battery swaps per day for a given mission set
fewer charging cycles per asset-month (which affects replacement planning)
less “range anxiety” margin stacking in dispatch
The mechanism isn’t purely “more minutes.” It’s fewer forced interruptions that cascade into scheduling variability.
Reliable Performance in Cold Environments
Cold-weather performance is a recurring failure mode because it changes both power capability and available capacity.
Some vendor guides claim semi-solid packs can maintain performance across -20°C to 60°C, sometimes citing benchmarks like “80% capacity at -20°C.” Treat those numbers as verification items: confirm the test conditions, load profile, and whether the figure is cell-level or pack-level.
Even if your fleet never operates at -20°C, the practical takeaway is that a pack engineered for a wider temperature window can reduce the number of days where mission planning has to compensate for cold-start penalties.
When Semi-Solid Becomes the Better Investment
Semi-solid becomes “better” only under a usage profile where cycle life and predictability are worth paying for—especially in high-frequency operations where small reliability shifts turn into scheduling chaos.
To keep the decision auditable, anchor it to a clear cycle threshold (the point where the pack no longer meets your mission’s power/voltage envelope, even if capacity is still above 80%). That threshold is what makes cost per flight a usable procurement metric instead of a spreadsheet exercise.
Lifecycle Cost vs Purchase Price
A lifecycle view includes:
pack purchase price
replacement frequency
downtime and disruption cost
safety/compliance risk management (insurance, incident handling, procurement constraints)
logistics overhead (spares, storage, hazardous shipping)
Procurement evaluation is shifting from a price-centric model to a TCO-oriented framework, prioritizing replacement frequency, technical verification, and operational risk.
The Break-Even Point in High Usage
A simple break-even check is:
Semi-solid wins when
(Price_ss / UsableCycles_ss) + Overhead_ss < (Price_lipo / UsableCycles_lipo) + Overhead_lipo
Where:
UsableCycles is the cycle count you can actually run before your cycle threshold forces retirement.
Overhead includes downtime, handling, and fleet logistics.
In fleets where LiPo usable cycles collapse early (because voltage sag hits mission constraints before the 80% capacity threshold), the break-even point can arrive sooner than expected.
From Consumable to Operational Asset
The operational reframing is straightforward: shifting from treating LiPo packs as consumables with unpredictable “mission power” to evaluating higher-cycle semi-solid packs as strategic assets with a managed depreciation curve.
If you want the decision to be auditable, build the evaluation around measurable observables:
cycle count at retirement
voltage sag under a defined load profile
internal resistance trend (per-cell and pack-level)
temperature rise under standardized segments
cell delta and balancing burden
Next steps: a procurement-grade evaluation checklist
To build your shortlist, start with a criteria-first audit of cycle-life thresholds ($80%$ SOH), energy density (Wh/kg), and BMS logging. By mapping these benchmarks against your specific duty cycle and voltage-sag limits, you can develop a precise fleet-specific model. Request a custom cost-per-flight analysis to translate these technical inputs into a procurement-ready comparison.