


The first thing that fails in mines usually isn’t the motor or the LiDAR—it’s the battery interconnects. A week after a new pit expansion begins, blasting adds wide-band shocks. Mid‑mission, voltage jumps around, telemetry flickers, and a brownout forces an emergency landing. When we open the pack, we find tell‑tale micro‑cracks at tab welds and fretting marks near stiff connectors. That’s the real operating baseline: a triple threat of shock and vibration, conductive dust, and heavy‑load electrical stress.
This practice guide explains how to harden drone lithium batteries for mining—from internal potting and IP‑grade sealing to BMS transparency—so you can quantify and control the risks, not just react to them. Along the way, we’ll make “drone battery voltage sag” measurable and actionable.
Operating reality: the triple threat in mines
Mining and quarry sites combine three stressors that degrade packs faster than office‑park testing ever reveals. Failure here isn’t gradual wear and tear; it’s often catastrophic and unpredictable.
Shock and vibration: the fatigue factor. Blast‑induced transients and vehicle‑borne resonance accumulate mechanical fatigue in tabs, welds, and solder joints. Over time, micro‑cracks can create intermittent power loss during critical maneuvers.
Validation: Map your test plan to MIL‑STD‑810H on the U.S. DoD ASSIST database—Method 514.8 for random vibration and Method 516.8 for shock.
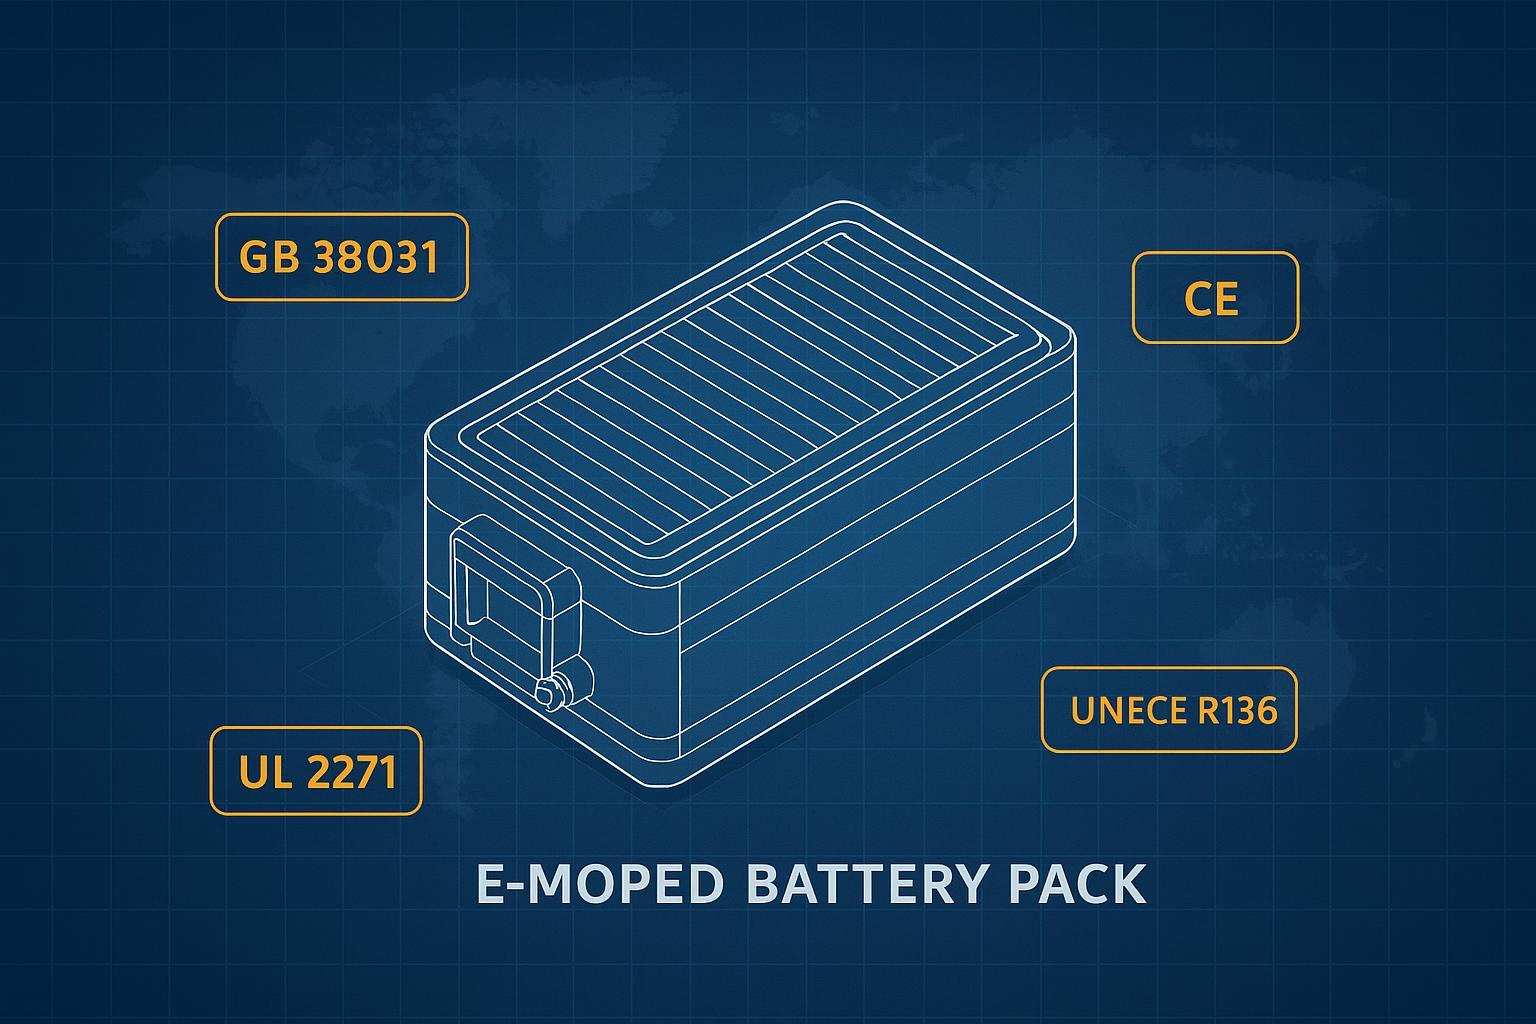
Conductive dust: the silent short. In iron or coal mines, fine conductive particles reduce creepage distance and raise leakage currents across sensitive BMS sense lines. Basic seals often degrade, and dust finds a way in.
Validation: IP6X (dust‑tight) sealing as defined in IEC 60529 on the IEC Webstore. For high‑risk sites, also apply insulation‑coordination concepts from IEC 60664‑1 for pollution‑degree selection and creepage/clearance margins.
Heavy‑load electrical stress: the sag trigger. LiDAR scans, gust recovery, or heavy‑lift takeoffs drive high C‑rate bursts. The result is drone battery voltage sag—an instantaneous drop driven by internal resistance and polarization. At the wrong temperature or state of charge, sag can cross flight‑controller thresholds and trigger a forced emergency descent.
Engineering controls that actually work in mines
To mitigate the catastrophic risks of the ‘Triple Threat,’ standard assembly methods are insufficient. Reliable operation in mines requires engineering controls that prioritize energy dissipation, absolute sealing, and chemical stability.
Mechanical integrity and verification
Think of the pack as a small structure riding on a shaker. To survive, it needs energy dissipation and strain redistribution.
Encapsulation: Use compliant gap fillers and cushioning to reduce fretting and spread strain across tabs and welds under 10–500 Hz vibration. Avoid voids, which can become initiation points for crack growth.
Interconnects: Favor laser‑welded tabs with mechanical backing, laminated busbars to spread strain, and well‑supported high‑current connectors. Add strain relief at harness exits so the BMS board doesn’t carry cable loads.
Isolation mounts: Tune pack‑to‑airframe mounts away from the platform’s dominant spectral peaks to avoid resonance stacking.
Verification: Tailor MIL‑STD‑810H Method 514.8 random vibration profiles (axes, gRMS, duration) to mine‑vehicle or rotorcraft categories; follow with Method 516.8 shocks (pulse shape, peak g, duration). Record shock response spectra and perform functional checks pre/post exposure. For the official procedures and tailoring language, use MIL‑STD‑810H on the U.S. DoD ASSIST database.
Dust‑tight sealing and thermal conduction
Sealing the enclosure is necessary—but sealing traps heat. The solution is a dust‑tight body with deliberate thermal conduction paths.
IP6X (dust‑tight) sealing to block conductive particulates (see IEC 60529 on the IEC Webstore for IP definitions). Use gasketed lids, potted feedthroughs, and sealed cable glands. For board‑level protection, apply conformal coatings qualified per IPC‑CC‑830 to raise surface resistance.
Move heat by conduction, not airflow: Build a conductive thermal path from cell groups to the enclosure using high‑k interface materials and well‑bonded contact surfaces. Validate with discharge runs in a thermal chamber at 50°C ambient and track cell‑to‑case ∆T versus current.
Materials: Choose high‑CTI polymers (insulation coordination per IEC 60664‑1 on the IEC Webstore) to resist tracking in dusty humidity; specify flammability ratings at the material level to reduce incidental ignition risk.
Chemistry for stability and low resistance
Low internal resistance is the single best hedge against sag. Semi‑solid approaches are being piloted to combine higher energy density with safety and reduced IR. Treat public claims conservatively: require third‑party lab data for energy density, IR across SOC/temperature, and cycle life in your duty profile before making a fleet‑wide switch.
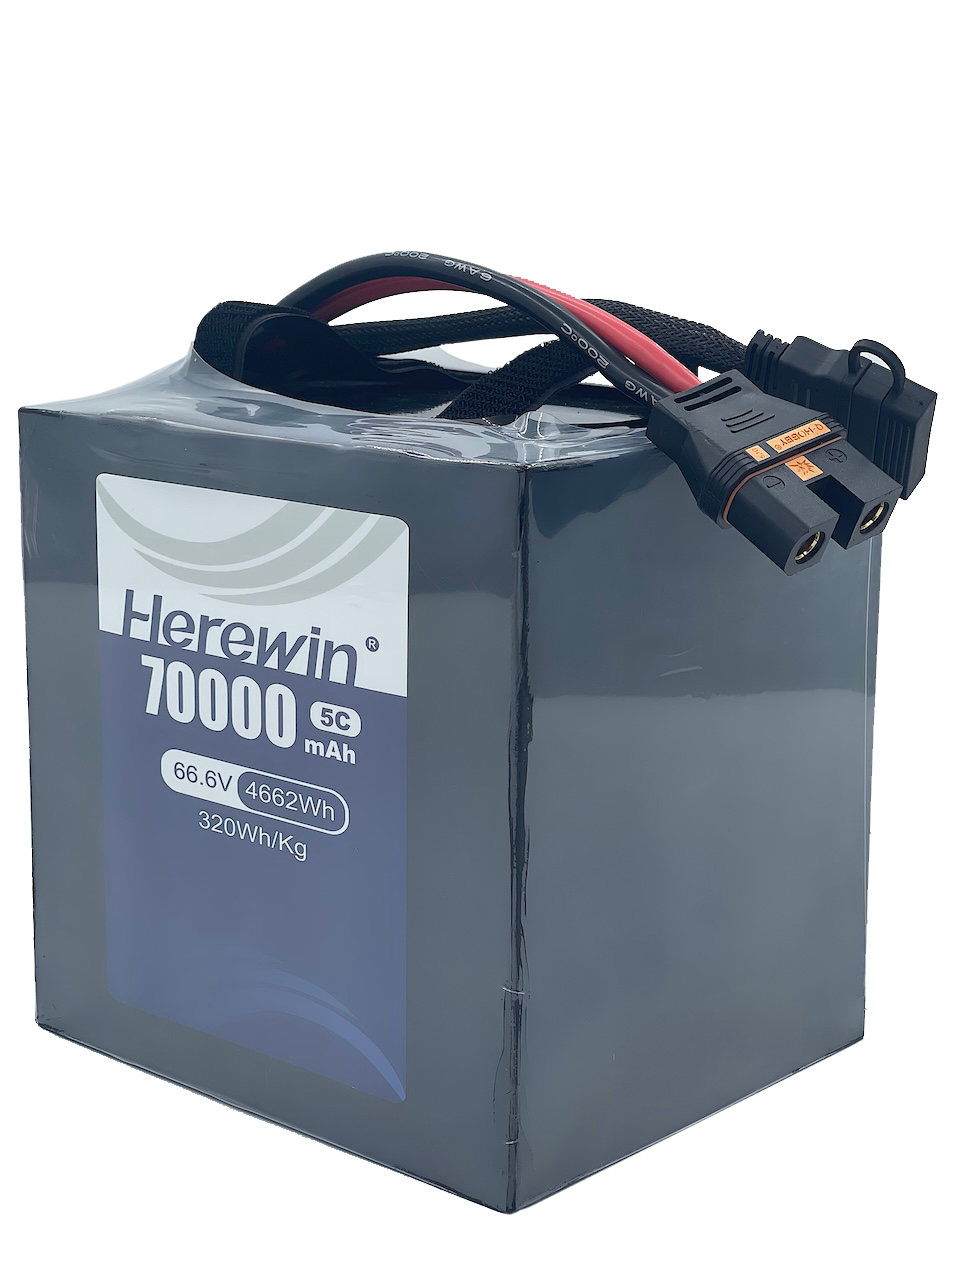
If you stay with conventional chemistries, consider higher‑power cell grades or additional parallel strings to reduce per‑cell current at peak loads. For background on cell and pack approaches used in high‑power UAV applications, see Herewin’s Semi‑Solid State Battery resources.
Make drone battery voltage sag measurable
If you can’t measure sag reliably, you can’t manage cutoffs. In the field, “Voltage Sag” is often treated as a mystery, but it follows a predictable engineering model.
1. The Working Model
Instead of guessing, use this first-order calculation to understand why your drones are forced into emergency landings:
Total Sag (ΔV) ≈ [Current (I) × Internal Resistance (R)] + Polarization Effects
Delta V (ΔV): The instantaneous voltage drop you see in your ground station telemetry.
Current (I): Instantaneous load (e.g., heavy-lift takeoff, LiDAR bursts, or gust recovery).
Internal Resistance (R): A variable driven by the battery’s chemistry, State of Charge (SoC), and ambient temperature. Minimizing this resistance is the primary defense against excessive voltage drops in heavy-lift missions.
Polarization: The electrochemical “lag” that occurs during and after a high-current pulse.
2. What to Request from Vendors
To quantify these risks, do not rely on “nominal” data sheets. Ask for these auditable artifacts:
HPPC Curves: Hybrid Pulse Power Characterization to show discharge capability at various SoC levels.
EIS Plots: Electrochemical Impedance Spectroscopy to analyze internal health across frequencies.
Dynamic Logs: Discharge data showing 10–30 C pulses with precise recovery times, plus the exact cutoff logic applied by the BMS and flight controller.
3. A Practical Target for Mine Sites
In a standard 12S pack at mission-level SoC, even a 20 C burst should retain a safe margin above the flight controller’s low-voltage threshold under worst-case ambient temperatures.
By treating “Voltage Sag” as an explicit, measurable test artifact—rather than an unpredictable variable—operational leads can convert sudden “brownout” risks into tunable parameters. This systematic approach ensures that flight limits are based on electrochemical reality rather than conservative guesswork.
Expert Tip: If a vendor cannot provide an EIS plot (Electrochemical Impedance Spectroscopy) across temperature ranges, it indicates they are likely not auditing internal structural integrity. In high-vibration mining zones, this lack of data is a major red flag for potential interconnect fatigue.
BMS data transparency and safety logic
In a remote mine, a battery failure without data is a liability; it leaves your team guessing whether the issue was a cell defect, a charging error, or a heavy-lift thermal event. A mine-ready BMS (Battery Management System) must function like a flight data recorder, providing the transparency needed to predict failures before they force a landing.
The Need for Per-Cell Visibility
Standard battery packs often only report aggregate voltage, which masks the “weak link” in your fleet. For high-stakes mining missions, telemetry should prioritize:
Cell-Level Granularity: Real-time voltage and temperature for every individual cell. This allows engineers to spot internal resistance (IR) growth in a single cell before it triggers a pack-wide shutdown.
Health Metrics (SoH): Continuous tracking of ESR (Equivalent Series Resistance). In mining, an abrupt rise in ESR is the earliest warning sign of mechanical fatigue in internal interconnects or welding joints.
Root Cause Diagnostics: Instead of a generic “error,” the system should log specific trip flags like
uv_sag(under-voltage during heavy load) to distinguish between a depleted battery and an electrical stress event.
Integration-Ready Telemetry
Data is only useful if your ground station can interpret it instantly. To ensure rapid integration, a standardized CAN 2.0B interface supported by a comprehensive DBC file is essential. This allows fleet managers to map battery data directly into their existing telemetry software without custom coding.
Instead of complex code, think of the output as a real-time health feed. A decoded frame from an industrial-grade pack during a mission might look like this:
System Status:
[Pack: 50.0A Load] | [Avg Cell: 3.19V] | [Max Temp: 44.6°C]State of Charge:
50%(Filtered for accuracy under load)
By bridging this data to a JSON format, operators can create a “Digital Twin” of every battery in the fleet, tracking performance trends and degradation across weeks of blasting and hauling.
Safety Logic: Redefining “Protection” in Dust-Heavy Zones
While material certifications like UL 94 V-0 ensure the plastic casing is self-extinguishing, mining environments require a more proactive safety logic:
Conductive Dust Mitigation: Fine coal or iron dust can create “leakage paths” on a BMS board. A mine-hardened BMS must use conformal coatings (qualified to IPC-CC-830) to maintain high insulation resistance even in polluted humidity.
Active Isolation Tuning: The BMS logic must be tuned to recognize “blasting transients”—short, sharp shocks—and distinguish them from actual short circuits. This prevents nuisance trips while maintaining millisecond-level cutoff speed for genuine thermal runaway events.
Field validation and procurement checklist
Use this combined checklist to turn marketing claims into auditable evidence. Ask suppliers for named reports with dates, sample sizes, and acceptance criteria.
Mechanical shock and vibration: Accredited‑lab report for MIL‑STD‑810H Method 514.8 random vibration and Method 516.8 shock, with profiles, gRMS, pulse shapes, peak g, durations, axes, and shock response spectra. Verify pre/post functional checks. Use the U.S. DoD ASSIST QuickSearch listing for MIL‑STD‑810H as the canonical reference.
Ingress and thermal: IEC 60529 IP test report covering IP6X dust chamber and IPX7 immersion. Thermal‑chamber discharge curves at 50°C ambient showing cell ∆T and pack surface temperatures at rated current. Use the IEC 60529 publication page on the IEC Webstore for the IP code definitions.
Electrical under load: HPPC/EIS datasets for your proposed cells; dynamic 10–30 C discharge logs with minimum voltage per cell and recovery; BMS and flight‑controller cutoff logic.
Safety and compliance: UN 38.3 test summary for the exact model/configuration (air transport) and IATA shipment conditions. Use the UNECE UN Manual of Tests and Criteria (Rev. 8) files and IATA’s Lithium Battery Guidance Document (PDF).
Telemetry and integration: CAN 2.0B signal dictionary, DBC file, sample frames, API docs; list of fault flags and isolation logic, including millisecond‑level cutoff behavior under abnormal events.
Lifecycle and ROI: Cycle‑life data in a mining‑like duty cycle and a TCO worksheet that breaks out Cost‑per‑Flight versus a standard commercial pack.
Operations playbook for uptime and TCO
Pre‑flight and maintenance checks for mining missions
Inspect enclosure seals and cable glands for dust packing; wipe interfaces and verify no visible cracks.
Query BMS logs for last‑trip cause, fault flags, and ESR trend; do not fly if ESR rose abnormally since the prior mission.
Confirm per‑cell delta‑V within your policy limit before arming; large spreads amplify sag under load.
Warm or cool packs to the mission window so IR is minimized; log ambient and pack temperatures.
Run a 10–15 s hover or thrust ramp to sample sag and recovery with the actual payload; abort if minimum voltage approaches the threshold.
After landing, re‑log sag and temperatures; schedule packs with rising ESR for diagnostic cycling.
Here’s a compact way to make “cost per flight” auditable across vendors.
Field | What it means | How to define it (so it’s comparable) |
|---|---|---|
Pack Cost | Total cost of one battery pack | Quote for the exact model + connector + BMS option |
Useful Cycles | Cycles until end‑of‑life | Cycles to 80% SoH under your duty profile (temperature + C‑rate) |
Charging Cost per Flight | Electricity per mission | Energy price × Wh replenished ÷ charger efficiency |
Operational Downtime Cost | Cost of battery‑caused interruptions | Labor + delayed survey/inspection cost attributable to premature voltage sag or physical fatigue events. |
Flights | Number of missions in the period | Same time window for all comparisons |
Cost per Flight = (Pack Cost / Useful Cycles) + Charging Cost per Flight + (Downtime Cost / Total Flights)
Field Performance: Semi-Solid vs. Conventional Packs
To see how these engineering controls—and the resulting TCO gains—perform in a real-world environment, we compared a reinforced Semi-Solid 12S pack (featuring matrix potting and laser-welded interconnects) against a standard high-power LiPo pack during a heavy-lift LiDAR mapping mission.
Test Environment: 55% SoC | 34°C Ambient | 18–22 C Dynamic Bursts.
The Results
Superior Voltage Retention: The semi-solid pack demonstrated a significantly lower internal resistance (IR) estimate. During high-current pulses, it maintained a smaller minimum-voltage dip, effectively widening the safety margin to the flight controller’s cutoff threshold.
Thermal Efficiency: Post-flight BMS logs indicated a much tighter thermal spread across all cells. This confirms that the internal conductive paths effectively moved heat away from the core to the shell, preventing localized hot spots even under sustained load.
While these results are promising, procurement leads should not rely on flight logs alone. Always request third-party HPPC/EIS testing, alongside accredited MIL-STD-810H (Method 516.8 Shock) and IEC 60529 (IP67) reports to verify these performance gains are repeatable in your specific pit environment.
Next steps and resources
To evaluate rugged power systems for your site, move beyond datasheets. Ask suppliers for dated, sample‑scoped test reports, then run a short on‑site drone battery voltage sag check with your actual payload to confirm cutoff margin at working SOC and temperature.
Standards and guidance
MIL‑STD‑810H on the U.S. DoD ASSIST database (Methods 514.8 and 516.8)
IEC 60529 on the IEC Webstore (IP code definitions, including IP6X)
UN Manual of Tests and Criteria (Rev. 8) files on UNECE (UN 38.3) and IATA Lithium Battery Guidance Document (PDF)
Internal reading
Semi‑Solid State Batteries for Drones — concept overview and UAV context
Industrial Drone Battery Buyer’s Guide 2026 — selection factors and ROI framing
If you need the underlying test artifacts referenced in this guide, contact Herewin’s technical team to confirm availability for your exact pack configuration and evaluation scope.