










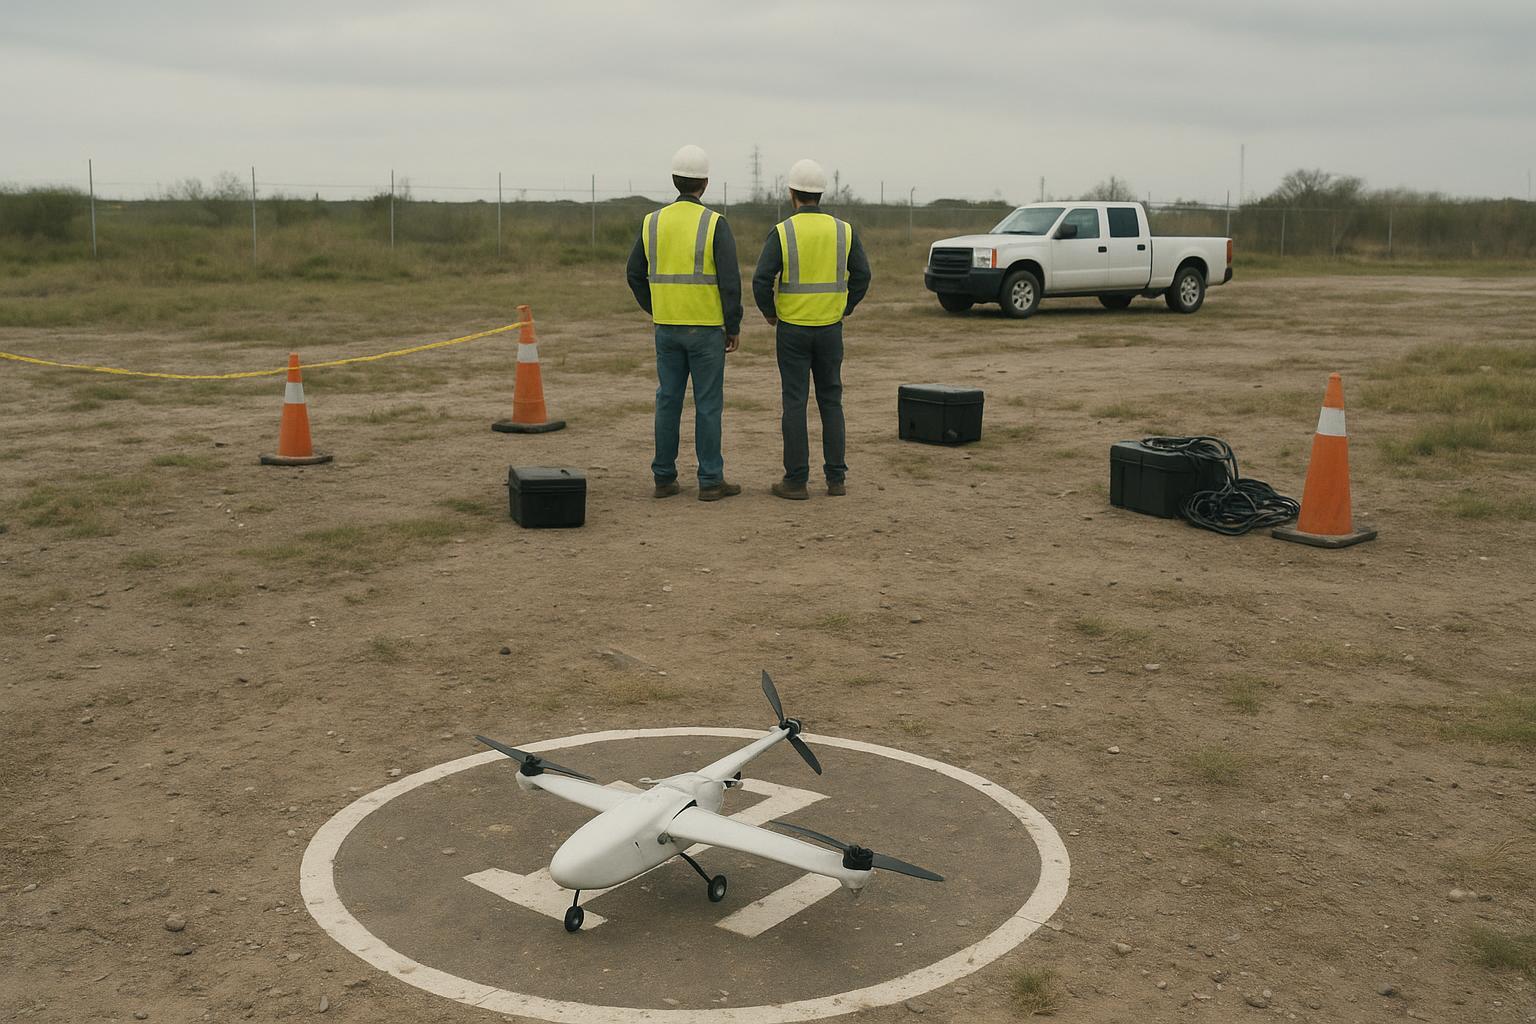
Industrial VTOL UAV teams used to treat the battery like a late-stage optimization: pick a voltage, chase the highest Wh/kg you can buy, then negotiate price and lead time.
That workflow is breaking.
As VTOL missions become more complex (longer range, heavier payloads, tighter weather and thermal envelopes, BVLOS operations, higher sortie cadence), VTOL drone battery selection is no longer a procurement decision made after the airframe is “done.” It’s a mission-design decision that directly governs:
whether the aircraft can deliver required thrust margin in peak segments
how much payload you can actually lift without triggering voltage sag or thermal derating
how much reserve you can carry without sacrificing mission range
how predictable your endurance is across temperature, aging, and batch variance
A successful VTOL battery is not the one with the highest energy density, but the one that reliably completes the intended mission.
Below is a practical, engineer-facing framework for turning a mission profile into battery requirements and a validation plan.
Why traditional VTOL battery selection methods are no longer enough
Most “battery selection” conversations still revolve around three numbers:
Voltage (S-count / platform voltage)
Capacity (Ah / Wh)
Weight (kg)
These are necessary—but they are not sufficient to answer the real requirement: Can the aircraft complete the mission safely and repeatedly, with margin?
The gap exists because VTOL power demand is not steady-state.
VTOL missions have distinct energy and power phases:
vertical takeoff and climb
transition (often the least forgiving segment for control stability)
cruise
approach, landing, and go-around / abort margin
A battery that “wins” on capacity and weight can still fail the mission if:
voltage falls outside the ESC/flight-control window during a peak segment
internal resistance turns peak power into heat instead of thrust
the BMS limits current or triggers protection in the exact segment you need authority
This is why voltage stability beats capacity in real VTOL operations.
VTOL mission profile battery requirements across flight phases
Mission-profile-driven design starts with one discipline: separate energy requirements from power requirements—and assign them to the segments that actually demand them.
Vertical takeoff demands peak power, not “more mAh”
Vertical takeoff is a power event. High current draw drives voltage sag, which reduces available power unless current rises further (P = V × I). That extra current also increases heat (I²R) and can force derating.
A pack can have enough total energy for a 60-minute mission and still be unable to deliver the peak power needed for takeoff without deep sag.
In VTOL, “energy capacity” and “power capability” are different constraints. You can pass one and fail the other.
Transition is where voltage sag becomes a control problem
Transition is a unique VTOL segment: you’re changing propulsion modes while the aircraft is least tolerant of surprises.
Practical evidence from flight-control documentation supports what many OEM teams see in testing.
ArduPilot’s Plane documentation notes that QuadPlane transitions can cause excessive battery voltage sag when forward motors see full-throttle demand, especially with lower C-rated packs. It also documents mitigations via limiting battery power draw (e.g., BATT_WATT_MAX) and controlling throttle slew-rate to avoid rapid current steps (see ArduPilot’s guidance on limiting maximum battery power draw).
You don’t need to run ArduPilot to learn the engineering lesson:
transition is transient-heavy
transients amplify sag and expose weak power paths
battery selection and power-path design must be validated with transition-like load steps
Cruise and return require energy efficiency plus a defensible reserve
Cruise is where energy density matters most—but even here, usable energy is constrained by voltage under load and thermal state.
Key engineering point:
Your mission isn’t “max possible endurance in ideal conditions.”
Your mission is “time-on-task with reserve at the actual ambient temperature, with a pack that has aged, and with production variance.”
Reserve is not only “extra Wh.” In VTOL, reserve is power + energy + temperature margin, because the final segment occurs at lower SOC where sag risk increases.
Key battery factors that determine VTOL mission performance
Energy density shapes range and payload
Energy density helps you buy either:
more range for the same MTOW
more payload for the same range
But it won’t save you if peak segments push the battery into sag or thermal limits.
For OEM design reviews, treat energy density as one variable in a constraint set:
range target (Wh required)
payload requirement (kg)
peak segment power (W)
thermal envelope (start temp, peak temp, cooldown requirement)
reserve requirement (diversion/go-around margin)
Internal resistance (DCIR) is the real power spec
Voltage sag isn’t mysterious. In VTOL, it’s usually the difference between a clean transition and a low-voltage event.
A practical way to specify the requirement is: Voltage drop ≈ Current × Total Resistance
Where total resistance includes both:
cell DCIR
the rest of the power path (busbars, connectors, harness, protection components)
So the question isn’t “what’s the capacity?” It’s: At your peak current, how low will voltage dip—and for how long?
Why this matters for mission success:
Higher resistance → deeper sag at the same current
Deeper sag → less thrust margin, earlier cutoff, or control instability
Higher resistance → more heat (I²R), which accelerates aging and can force derating on later sorties
For supplier discussions, DCIR is most useful when it’s measured the same way every time and paired with a dynamic sag/recovery curve (step load → minimum voltage → recovery). For a deeper dive on what to log and how to compare packs, see Herewin’s voltage sag under load reference.
In VTOL programs, DCIR isn’t a lab number—it’s a mission reliability parameter you can test, log, and write into acceptance criteria.
Thermal behavior is a lifecycle limiter, not an afterthought
Peak segments create heat. Repeated sorties accumulate heat. If you only validate one flight, you will miss the real constraint: multi-sortie reliability.
In practice, treat heat as a repeatability test: log start temperature, peak temperature in the highest-load segment, and sag at a defined SOC window.
Warning: “Works on a cool morning” is not a qualification. VTOL packs must be validated in the thermal conditions your mission will actually see.
Smart BMS is how you turn performance into predictability
In VTOL OEM programs, the BMS is not just a safety add-on. It’s how you make the system testable and repeatable.
For mission reliability, the BMS should support:
SOC accuracy under dynamic loads (not just smooth discharge)
per-cell voltage visibility (to detect divergence under load)
temperature monitoring (pack-level and appropriate internal sensing)
transparent protection behavior (what triggers derating vs cutoff)
log exportability (so you can prove behavior in validation and field operations)
When something derates or trips, you want a reason code you can act on—not a mystery event.
A mini mission profile example with assumptions and formulas
This is intentionally simplified. The goal is to show the sizing logic without turning the article into a calculation walkthrough.
Example assumptions
Mission: VTOL takeoff → transition → cruise → return → landing
Segment power (illustrative):
Takeoff + climb: 8 kW for 60 s
Transition: 6 kW for 30 s
Cruise: 2 kW for 40 min
Landing/approach: 5 kW for 90 s
Platform nominal voltage: 60 V
Total resistance (cell + interconnect + harness): 25 mΩ (0.025 Ω)
What the numbers tell you
Peak current (power constraint)
Takeoff current: I ≈ P/V ≈ 8000/60 ≈ 133 A
Voltage sag (control + cutoff constraint)
Takeoff sag: V_sag ≈ I×R ≈ 133×0.025 ≈ 3.3 V
Energy (endurance constraint)
Cruise energy: E ≈ P×t ≈ 2000×(40/60) ≈ 1333 Wh
Cruise dominates energy; takeoff/transition dominate power and sag. That’s the key design takeaway: you size VTOL packs to satisfy both constraints, then validate the worst segment at low SOC and real temperature, not at a comfortable mid-pack condition.
What to specify and validate so mission success is predictable
Treat this as a buyer’s guide for an engineering spec, not a product wishlist.
1) Specify the mission profile, not just the pack
Minimum spec inputs to share with a supplier:
worst-case payload and MTOW
segment power/time assumptions (takeoff, transition, cruise, landing)
ambient temperature envelope
required reserve definition (energy + power margin)
allowable voltage window under load (ESC/FC constraints)
sortie cadence (single flight vs repeated flights with turnaround charging)
2) Make voltage sag a contractual performance metric
A mature spec doesn’t say “25C pack.” It says:
minimum voltage under defined load at defined SOC and temperature
sag + recovery behavior (dynamic signature)
max cell-to-cell spread under load
3) Validate thermal behavior across sorties
In many industrial programs, the pack that fails is not the pack that is “too small.”
It’s the pack that starts the second or third sortie warm, sags deeper during peak segments, and derates earlier—turning endurance into a probabilistic guess.
4) Use acceptance testing to control production variance
Your prototype can pass while production fails—because variance is the enemy of predictability.
Acceptance testing should include more than capacity.
Acceptance testing should align:
resistance/impedance
dynamic sag/recovery fingerprints
self-discharge and drift
In other words: you’re qualifying a distribution, not a single golden sample.
A TCO table VTOL OEM teams can actually use
If you’re building a decision model, treat this as a checklist of inputs rather than a promise of savings.
Cost driver | What to measure | Why mission profile changes it | How to model it |
|---|---|---|---|
Pack inventory requirement | packs per aircraft / per day | Turnaround time (cooldown + charge limits) is set by peak segments and thermal rise | packs_needed ≈ daily_sorties × (turnaround_minutes / available_minutes) |
Battery-related mission aborts | % of sorties | Sag/derating risk concentrates in takeoff/transition/late-flight segments | abort_cost ≈ abort_rate × value_per_sortie |
Validation & test burden | test hours + fixtures | Dynamic mission-profile testing replaces simplistic bench checks | validation_cost ≈ engineer_hours × loaded_cost + fixture_cost |
Warranty/returns exposure | $ or % | Variance + weak traceability increase exposure at scale | warranty_cost ≈ return_rate × replacement_cost |
OPEX from thermal limits | minutes lost per sortie | Heat accumulation reduces sortie cadence and increases labor idle time | opex_cost ≈ minutes_lost × labor_cost_per_min |
Why VTOL manufacturers need battery partners earlier in development
When battery behavior is mission-critical, battery design affects more than the pack:
weight allocation and CG
harness routing and connector selection (resistance and heat)
thermal containment and airflow paths
ESC voltage window and control stability
BMS telemetry integration and logging requirements
qualification plan (including acceptance testing and traceability)
That is why earlier collaboration matters: it prevents the late-stage failure mode where the aircraft meets the CAD weight target but fails mission reliability in the field.
If your program needs a reference point, industrial UAV battery platforms typically require customization across cells, pack design, and BMS integration. Herewin’s industrial drone battery solutions page shows the typical scope of that system-level work.
The “best” VTOL drone battery is the one that finishes the mission
As VTOL missions scale in complexity, battery selection becomes a systems decision:
mission profile → power/energy/thermal/BMS requirements
requirements → validation plan and acceptance testing
validation → predictable mission completion with reserve
The key evaluation criterion should shift from headline specifications to mission-level reliability: define the mission profile, test sag/thermal behavior in the worst segments, and lock those behaviors into validation and acceptance criteria. Then verify you can reproduce the same results across temperature, state of charge, and representative production variance.

 Español
  English
  한국어
한국어  Deutsch
  Français
  日本語
日本語  Русский
  Bahasa Indonesia
  ไทย
ไทย  العربية
  Português do Brasil
  Italiano
  Nederlands