


If your delivery drones spend more time tethered to chargers than in the air, the primary constraint is not energy density, but turnaround efficiency. In high-frequency last-mile delivery networks, excessive charging dwell time directly impacts fleet scalability and asset utilization.
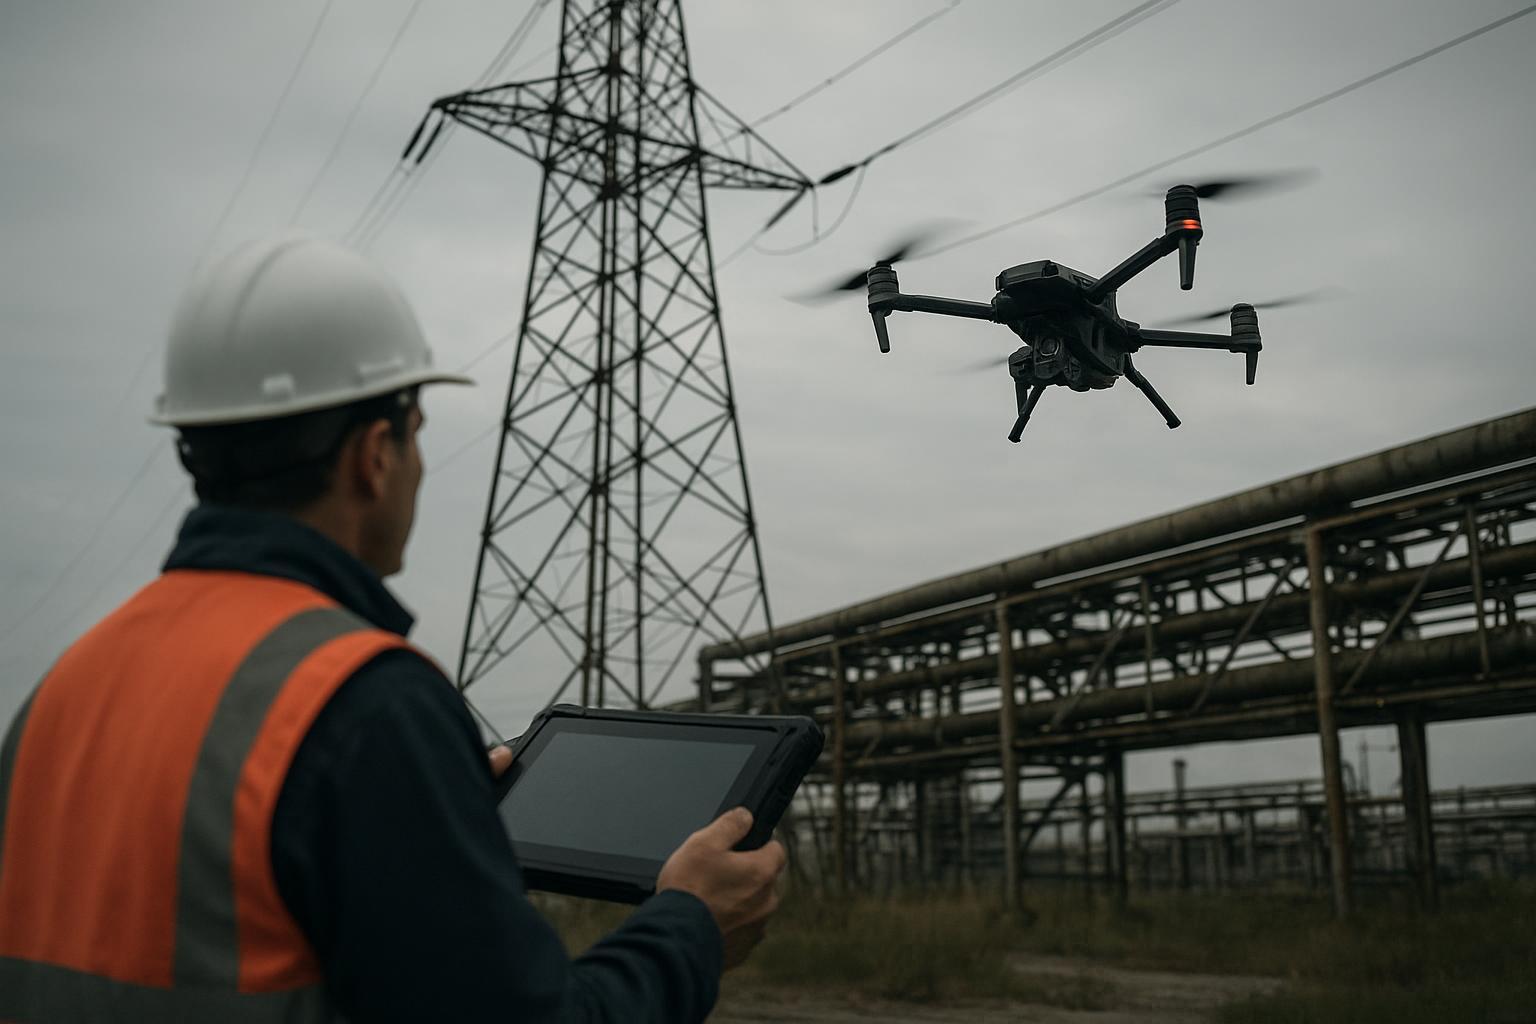
This article focuses on high-cadence logistics operations, where drones may perform dozens of sorties per day and ground turnaround becomes the dominant operational bottleneck. In lower-duty missions—such as inspection or surveillance—conventional fast charging may remain a practical and cost-effective option.
Within this operational scope, we distill field-proven engineering practices for drone battery systems, focusing on two technical pillars: high-durability quick-swap hardware and cloud-integrated BMS telemetry that ensures the SOC/SOH precision required for automated scheduling. We analyze these strategies through a data-driven ROI model and an urban “lunch-rush” operational vignette.
Why turnaround time dominates fleet economics
In last-mile delivery, capacity is rarely the binding constraint. Turnaround time is. If a pack has enough energy to finish the route but takes 30 minutes to recover at the pad, your fleet turns into a queueing problem.
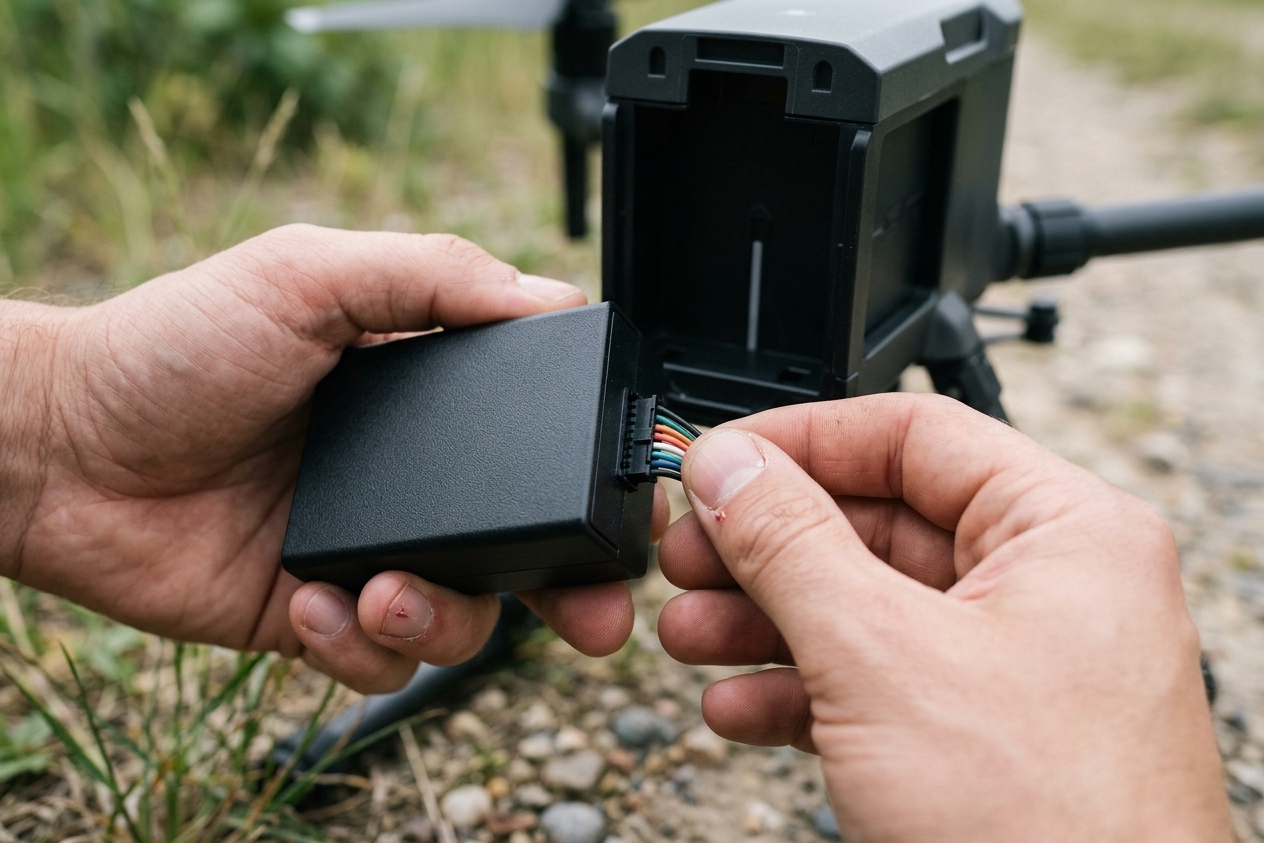
Charging creates a fixed dwell time that compounds across sorties and forces you to over-provision airframes. Quick-swap replaces that dwell with a 30–120 second exchange, so aircraft return to service immediately while depleted packs recharge off-vehicle on more battery-friendly protocols.
In high-cadence routes, swapping replaces tens of minutes of charging dwell with about a minute of ground time—often doubling practical sortie throughput from the same airframe.
Once you treat batteries as operational assets rather than consumables, the optimization target shifts: you’re not just minimizing $/pack, you’re minimizing total cost per delivery while maximizing sorties per day per airframe. That’s why quick-swap architecture and SOC confidence often outperform marginal energy-density gains in high-cadence networks.
However, high cadence also means the swap interface can see thousands of mating cycles per month—so connector durability and mechanical alignment precision become first-order uptime constraints.
Hot-swap support isn’t a single feature—it’s an ecosystem choice. Most delivery deployments fall into three architecture patterns: integrated enterprise ecosystems (closed-loop aircraft/battery/charger/software), open industrial platforms that standardize interfaces across airframes, and automated swap stations for unattended hubs.
Across all three, the reliable approach is to treat the connector and data interface as a matched pair—so “ready to fly” is a measurable state, not a guess.
High-Durability Interconnects: Engineering for Quick-Swap Reliability
High-frequency swapping lives or dies on the interconnect. The two common approaches are spring-loaded contacts (pogo pins) and rugged blind-mate power connectors with alignment funnels. For fleet uptime, move past static datasheet ratings and qualify what happens after thousands of real insertions.
What to validate before you scale
Anchor validation to the failure modes that actually take swap hubs down:
-
Contact resistance drift across cycles (cycle testing per the EIA‑364 / IEC 60512 families).
-
Temperature rise vs. current at your takeoff/hover loads.
-
Ingress and contamination tolerance for dust, rain, and pad grime.
-
Vibration discontinuity (no intermittent opens under your vibration profile).
Design requirements for last-mile operations:
-
Plating + geometry: specify gold-over-nickel plating appropriate for peak current density, and use blind-mate geometries that tolerate small lateral/angle errors without scuffing.
-
Maintenance you can measure: track milliohm (mΩ) drift and thermal rise vs. cycle count so cleaning/replacement is triggered by data, not surprises.
-
Core targets: ≥5,000–10,000 mating cycles, ≤30°C temperature rise at worst-case continuous current, and compliant mounts that absorb misalignment loads.
Standard EIA/IEC tests are a baseline. Treat any connector choice—including anti-spark blind-mate options—as something you qualify under your insertion rate, contamination, and current pulses, with explicit acceptance limits for resistance drift and thermal rise.
What is a drone BMS and why does it matter?
A drone BMS is the battery’s “truth layer.” It measures cell voltages, current, and temperature; enforces protection limits; and turns raw signals into operational decisions (SOC, SOH, fault states). In delivery fleets, that translation matters because dispatchers don’t fly batteries—they fly risk budgets.
Three fleet rules enabled by BMS
A delivery-grade BMS turns battery health into dispatchable decisions. At the fleet level, it’s most useful when it enables three enforceable rules—each grounded in SOC/SOH confidence and a clear vehicle-to-cloud data contract.
Launch gate
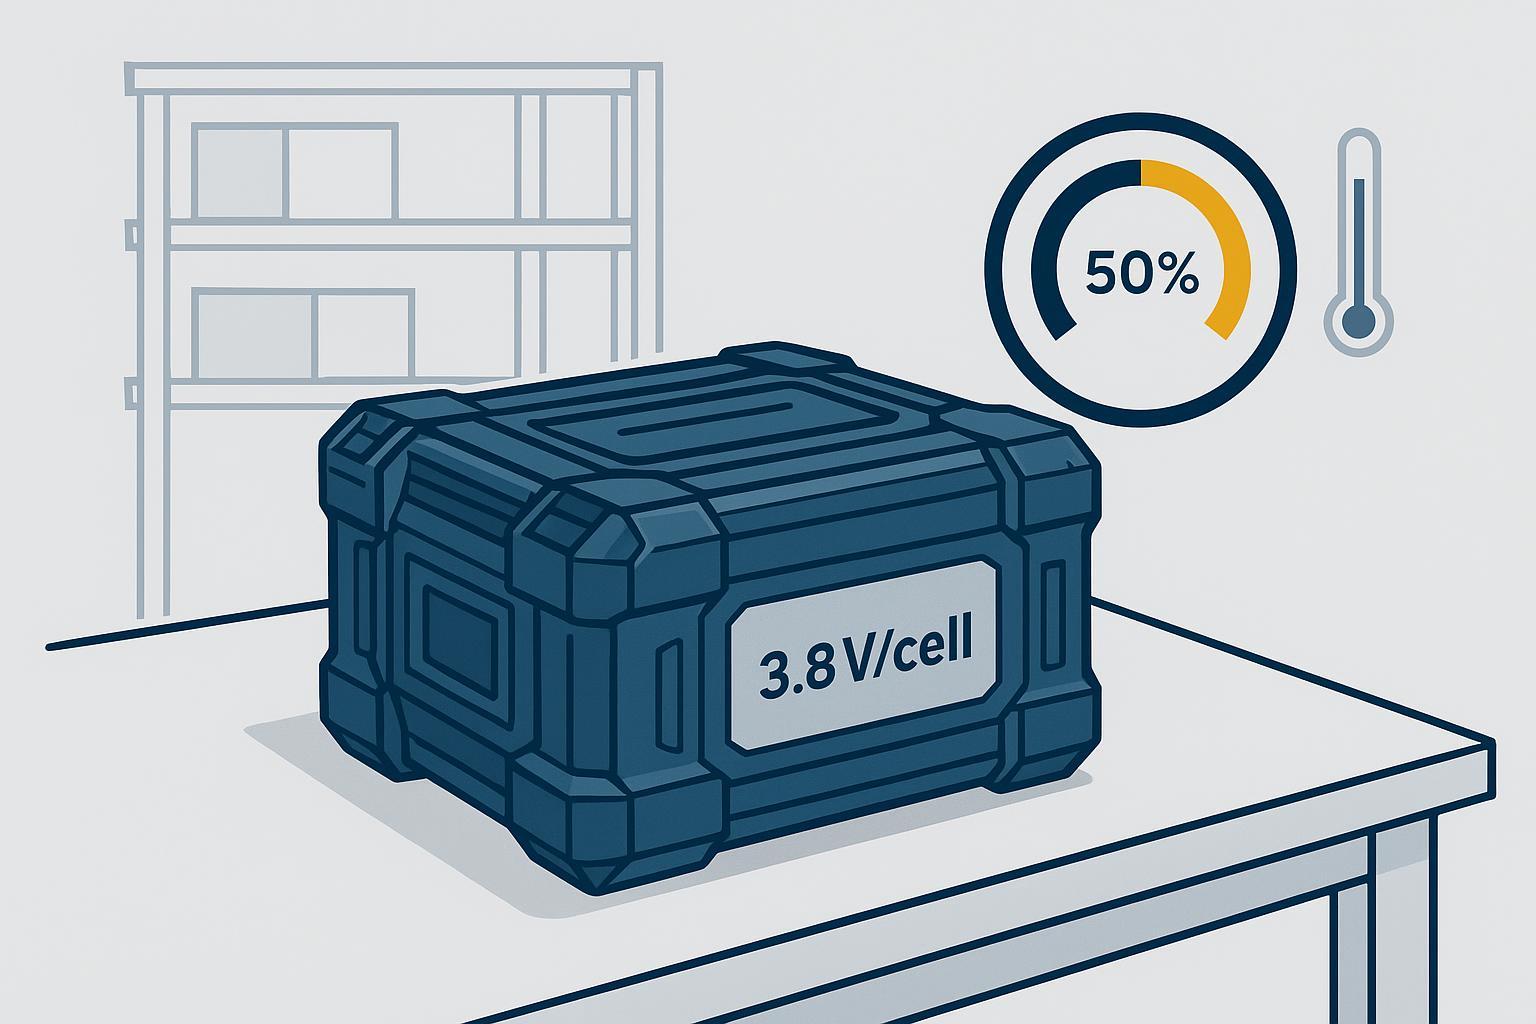
Dispatch only packs that clear a minimum SOC, a validated temperature window, and a defined landing reserve. Many fleets plan around ~±3–5% SOC estimation error at the system level, with achievable accuracy depending on chemistry, temperature range, sensor quality, and mission profile.
In-flight guardrails
Stream battery status to the ground system at an operator-defined cadence (often ~1 Hz for fleet telemetry), while recognizing that on-pack protection reacts faster. Use voltage sag, temperature, and fault flags to trigger an early RTB before a weak cell or thermal excursion becomes an abort.
Swap-hub triage
Quarantine packs that fall below your SOH floor or show abnormal DCIR growth versus peers operating under comparable temperature, cycle band, and load. Many teams start with ~20–30% investigation bands, then tune thresholds to their airframe and duty cycle.
Battery swapping vs fast charging comparison
|
Factor |
Battery swapping |
Fast charging |
|---|---|---|
|
Turnaround time |
60–90 s |
20–40 min |
|
Sorties per hour (typical) |
~3.5 |
~1.5 |
|
Battery life (planning input) |
Duty-cycle dependent |
Duty-cycle dependent |
|
Station cost |
Higher |
Lower |
|
Fleet scalability |
High |
Moderate |
|
Best fit |
High-frequency delivery |
Low-utilization fleets |
Cycle life is highly duty-cycle dependent. For heavy-load, high C-rate delivery profiles, operators often model more conservative ranges (e.g., ~500 cycles under managed slow charge vs ~300 cycles under aggressive fast charge) unless they can match lab test conditions to their mission profile.
ROI analysis for last-mile delivery fleets
For delivery fleets, ROI usually comes from utilization: how many completed missions you can run per airframe per day when turnaround is the bottleneck.
A practical way to compare swapping vs. fast charging is total cost per delivery: (energy + labor + battery wear + infrastructure) / completed missions. Treat the inputs as planning ranges that you should re-fit to your aircraft, routes, and temperature bands.
Note: Any numerical outputs from this type of model are illustrative planning results, not guaranteed field performance.
ROI modeling inputs (planning ranges, not promises)
To keep this comparison realistic, treat the numbers below as planning ranges that should be re-fit to your aircraft, route geometry, and temperature bands.
-
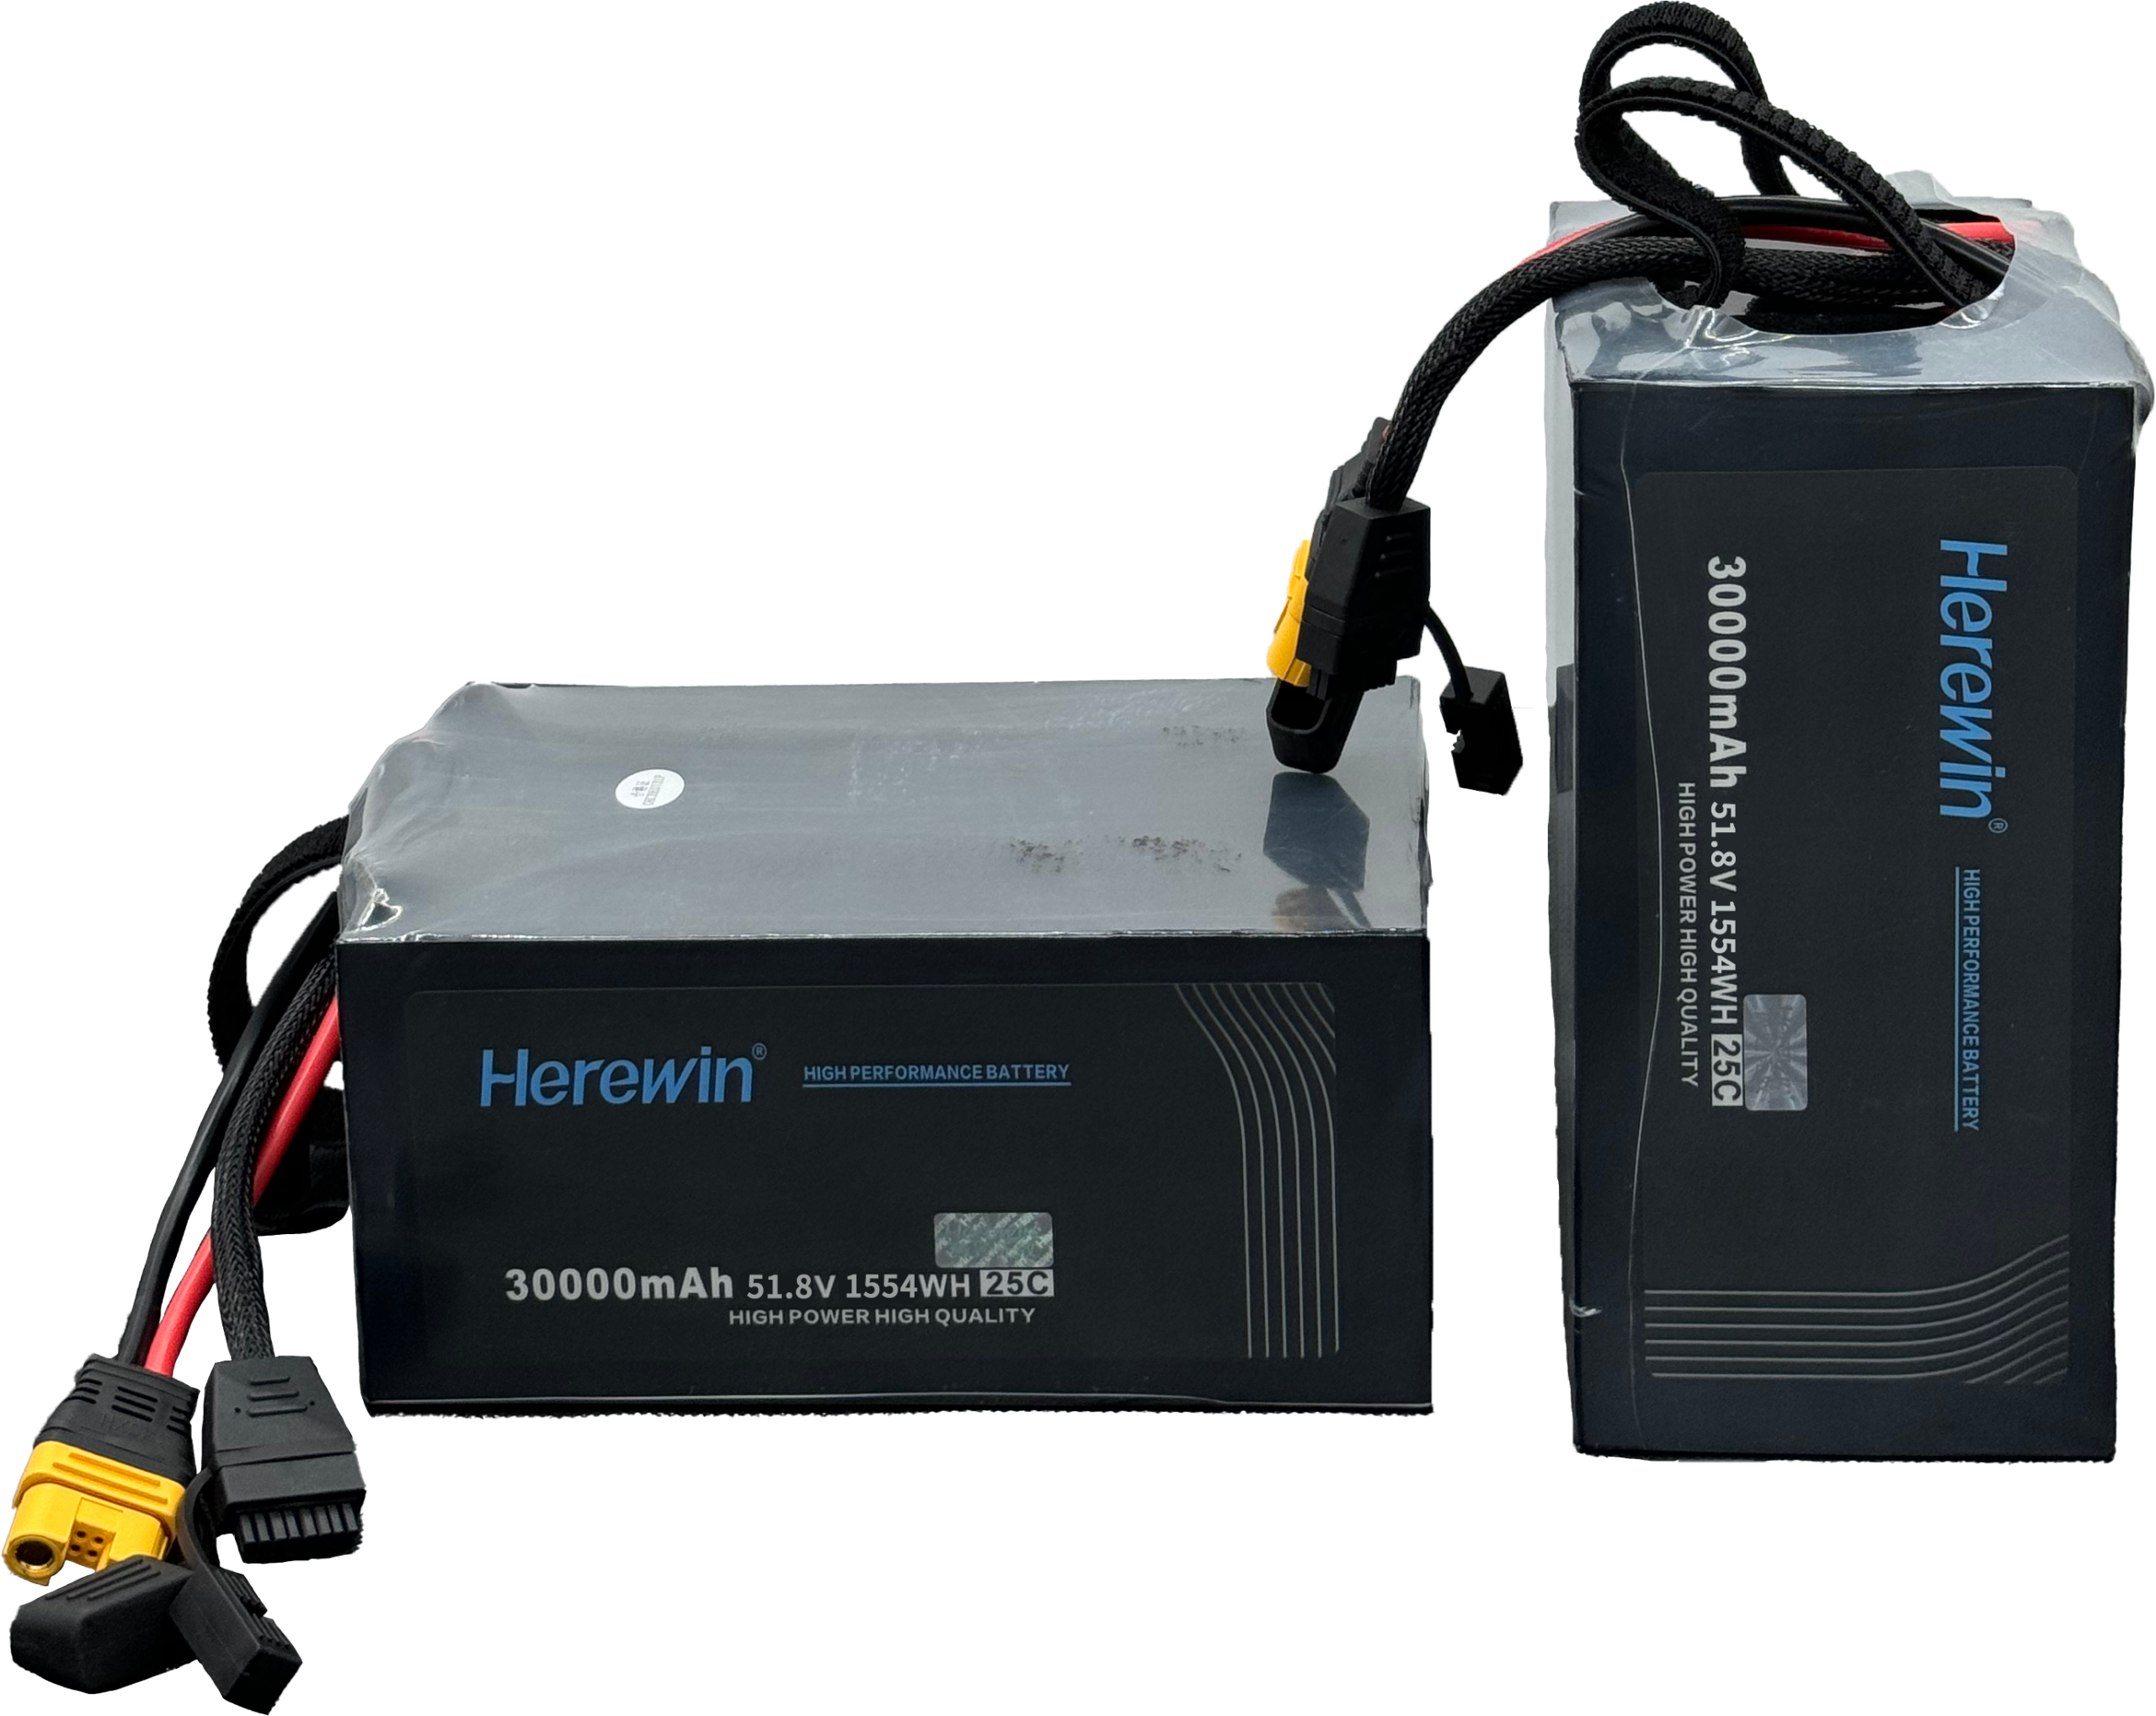
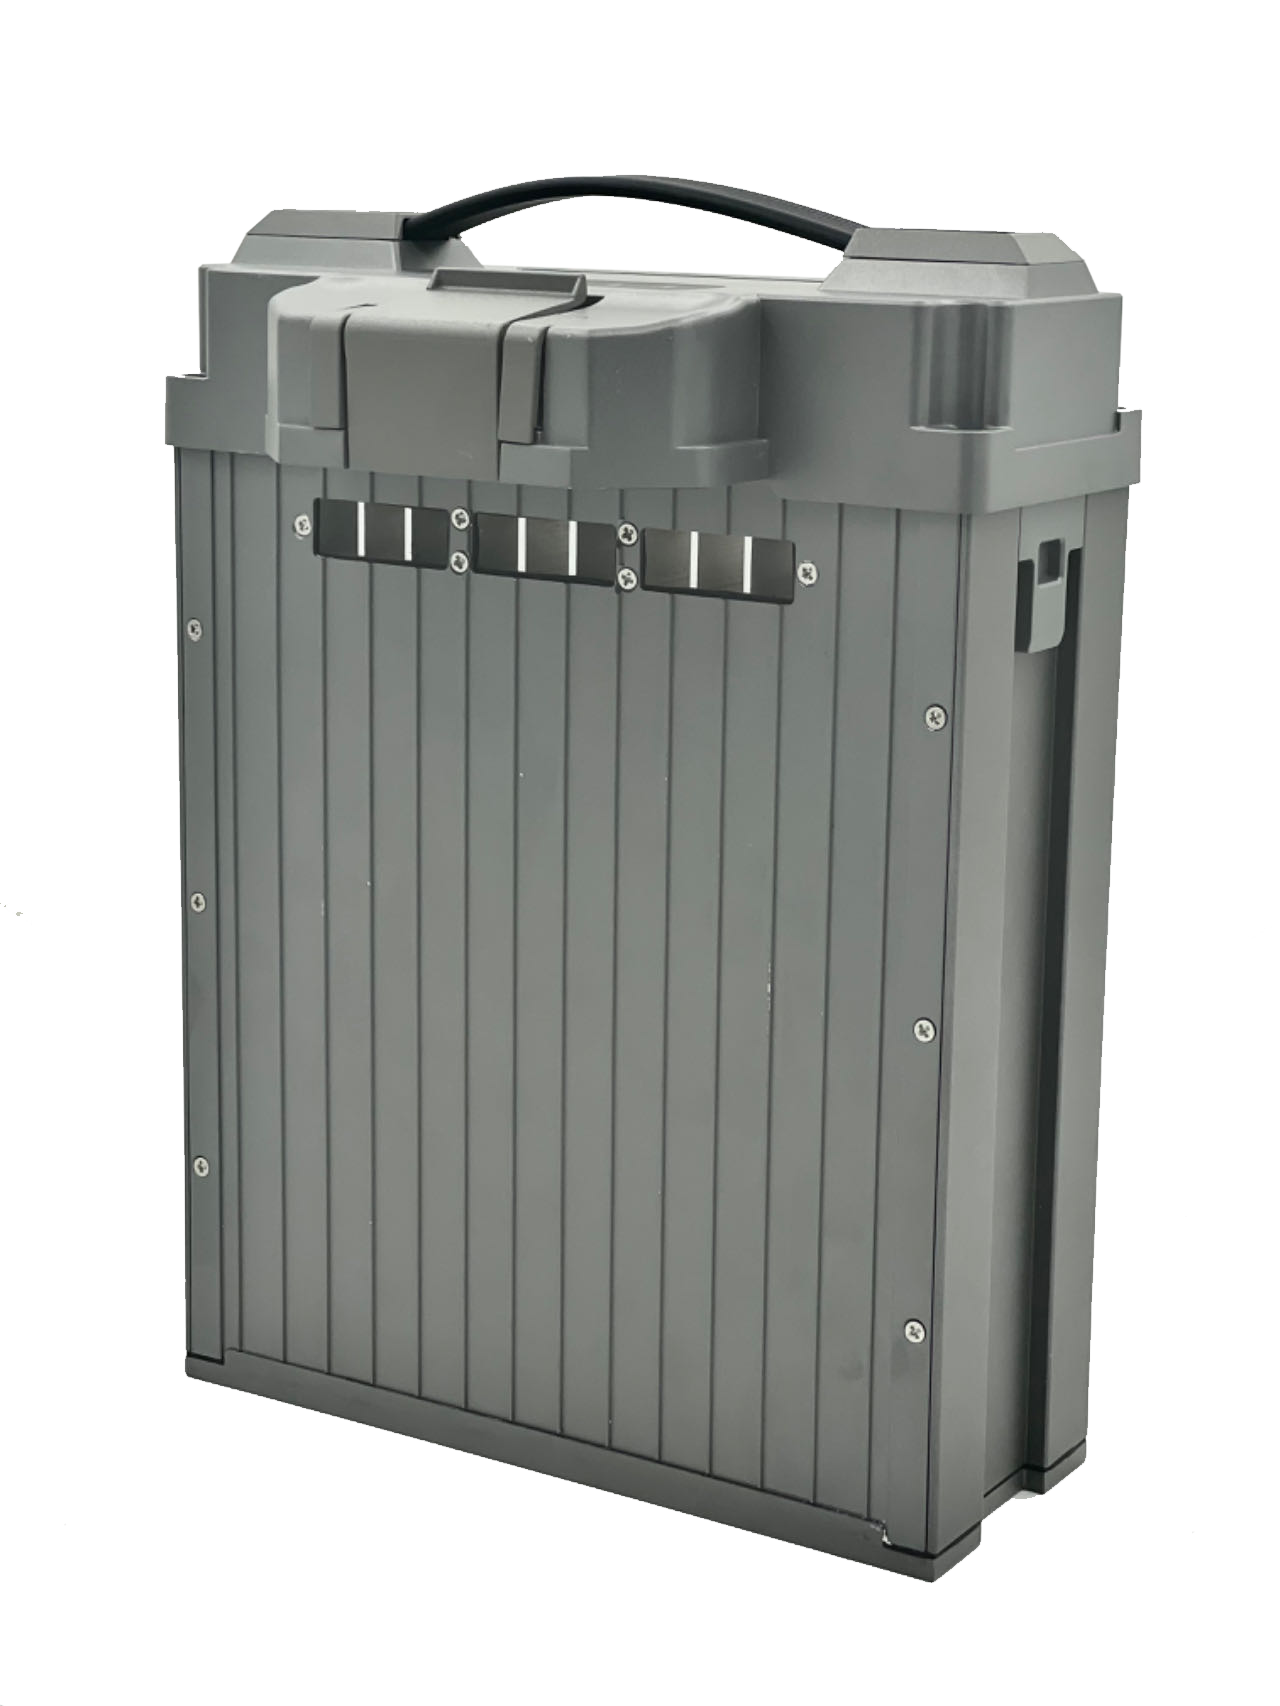
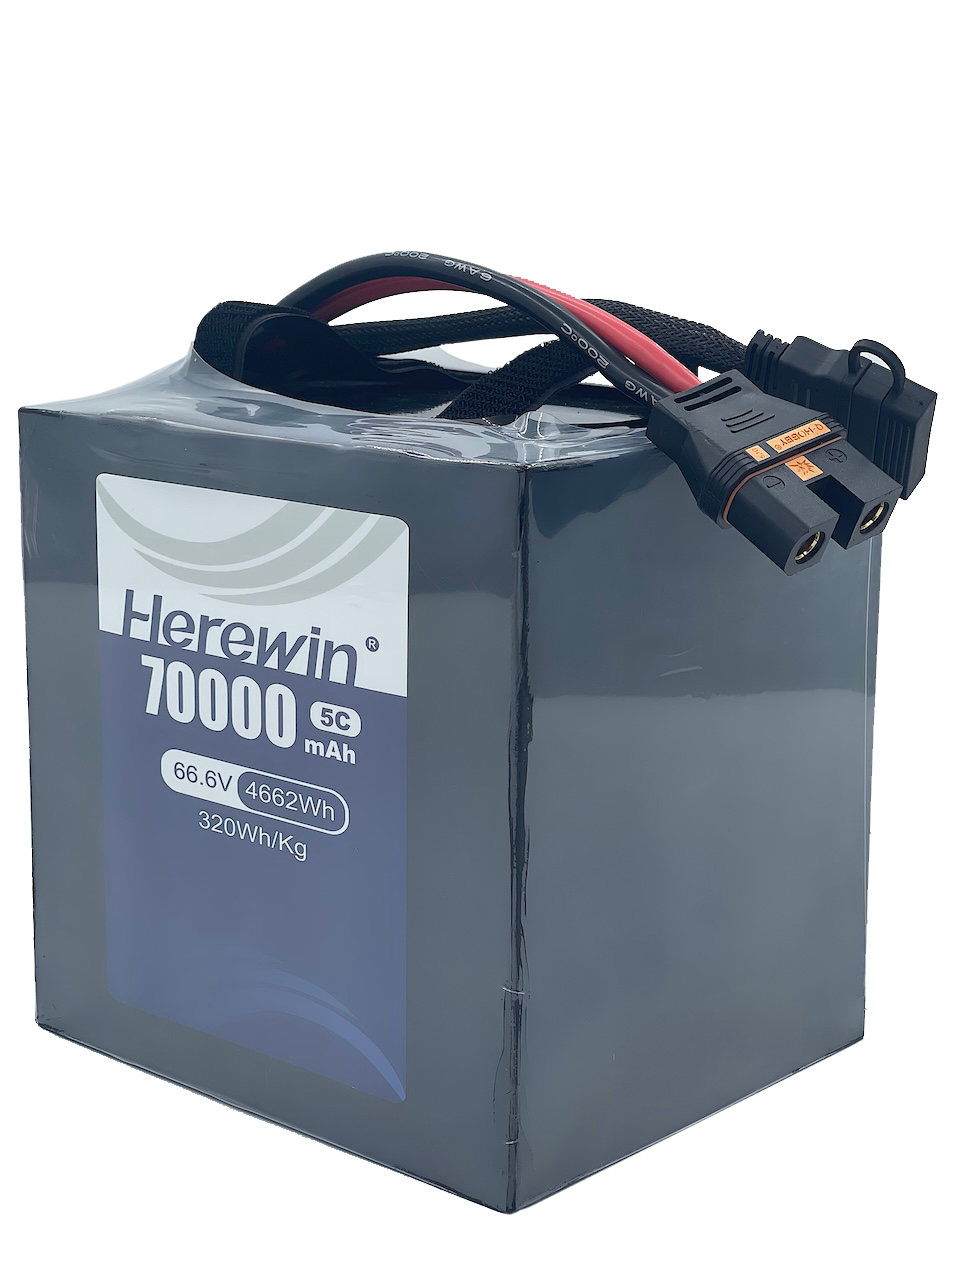
Battery reference: 12S (44.4 V) 22 Ah delivery-class pack (≈976 Wh).
(Example configuration: Herewin’s 12S/22Ah class packs listed in its drone battery category .)
-
Mission cadence assumption: short-haul flights with a few minutes of pad handling per cycle (operator- and route-dependent).
-
Charging approach:
-
Swap workflow: controlled off-vehicle charging typically modeled in the ~0.5–0.8C band.
-
On-pad fast charging: “fast” commonly implies ~1C+ and is often modeled in the ~1.5–2.0C band when thermal management allows.
-
-
Throughput planning (order-of-magnitude): swapping can reduce energy replenishment time from tens of minutes to minutes, which is why it often shifts a hub from “charging-constrained” to “mission-constrained.”
Note: Cycle-life outcomes vary widely with cell design, C-rate, depth of discharge, and temperature control. Use your own cycling data or supplier test reports if you need defensible procurement numbers.
What actually moves the economics
In many real deployments, direct cost per mission ends up in the same ballpark across swapping and fast charging once you account for energy, labor, and battery wear.
The commercial separation comes from utilization:
-
If pad dwell time limits sorties/hour, swapping expands daily delivery capacity per airframe.
-
Higher throughput increases revenue density and improves fixed-cost absorption at the hub.
Under high utilization, payback can shift from multi‑year infrastructure cycles to sub‑annual deployment timelines; at low utilization, fast charging often remains the simpler choice.
The economic advantage comes from utilization expansion, not cost reduction.
Operational Variables: Weather and Scaling
Weather changes both usable energy and risk margins. In cold conditions, internal resistance rises and voltage sag worsens under takeoff current, which can trigger conservative low-voltage behavior even when SOC looks acceptable. A practical planning move is to apply a Weather Adjustment Factor (for example, 0.65–0.85× usable Wh) in dispatch assumptions, then recalibrate SOC/SOH thresholds by temperature band.
For fleets operating lighter 6S (22.2 V) platforms, the Wh and currents scale proportionally, and the ROI trajectory remains similar: swapping wins on volume and asset longevity, while fast-charging is reserved for low-utilization sites.
Aggressive fast charging also compounds degradation risk. The U.S. National Renewable Energy Laboratory summarizes fast-charge research in its Extreme Fast Charge program.
If your fleet spans climates, maintain separate SOC/SOH calibration and replacement thresholds by temperature band so you don’t waste energy in summer or take risk in winter.
The next evolution: higher-cycle drone batteries
The next big improvement in delivery economics is less about flying farther and more about replacing batteries less often—i.e., higher cycle life.
You’ll see public roadmaps citing targets beyond ~1,200 cycles and sometimes approaching ~2,000 cycles, but typically under specific lab protocols. Treat those figures as hypotheses you validate against your depth of discharge, charge rate, thermal control, and mission profile—not as universal specs.
Why battery swapping is becoming the preferred architecture for drone logistics
Battery strategy is evolving in stages:
-
Aircraft-centric: maximize single-flight endurance; treat batteries as consumables.
-
Energy-centric: optimize charging, swapping, and maintenance; treat batteries as managed assets.
-
Fleet-centric: dispatch decisions are driven by SOC accuracy, SOH confidence, and hub throughput.
-
Battery-as-an-asset: packs become tracked inventory with clear lifecycle rules, quarantines, and refurbishment decisions—so operations scale without “heroic” maintenance.
Swapping fits this progression because it turns energy replenishment into a predictable, parallelized process. Fast charging can still work well in low-utilization fleets, but at high cadence it often reintroduces queuing, heat, and premature aging as the limiting factors.
FAQ
What is a hot-swappable drone battery?
A hot-swappable battery is designed for rapid removal and insertion so an aircraft can return to service within seconds to minutes, while depleted packs recharge off the vehicle.
Which drones support hot-swap batteries?
Enterprise ecosystems (dock-based operations) and many industrial logistics platforms can support hot-swap, either through closed-loop battery/charger designs or standardized blind-mate interfaces used in open platforms.
Is battery swapping better than fast charging?
For high-frequency delivery, swapping usually wins on throughput and predictability. For low-utilization fleets, fast charging can be simpler and cost-effective.
How many cycles can a delivery drone battery last?
Cycle life is duty-cycle dependent. Conservative planning inputs often use ~900 cycles under managed slow charge and ~500 cycles under aggressive fast charging, while heavy-load, high C-rate delivery profiles may model lower ranges (e.g., ~500 vs ~300). Some semi-solid chemistries may test higher under specific lab protocols.
Does cold weather reduce drone battery life?
Yes. Cold increases internal resistance and voltage sag and can reduce usable energy. Operational mitigations include preheating, tighter dispatch reserves, and weather-adjusted ROI assumptions.
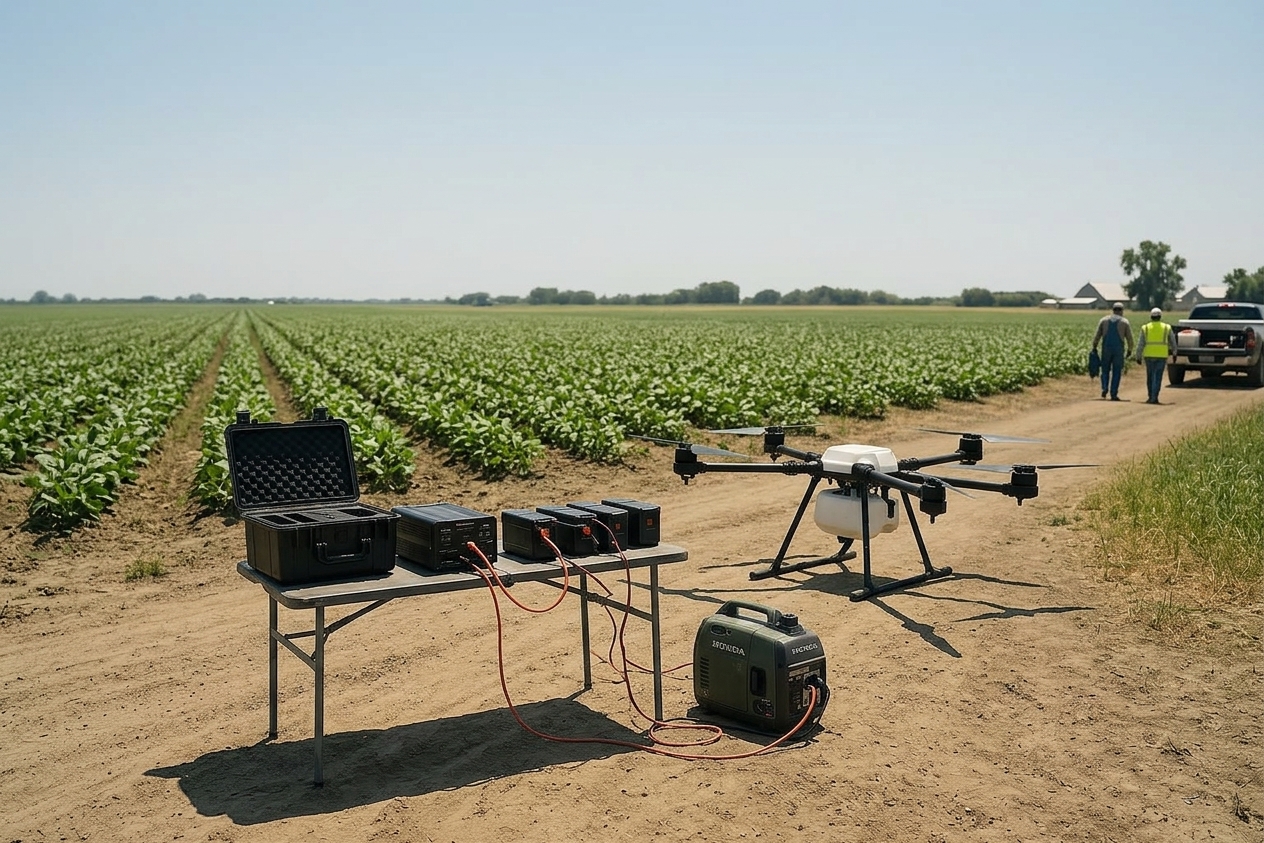
Operational validation layer
Peak windows are where the economics and failure modes show up. In a dense hub running back-to-back short-range sorties with frequent takeoff/climb current spikes, reliability is often limited by power stability and protection behavior—not headline capacity.
To reduce abort risk under peak demand, fleets typically enforce telemetry-driven rules (DCIR screening, thermal-aware dispatch, and imbalance monitoring). Operationally, swapping tends to shift the hub from “charging-constrained” to “mission-constrained,” improving predictability when utilization is high.
Disclaimer: Outcomes vary with weather, routing geometry, staffing, and charging protocol. Treat any figures as operational modeling outputs—not guaranteed field results.
Don’t choose swapping or fast charging as a battery feature—choose it as an operating model. If turnaround is your binding constraint, swapping is often the faster path to more deliveries per airframe; if utilization is low, fast charging can remain the simplest path.
Before you scale either approach, validate the system end-to-end: prove connector durability under your insertion rate, confirm thermal behavior at takeoff/hover loads, and make sure your SOC/SOH rules are enforceable through telemetry. UN 38.3 and IEC 62133-2 help establish baseline safety, but they don’t replace operational validation in your weather, routes, and staffing model.